Sample Category Title
UK Braces For Second Parliament Vote On Brexit
The UK parliament is to vote on Theresa May's revised Brexit plan, with 60 days left for the UK to leave the EU. Analysts currently seem to maintain the opinion that should Theresa May's plan B pass, we could see the pound strengthening. On the other hand, should Parliament opt to pass an amendment (Cooper) delaying Brexit by extending article 50, in case of no deal by February 26th, the pound could also be supported, as imminent danger is being postponed. It should be noted that a no deal Brexit cannot be ruled out and an amendment tabled to scrap the Irish backstop (Brady), if voted by the UK parliament could raise the chances for such a scenario. Media reported that Theresa May, could be preferring the Brady amendment, as in such a scenario the UK Parliament would be sending a clear message to Brussels about the Irish backstop. We expect the event to create high volatility for the pound and should the UK parliament move towards an agreed Brexit solution we could see the pound strengthening. Please be advised that media indicate that the voting will take place in the UK evening, probably begin at 19:00 (GMT). Cable maintained a sideways motion yesterday, below the 1.3175 (R1) resistance line. Technically, it should be noted that the pair's price action threatens to break the upward trendline incepted since the 21st of January, making the particular moment a make or break point for the pair's direction. Should the pair break the prementioned upward trendline we could see it maintaining a sideways movement, if not we maintain the bullish momentum. Should the bulls dictate the pair's direction, we could see the pair breaking the 1.3175(R1) resistance line and aim if not break the 1.3280 (R2) resistance level. Should the bears take over we could see cable, breaking the 1.3070 (S1) support line and aim for the 1.2960 (S2) support level. The pair's price action is expected to show high volatility (to either direction) today, as the UK parliament will be having another vote regarding Brexit, so some caution is advisable as in extreme case scenarios, we could see cable breaking all three support or resistance levels.
US-Sino trade tensions rise as US charges Huawei
The US on Monday pressed charges against Huawei, its chief financial officer and two affiliates with bank and wire fraud to violate sanctions against Iran. According to media China has expressed serious concerns about the US charges against Huawei and the Chinese foreign ministry stated that Beijing would protect the lawful interests of Chinese companies. The escalation of the case, which has already increased tensions between the two countries (and Canada) may threaten the imminent US-Sino trade negotiations this week. Analysts point out that, after the US pressing charges on Huawei, there may be much less of a chance for the US-Sino negotiations to produce positive results. We see the case for any possible negative effects to hit the equity markets and the AUD, while on the other hand it could support safe haven assets like JPY. AUD/USD retained a range bound movement yesterday and during today's Asian session, testing the 0.7150 (S1) support line. We could see the pair maintaining its sideways movement, yet we retain reservations for a possible bearish outlook for the pair as the fundamentals could be may not favor the AUD side. Should the pair come under the selling interest of the market, we could see it breaking the 0.7150 (S1) support line and aim for the 0.7065 (S2) support barrier. Should the market favor the pair's long positions, we could see the pair breaking the 0.7230 (R1) resistance line and aim for higher grounds.
Today's other economic highlights
In today's American session, we get from the US the CB consumer confidence indicator for January and later on the API weekly crude oil inventories figure. As for speakers BoE's Andy Haldane speaks.
GBP/USD H4
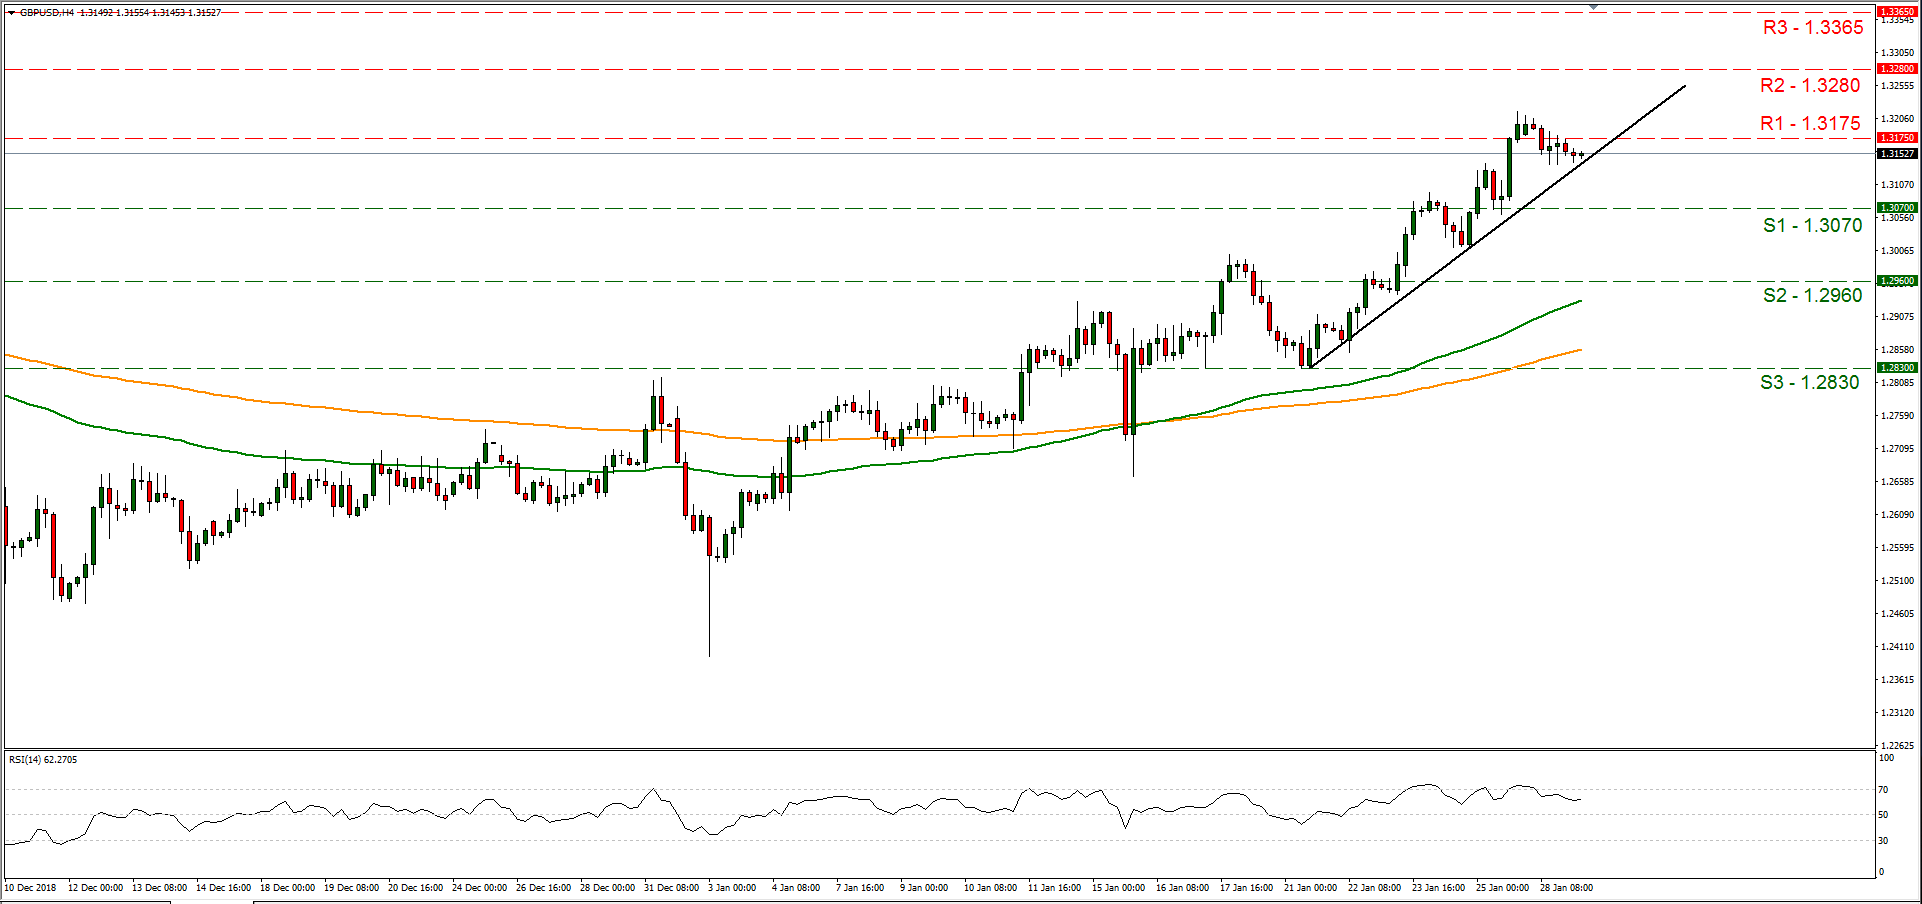
Support: 1.3070 (S1), 1.2960 (S2), 1.2830 (S3)
Resistance: 1.3175 (R1), 1.3280 (R2), 1.3365 (R3)
AUD/USD H4
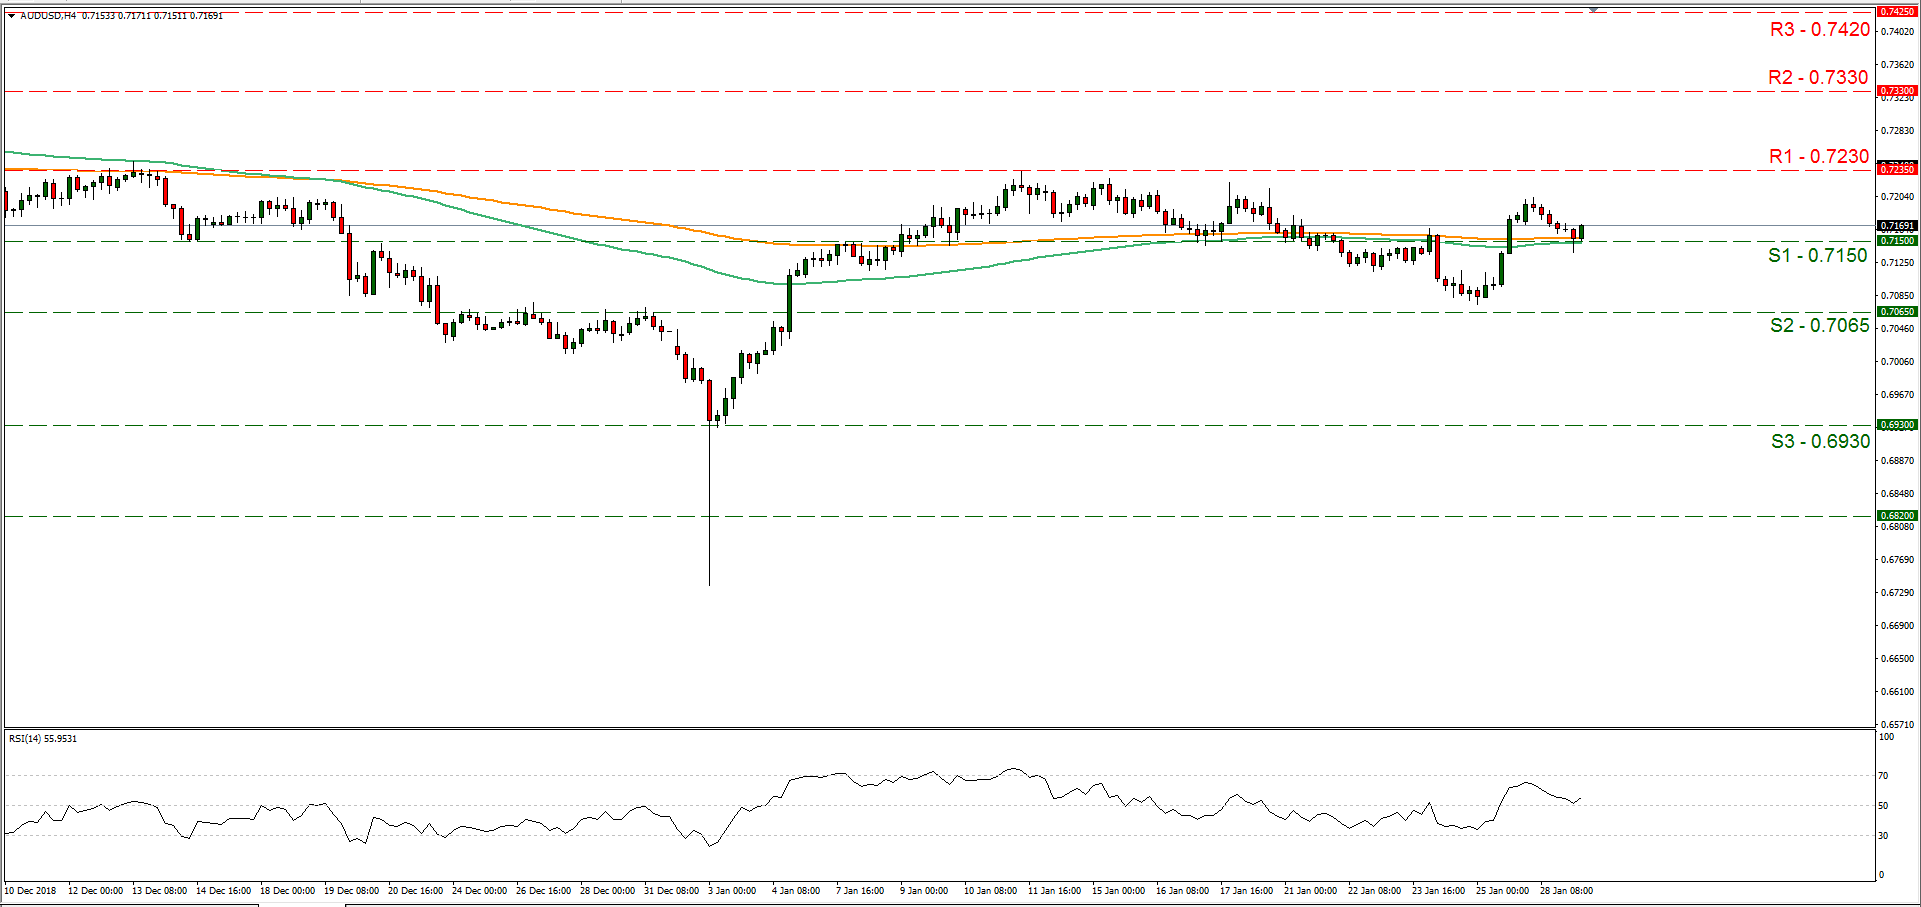
Support: 0.7150 (S1), 0.7065 (S2), 0.6930 (S3)
Resistance: 0.7230 (R1), 0.7330 (R2), 0.7420 (R3)
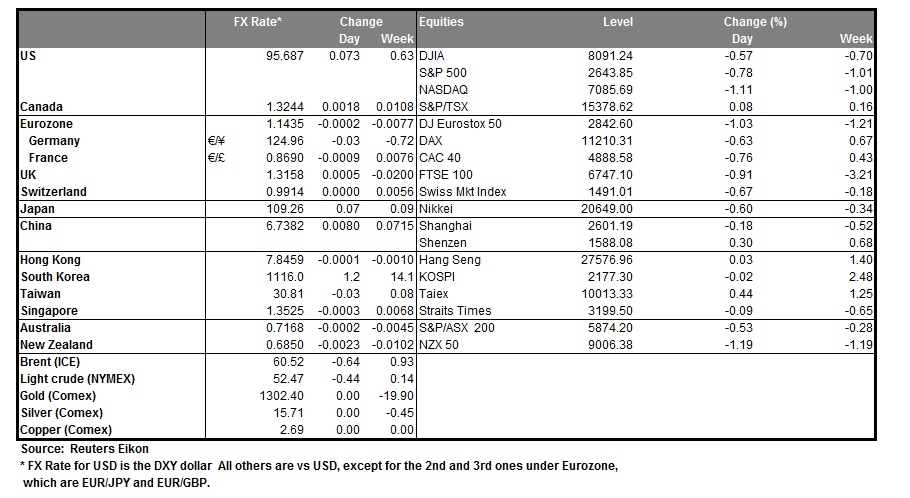
The Analytical Overview Of The Main Currency Pairs
The EUR/USD currency pair
Technical indicators of the currency pair:
Prev Open: 1.14006
Open: 1.14253
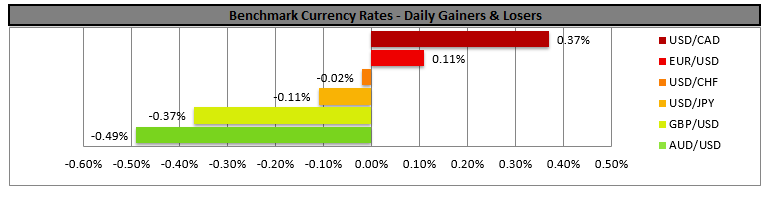
% chg. over the last day: +0.15
Day's range: 1.14204 – 1.14449
52 wk range: 1.1214 – 1.2557
EUR kept rising against the USD. Right now the local support and resistance levels are 1.14200 and 1.14450. Mario Draghi, the head of the Central Bank of Europe, is worried about the growing risks on the global markets. The regulator intends to keep the monetary policy the same. The investors are waiting for the Federal Reserve meeting. Keep an eye on the US/China trading conflict and open positions from the key levels.
At 17:00 (GMT +2:00) US will publish the Customer Trust Index.
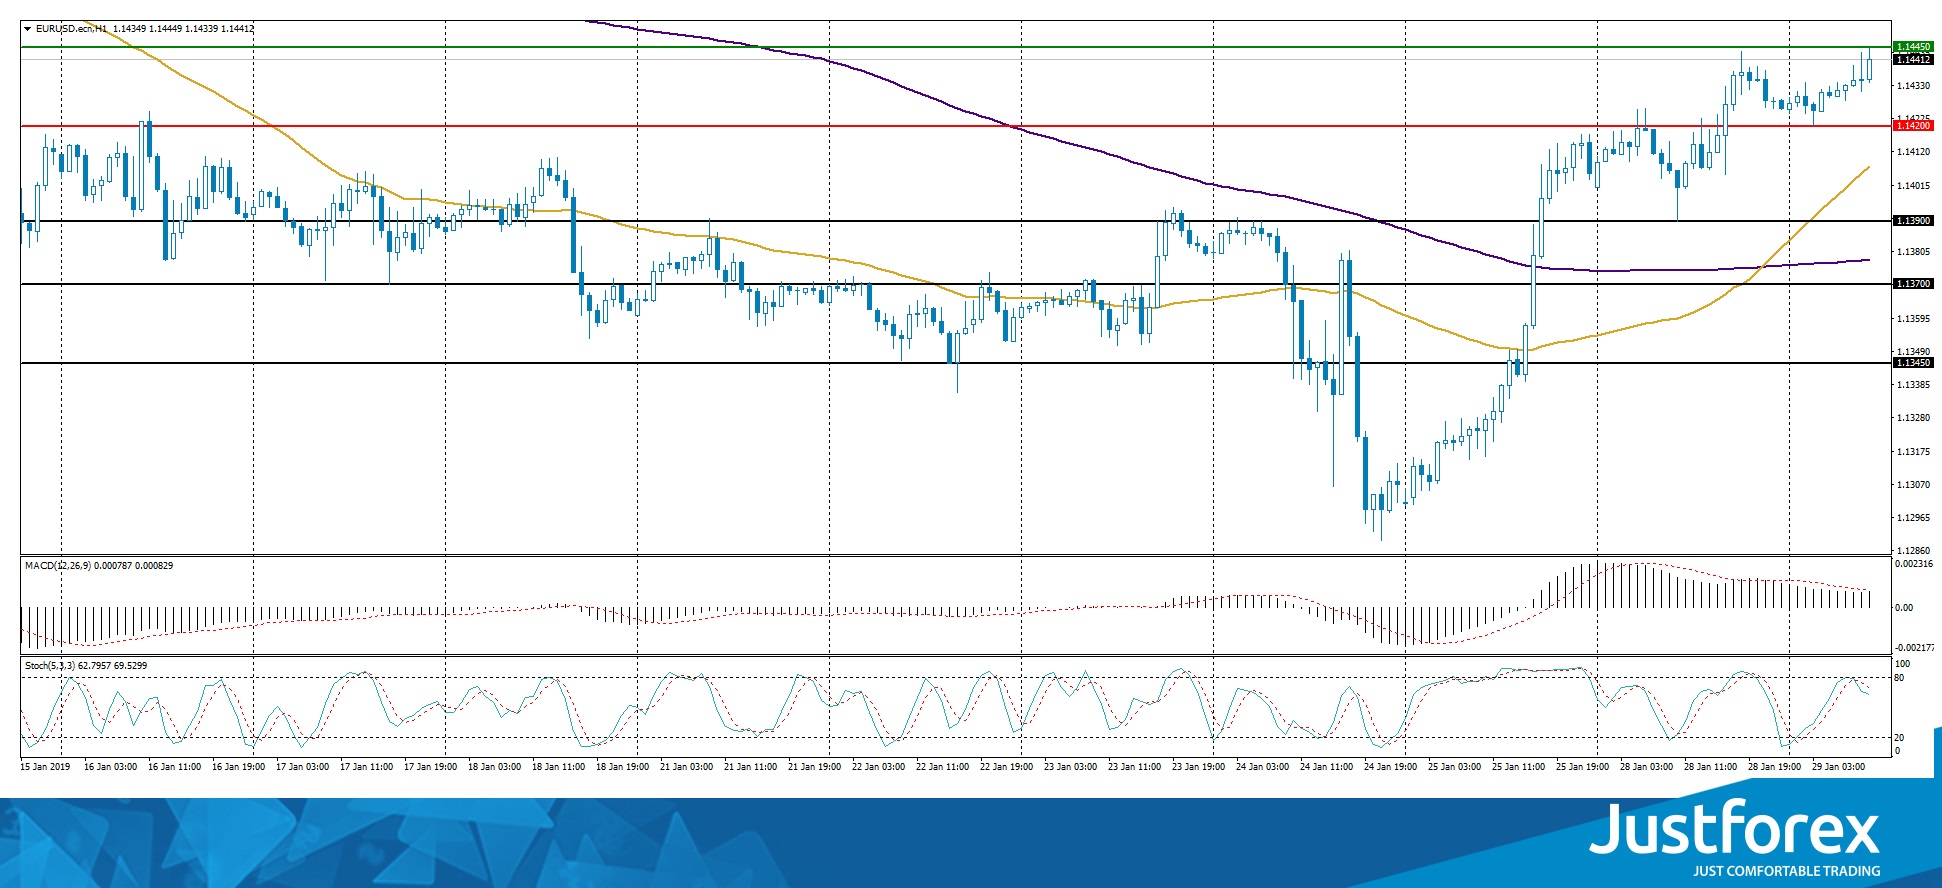
The price fixed above 50 MA and 200 MA which showcases the power of the buyers.
The MACD histogram is in the positve zone and keeps rising which gives a signal to buy EUR/USD.
The Stochastic Oscillator is in the neutral zone, the %K line is below the %D line which shows a bearish mood.
Trading recommendations
Support levels: 1.14200, 1.13900, 1.13700
Resistance levels: 1.14450, 1.15000
If the price fixes above 1.14450, expect the price to grow toward 1.14800-1.15000.
Alternatively the price can fall toward 1.14000-1.13800.
The GBP/USD currency pair
Technical indicators of the currency pair:
Prev Open: 1.31838
Open: 1.31520
% chg. over the last day: -0.36
Day's range: 1.31294 – 1.31683
52 wk range: 1.2438 – 1.4378
The pound has stabilized around the key range of 1.31300 and 1.32000. The financial market participants are waiting for the Brexit vote in the parliament. Today you should minimize risks when opening GBP/USD orders.
Keep an eye on the US economic reports.
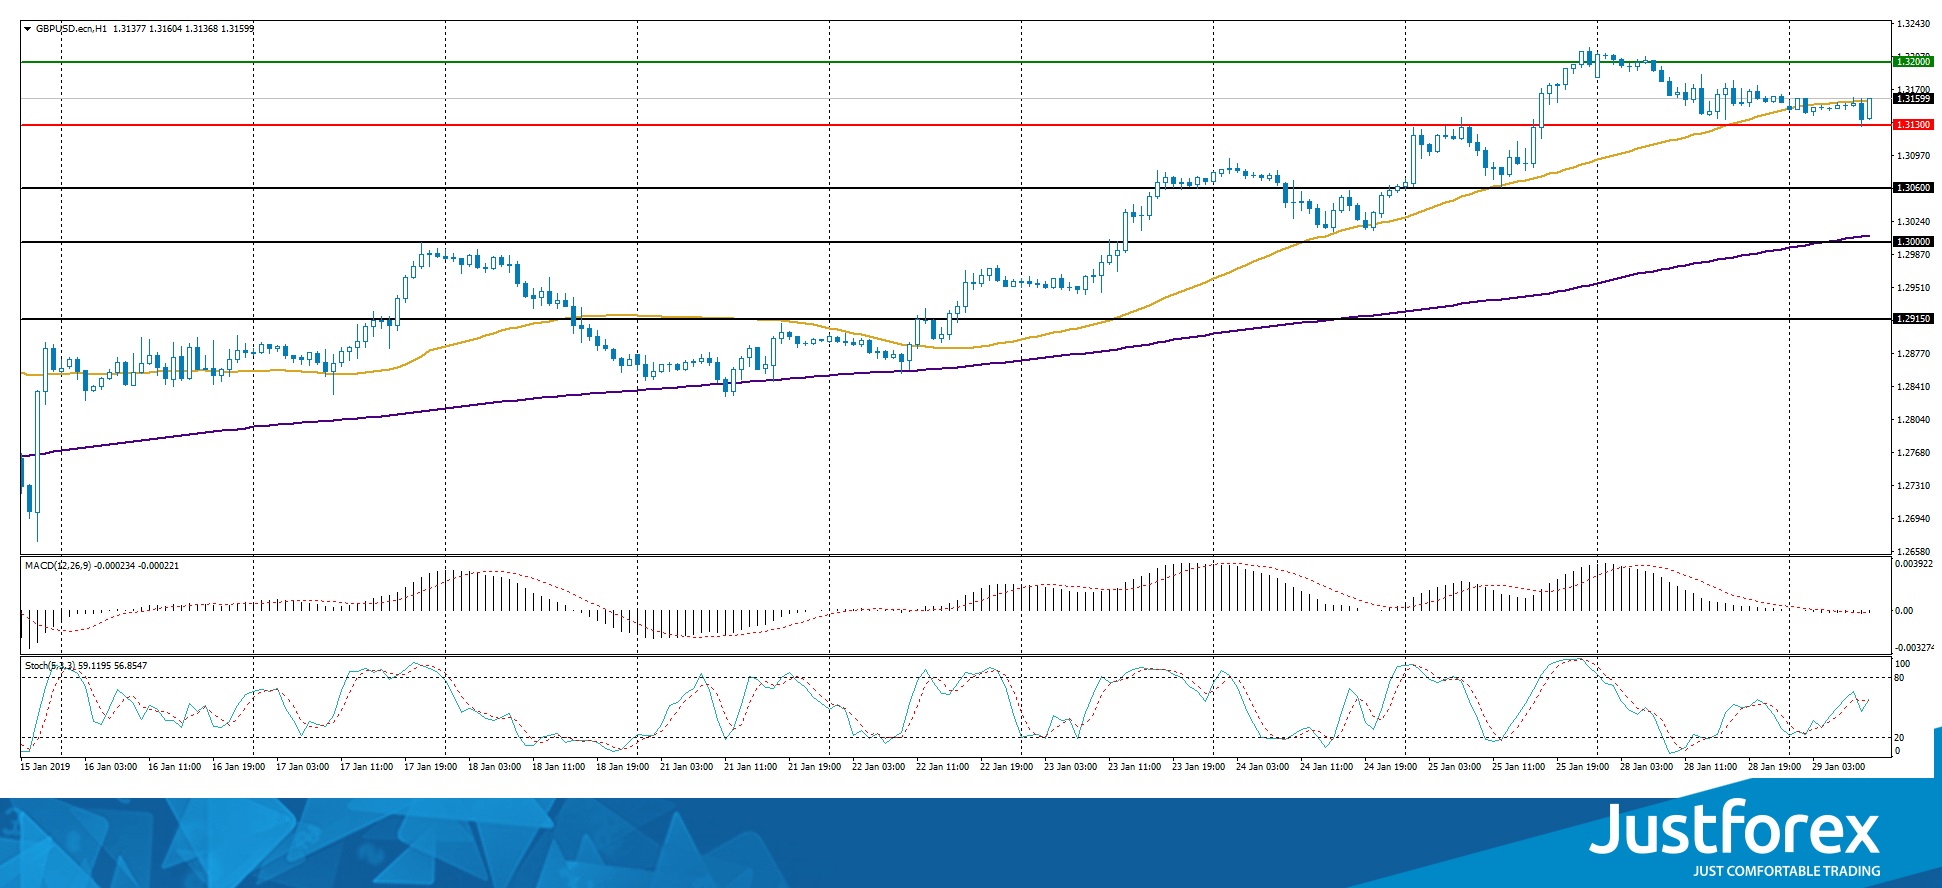
The indicators do not provide precise signals, the price has crossed 50 MA.
The MACD histogram is close to 0.
The Stochastic Oscillator is in the neutral zone, the %K line is crossing the %D line. There are no signals at the moment.
Trading recommendations
Support levels: 1.31300, 1.30600, 1.30000
Resistance levels: 1.32000, 1.32500
If the price fixes above 1.32000 expect it to grow further toward 1.32500-1.32750.
Alternatively, the quotes can fall toward 1.30700-1.30400.
The USD/CAD currency pair
Technical indicators of the currency pair:
Prev Open: 1.32183
Open: 1.32592
% chg. over the last day: +0.30
Day's range: 1.32448 – 1.32784
52 wk range: 1.2248 – 1.3664
Yesterday USD recovered against the CAD. Right now the quotes are moving sideways. The trading instrument created the local support and resistance levels at 1.32500 and 1.32800. USD/CAD has a tendency to descend. You should open positions from the key levels. Keep an eye on the US newsfeed.
The Economic News Feed for 29.01.2019 is calm.
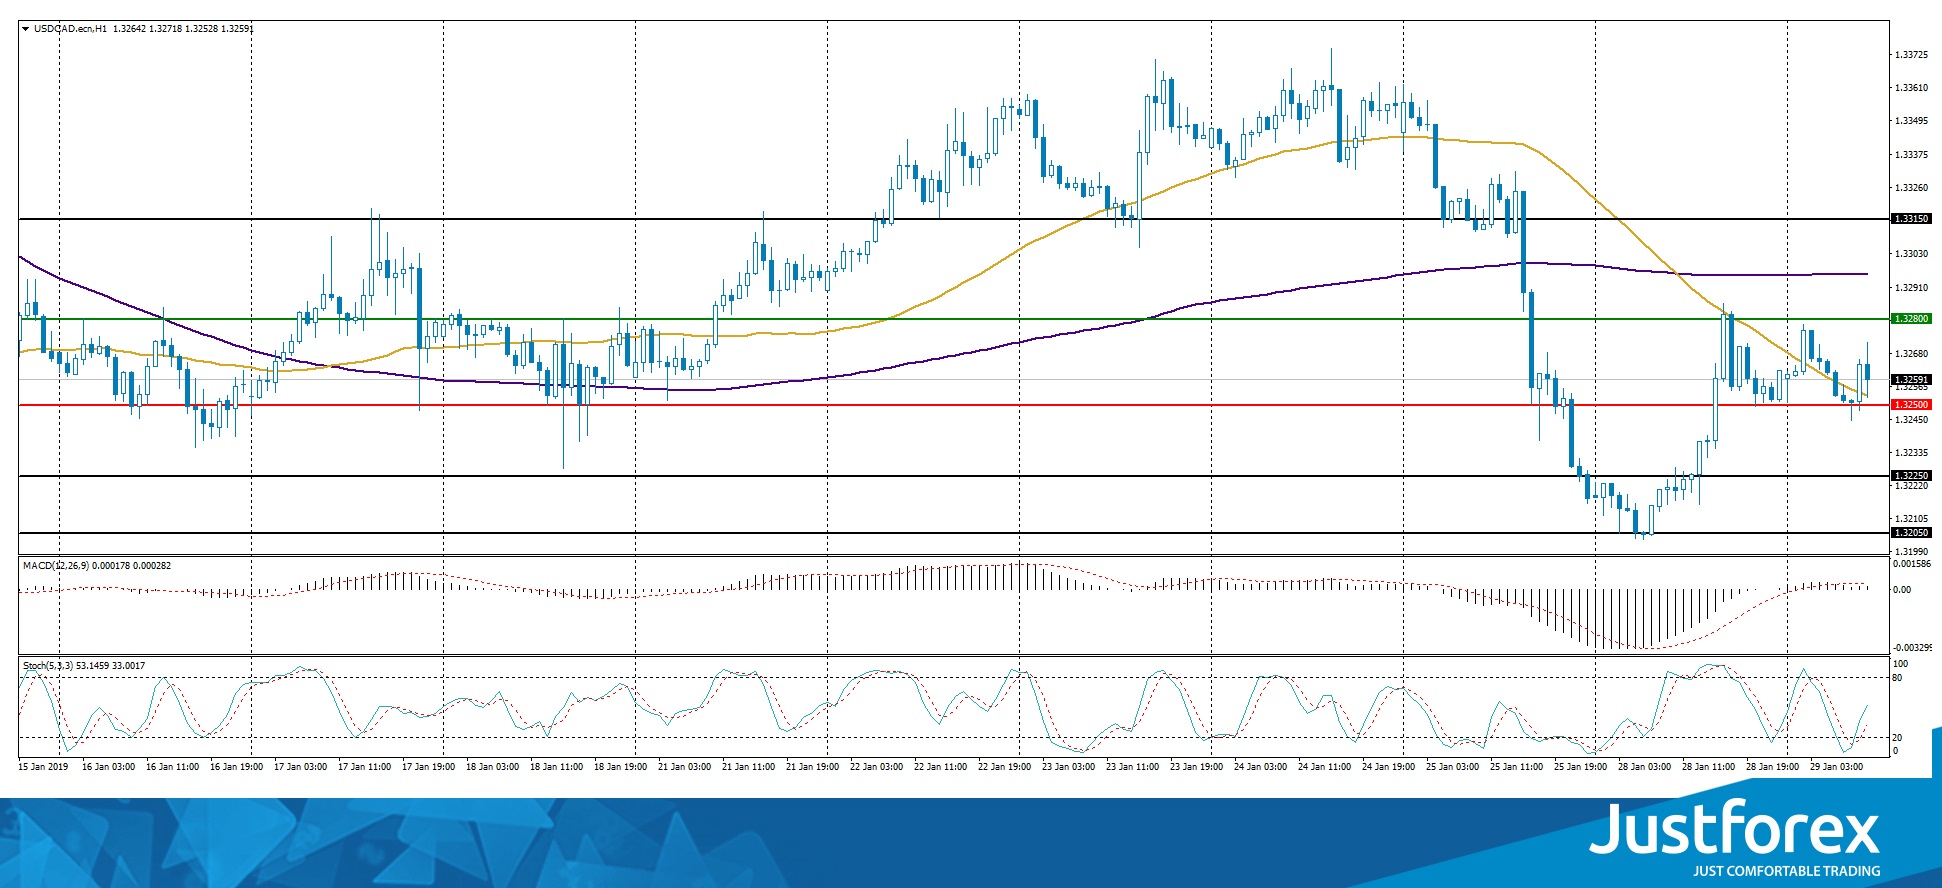
The indicators do not provide precise signals, the price fixed betwee 50 MA and 200 MA
The MACD histogram is close to 0.
The Stochastic Oscillator is in the neutral zone, the %K line is above the %D line which gives a sinal to buy USD/CAD..
Trading recommendations
Support levels: 1.32500, 1.32250
Resistance levels: 1.32800, 1.33150
If the price fixes below the local support 1.32500 expect the quotes to fall further toward 1.32250-1.32000..
Alternatively the quotes can recover toward 1.33000-1.33200.
The USD/JPY currency pair
Technical indicators of the currency pair:
Prev Open: 109.541
Open: 109.317
% chg. over the last day: -0.14
Day's range: 109.130 – 109.392
52 wk range: 104.56 – 114.56
USD/JPY technical picture remains ambiguous. The yen remains in a flat. The key range is 109.150-109.400, with prospects to descend. Keep an eye on the US Treasury bonds yield and open positions from the key levels.
The Economic News Feed for 29.01.2019 is calm.
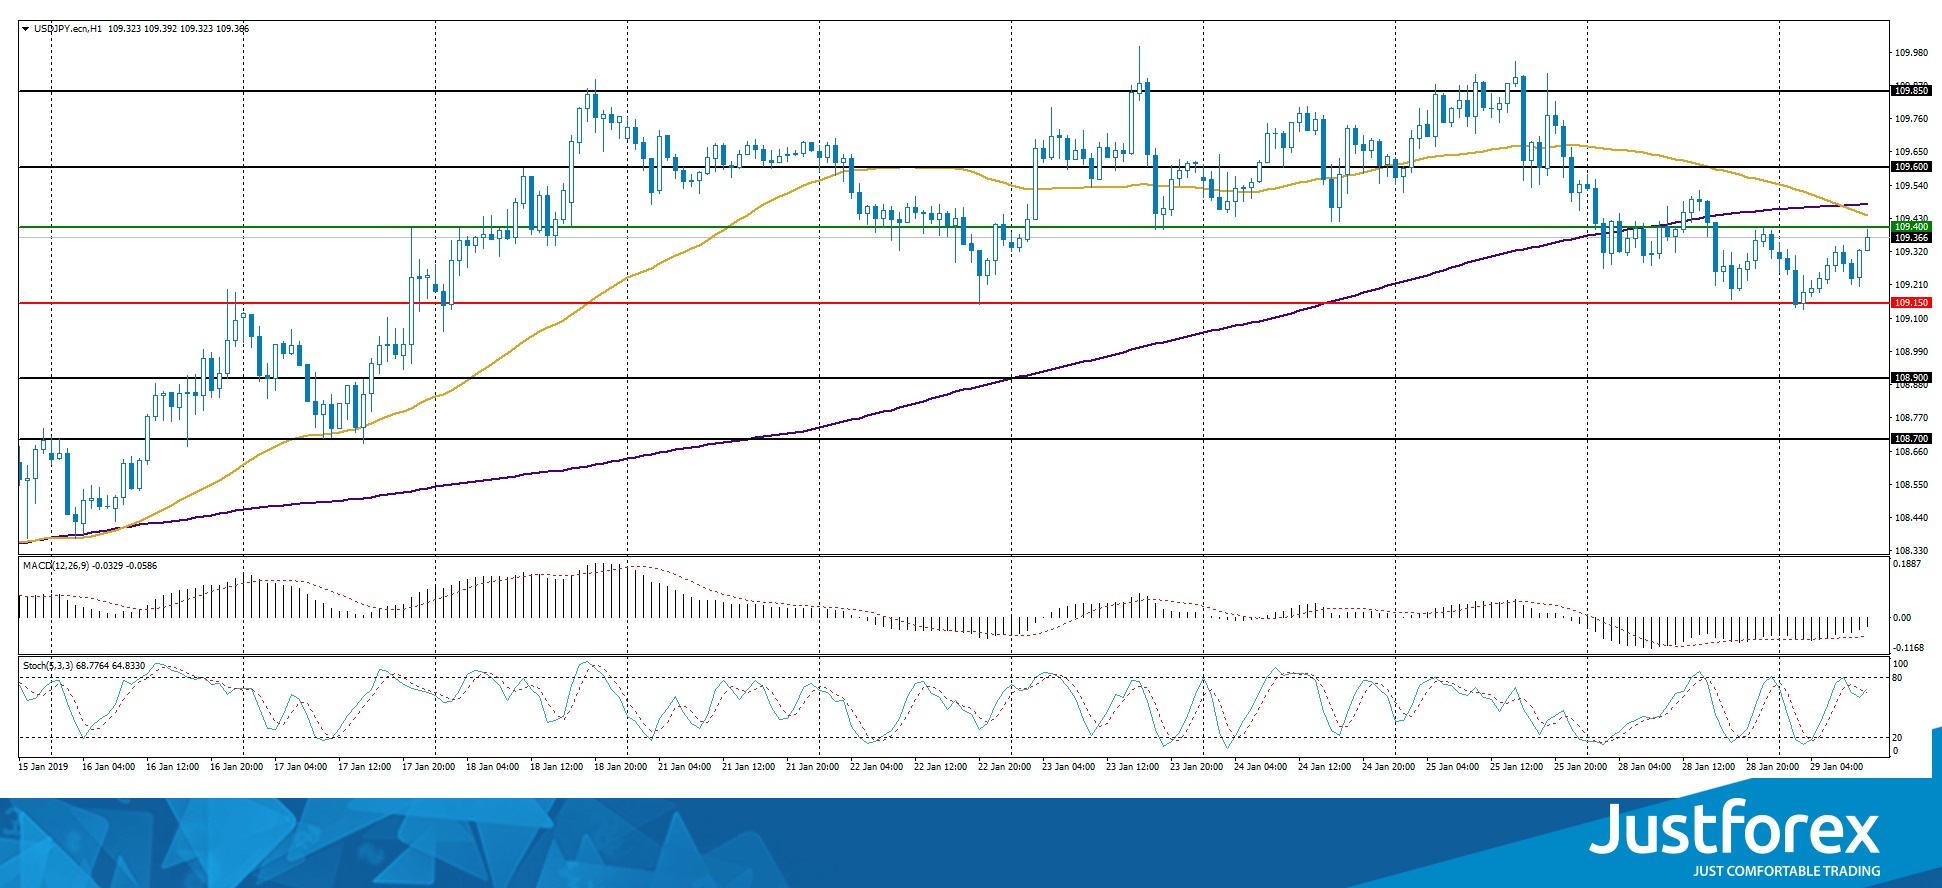
The indicators do not provide precise signals, the price has crossed 50 MA and 200 MA.
The MACD histogram is in the negative zone but above the signal line which gives a weak signal to sell USD/JPY.
The Stochastic Oscillator is in the neutral zone, the %K line is crossing the %D line. There are no signals at the moment..
Trading recommendations
Support levels: 109.150, 108.900, 108.700
Resistance levels: 109.400, 109.600, 109.850
If the price fixes below 109.150, expect the quotes to fall toward 108.900-108.700.
Alternatively the quotes can grow toward 109.600-109.800.
Sterling Could Drop Like A Rock
Sterling needs one the biggest bad omens disappeared which is no no-deal outcome. It is this particular scenario which is keeping the currency on a very tight leash. If such scenario ever becomes a reality, the currency can drop like a rock. The currency is highly sensitive to news ahead of today’s crucial vote in Parliament. If the House of Commons fails to ratify a Brexit deal, there will be no choice but to tumble out of the block without having any agreement in place.
Theresa May, the British prime minister, is in danger of suffering another defeat in the parliament today which could result in her losing control of Brexit to parliament. She suffered the biggest defeat in the House of Commons back on Jan. 15 when her team members rejected her divorce deal. She was adamant at that time that the deal she has is the best deal, and there is no deal except this. However, the prime minister had plenty of time after her historical loss to soul search and look for the answers through which she can get the backing of her own party members.
In a shocking move, May finally decided that there could be a better deal which she has secured; there is an alternative solution to the backstop plan for the Irish border. Yesterday evening, she declared to her self that it is more important to get the support of her own party members and worth giving up her stubbornness by abandoning the agreement which has called the “only agreement”. Remember, this “only agreement” took her 18 months to negotiate it.
In today’s vote, May’s ultimate goal is to avoid another defeat; she is going to block a proposal under which Parliament can prevent a no-deal divorce scenario by delaying the Brexit.
She clearly needs to win the support of Conservative hardline Brexit backers and bring them back in her corner. The hope is that she can persuade the EU to change their stance towards the Irish backstop by radically changing it. The alternative for her is that this agreement is all together ditched and thus opening a door for a new deal. Now, in order to have a new deal, the EU has shown very little appetite so far. In order for Theresa May to have this the way she is thinking, the EU officials have indicated that it would require movement in the term so called by her red lines.
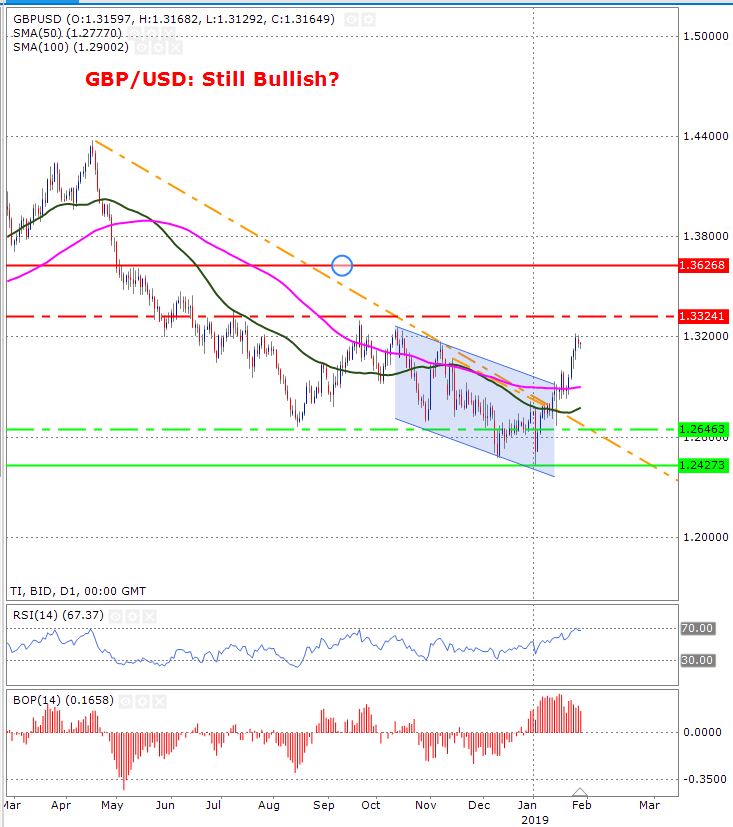
As long as (in today’s vote) the no-deal Brexit outcome becomes no longer a possibility, the probabilities are in favour of sterling to move higher. Speaking from a technical analysis perspective, the current bull momentum is strong as it has broken its downward trend line and it is trading above the 50 and 100-day moving averages (shown in green and pink respectively). The move towards the 1.3324 is possible today depending on the outcome of the vote.
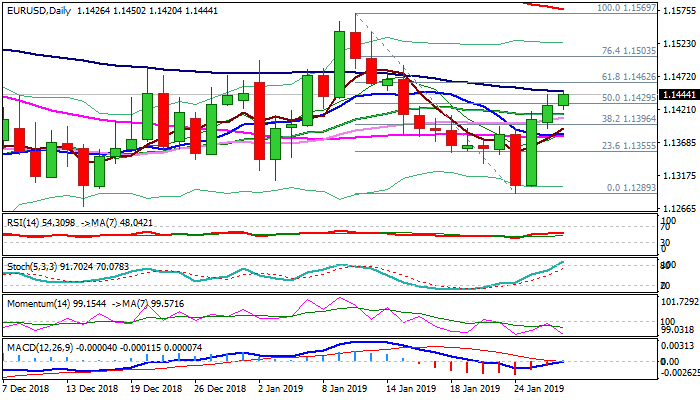
EUR/USD Outlook: Bulls Struggle At 100SMA, No Clear Direction Signal As Techs Are Mixed
The Euro holds in green for the third straight day and extended advance to new two-week high at 1.1450.
Bulls were capped by 100SMA so far and may struggle to break higher despite strong bullish signal generated on Monday's close above daily cloud top (1.1418), as technical studies on daily chart are mixed (bearish momentum is strengthening and slow stochastic is overbought) that produces negative signal, while MA's (10/20/30/55) are in bullish setup.
Repeated close above cloud top would give bulls additional boost, but cloud twists next week, requiring caution.
Return and close below within the cloud would generate negative signal and risk further weakness.
Bullish scenario requires close above 100SMA and violation of next pivotal barrier at 1.1462 (Fibo 61.8% of 1.1569/1.1289) to signal extension of bull-leg from 1.1289 (24 Jan low).
Res: 1.1450, 1.1462, 1.1489, 1.1503
Sup: 1.1429, 1.1418, 1.1396, 1.1377
EUR/USD Bullish Reversal After Bearish Pullback
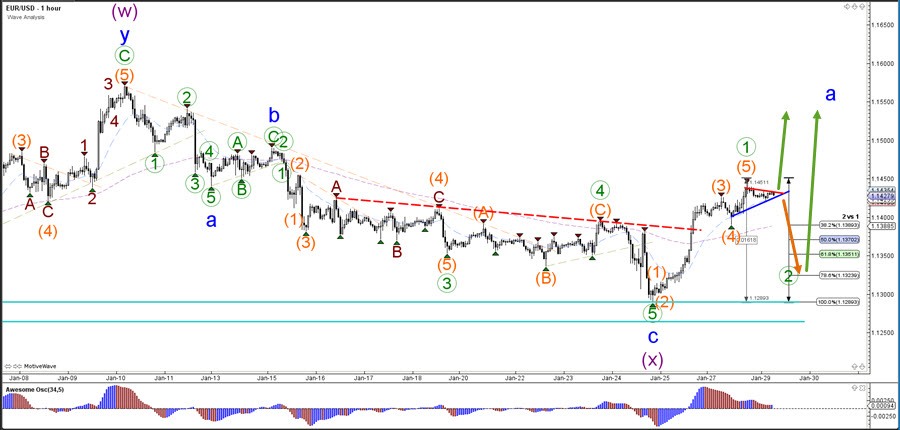
The EUR/USD could build an inverted head and shoulders reversal chart pattern, which are indicated by the purple boxes. A bullish continuation is expected towards the 23.6% Fibonacci retracement level of wave B vs A (light purple).
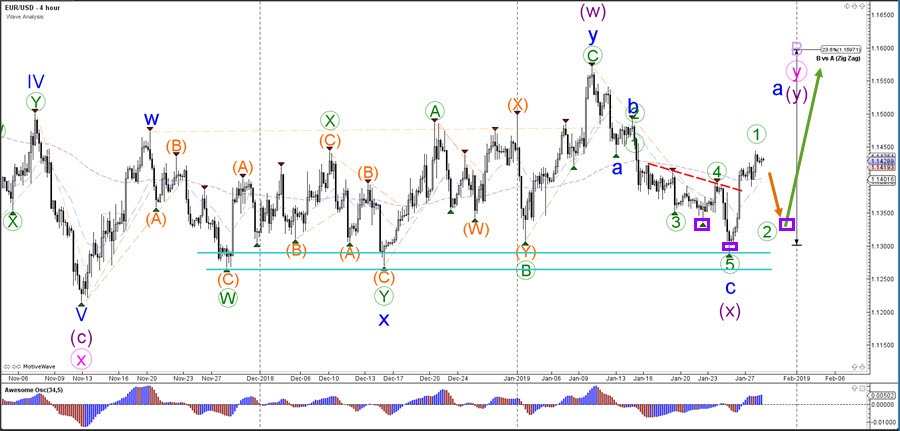
The EUR/USD is showing a small consolidation pattern. A bullish break could see price move up towards the 1.15 resistance trend line (red) whereas a bearish break below support (blue) will probably see price move lower and test the Fibonacci retracement levels of wave 2 vs 1 (green). These Fibonacci levels are expected to potential support levels and bullish bounce zones for a move higher. A break below the 100% Fib of wave 2 vs 1 invalidates the wave 1-2 pattern.
Markets Cautiously Started Very Eventful Week
A large number of important news reinforced the foreign exchange market volatility at the end of last week. The dollar index failed to continue to grow on Friday, losing more than a percent, rolling away from the January highs. Despite the calm nature of trading on Monday, the US currency continued its cautious retreat.
It is worth noting that all these movements occur within the established trade corridors. Market participants are hesitant to develop an offensive before a series of important news.
EURUSD pair is clamped in the range of 1.13-1.15, turning on Friday from the bottom border. The technical analysis supporters may note that the pair reversal on Friday is a “bullish takeover.” Such a model on the market is a sign of further growth of the currency pair.
However, it is worth being careful to follow this candlestick pattern. It works well in the news vacuum that we saw on Monday. However, later this week, the situation will most likely get hotter, and the EURUSD growth model will have to undergo several fundamental checks.
First of all, we are talking about the news about the trade negotiations between the United States and China. If there is no negative on this topic, the euro may lose ground.
The next round of tension can push the pair below established range, suggesting further problems for the global economy and a drop in demand for risky assets.
The Fed does not like to surprise the markets with unexpected turns of rhetoric at meetings, but traders should not lose sight of the high potential for increased volatility. The Fed's confidence in the economy may well send EURUSD to a sharp decline, as it will be a surprise for the markets. At the moment, bidders are determined that the Fed will not hurry with tightening policies and take a long pause in rate increases. The markets do not exclude that it may be delayed for the whole year.
It is necessary to fear that the markets want to see only what is profitable for them, and they risk meeting with a serious “disappointment”. It will be good for the markets and bad for the dollar. If the markets are right, the dollar will face hard times.
The United States will release the Payrolls on Friday. This indicator has the reputation of the strongest market mover, and this time it will be in the spotlight, as the markets are now on a dry ration, receiving very few statistics from the United States due to the shutdown. In this regard, the market reaction may be stronger than usual.
The Brexit Vote Is In The Focus Of Attention
The US dollar weakened slightly against a basket of major currencies during yesterday's trading session. The US dollar index (#DX) closed yesterday in the negative zone (-0.04%). Financial market participants took a wait-and-see attitude before the Fed interest rate decision. Also, investors will follow the trade relations between the US and China. Negotiations between countries should take place this week. However, the case of Huawei Technologies Co. may worsen the situation. Yesterday, the US judicial authorities accused Huawei of stealing intellectual property.
At the moment, investors' attention is focused on the UK Parliament vote on Brexit deal, which will be held today. The first version of the agreement proposed by Theresa May was criticized and rejected. The new draft contains 19 amendments, for which parliamentarians will vote.
The "black gold" prices are recovering after a decline the day before. At the moment, futures for the WTI crude oil are testing the mark of $52.10 per barrel. At 23:30 (GMT+2:00), the API weekly crude oil stock will be published.
Market Indicators
- Yesterday, the bearish sentiment was observed in the US stock market: #SPY (-0.76%), #DIA (-0.93%), #QQQ (-1.24%).
- The 10-year US government bonds yield fell slightly. At the moment, the indicator is at the level of 2.73-2.74%.
The News Feed on 29.01.2019:
- Consumer confidence index in the US at 17:00 (GMT+2:00);
- UK Parliament vote on Brexit deal at 21:00 (GMT+2:00).
GBP/USD Outlook: Increased Volatility Expected On Key Event Of The Day – Parliamentary Vote On Brexit Plan
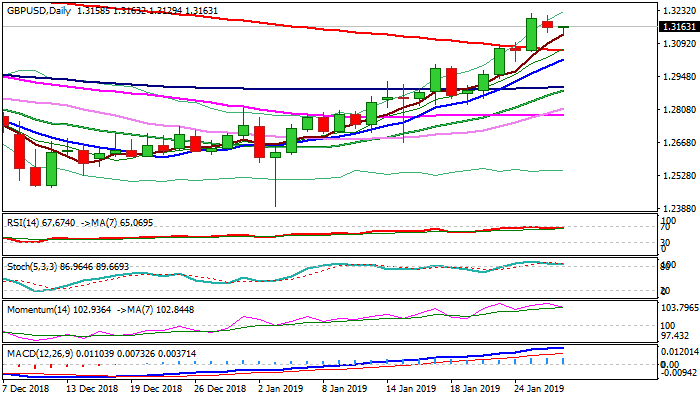
Cable holds in red in early Tuesday and extends weakness off new high at 1.3217 into second straight day.
Technical indicators started to point lower on daily chart, suggesting further corrective easing, but the action could be limited as indicators did not generate firmer negative signals and daily MA's are still in full bullish setup and supportive.
Ideally, corrective action should find ground above broken 200SMA (1.3062) to keep larger bulls intact for retest of new 14-week high and extension of bull-leg from 1.2476 towards targets at 1.3257 (12 Oct high) and 1.3297 (20 Sep high).
Conversely, break below 200SMA would risk test of other pivotal supports at 1.3023 (10SMA) and psychological 1.30 support, loss of which would generate stronger bearish signal.
Traders expect increased volatility as UK lawmakers vote today on Brexit amendments, in attempt to shape country's exit from the EU and give clearer signal what type of Brexit they will support.
Res: 1.3169, 1.3217, 1.3257, 1.3297
Sup: 1.3129, 1.3114, 1.3062, 1.3023
USD/JPY The Downside Prevails
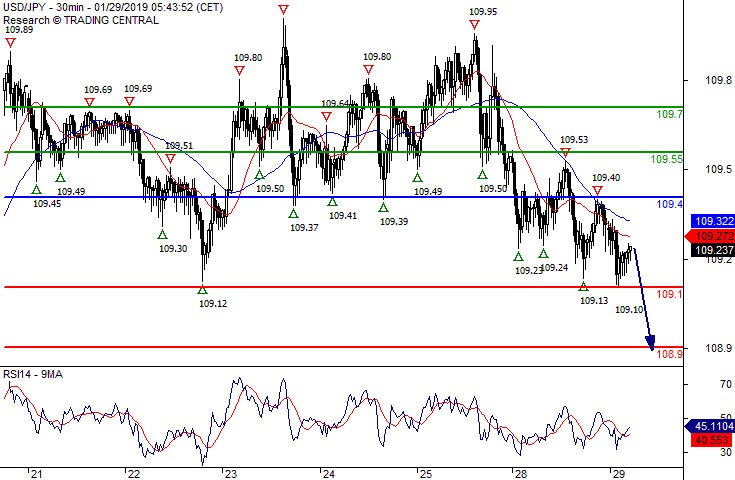
Pivot (invalidation): 109.40
Our preference Short positions below 109.40 with targets at 109.10 & 108.90 in extension.
Alternative scenario Above 109.40 look for further upside with 109.55 & 109.70 as targets.
Comment The RSI lacks upward momentum.
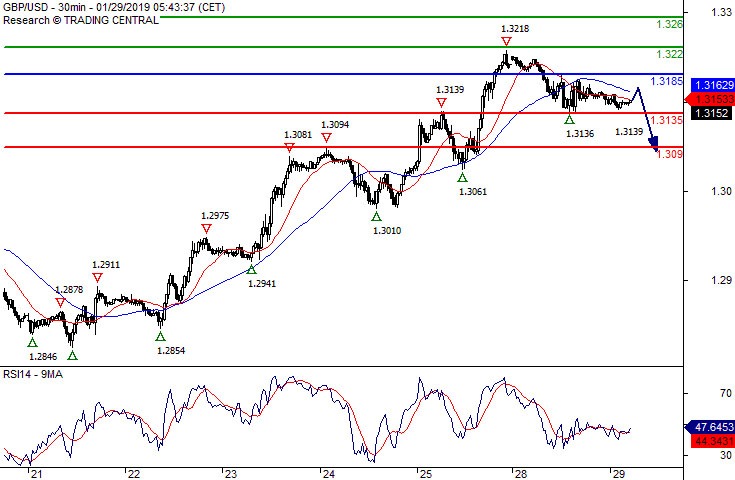
GBP/USD Aim @ 1.3090
Pivot (invalidation): 1.3185
Our preference Short positions below 1.3185 with targets at 1.3135 & 1.3090 in extension.
Alternative scenario Above 1.3185 look for further upside with 1.3220 & 1.3260 as targets.
Comment A break below 1.3135 would trigger a drop towards 1.3090.