Sample Category Title
USD/CAD Breakout Occurs
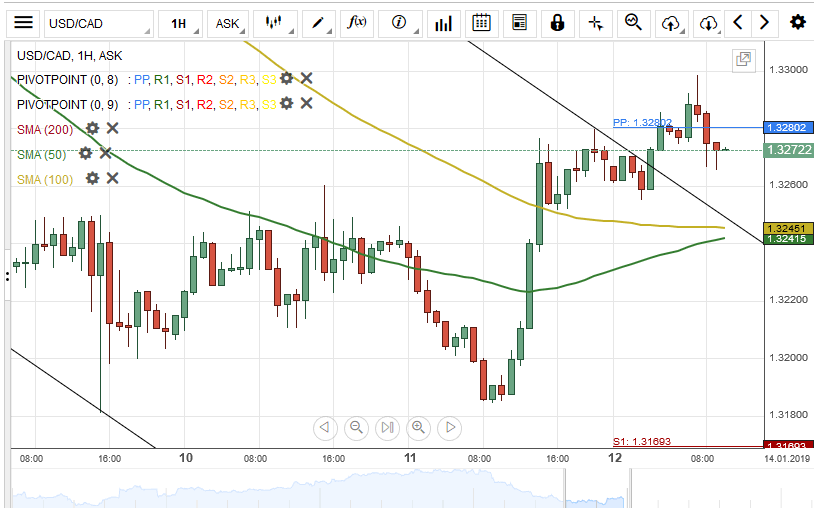
The US Dollar gained about 96 base points against the Canadian Dollar on Friday. The currency pair breached both the 50– and 100-hour simple moving averages during Friday's trading session.
A breakout through the upper boundary of a descending channel pattern occurred during the first part of today's session.
Given that a breakout had occurred, it is likely that the currency exchange rate aims for the 200-hour SMA at 1.3362 during the following trading session.
However, a resistance level formed by the monthly pivot point at 1.3313 could hinder such bullish movement.
NZD/USD Testing Support Cluster At 0.6795
The New Zealand Dollar gained over 50 base points against the US Dollar on Friday.
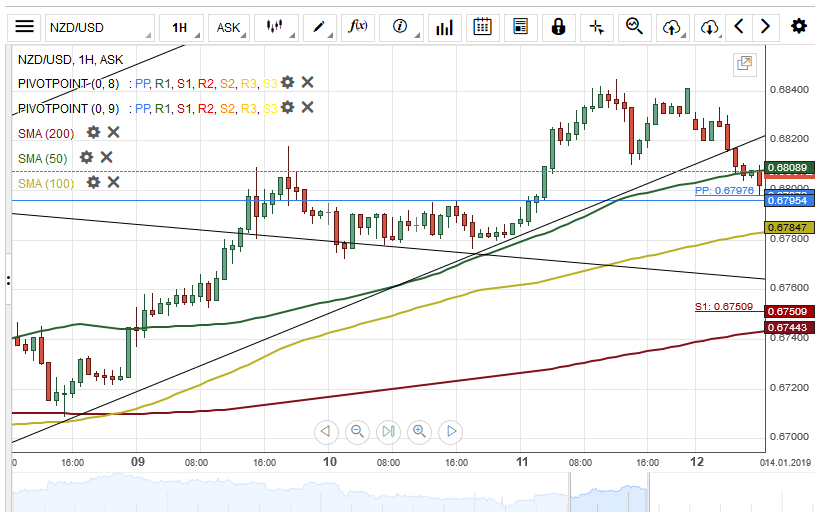
However, today's session began with a bearish momentum, and by the middle of the European trading session, the currency pair has breached both the lower boundary of an ascending channel and the 50-hour SMA at 0.6807.
If a support cluster formed by the combination of the weekly and the monthly PPs at 0.6795 holds, the currency exchange rate could continue its upside movement today.
On the other hand, if the rate passes the cluster, the next target will be near the 100-hour SMA at 0.6783.
FTSE Index: Ahead Of Brexit Vote, Levels To Watch
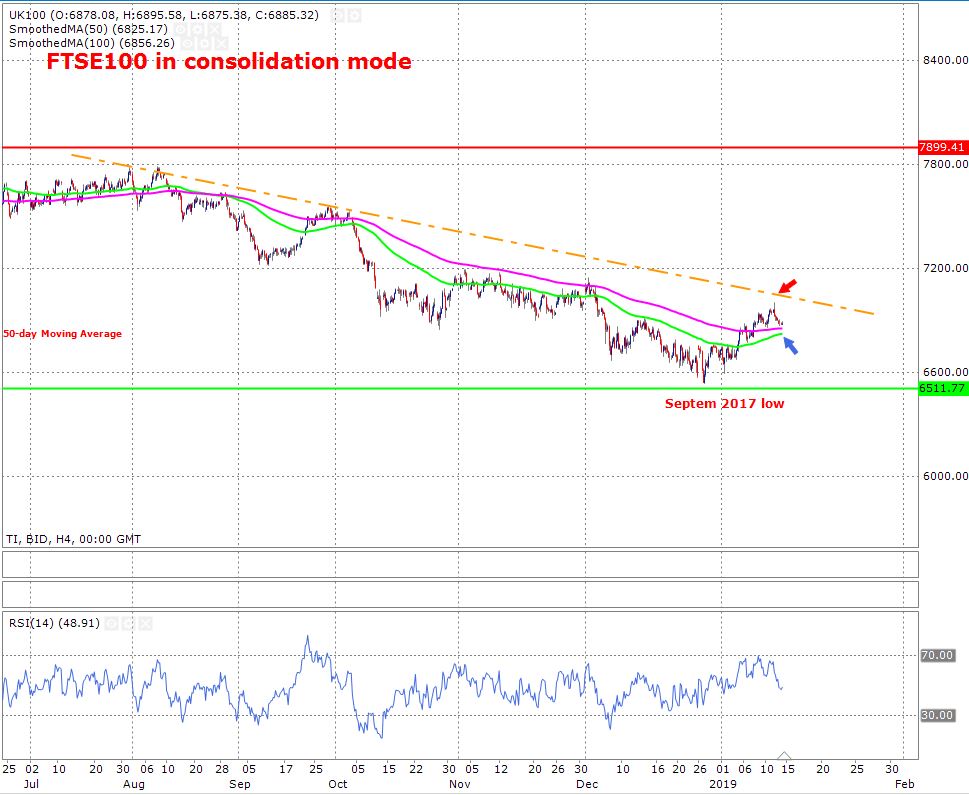
The FTSE 100 index is trading in a downtrend on a 4-hour time frame. This confirmed from the fact that the price is trading below the downward trend line shown in orange colour. The index did try to challenge this trend line but it failed to achieve its task. As long as we stay below this trend line, the trend line will remain intact. Having said this, it is important to keep in mind that the price is trading above the 50 and 100-day moving averages and these are shown in green and pink colour respectively. It is likely that the price may find some support near these moving averages however a break of these moving averages will send a strong bearish.
The RSI has eased off from its overbought zone and it is on its way to touch the oversold zone. There is no divergence between the price and the RSI and this confirms that the current trend has momentum behind it.
The support zone is shown by the green horizontal solid line.
The resistance zone is shown by the red horizontal solid line.
EUR/USD Is Supported By 200-Hour SMA
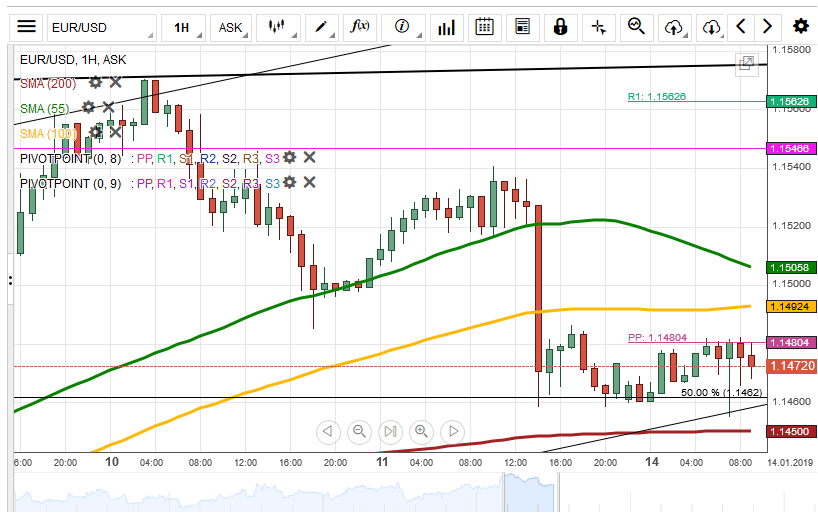
During the previous trading session, the European Single Currency was depreciated against the US Dollar to the 1,1462 mark. On Monday morning, the currency exchange rate was supported by the 200-hour simple moving average to trade slightly below the weekly PP at 1.1479.
Most likely, the 200-hour SMA and the 50.00% Fibo will support the European Single Currency to appreciate against the US Dollar during the day. It is expected that the rate will break the weekly pivot point to pass the 1.1500 level.
On the other hand, the rate could trade sideways at the 1.1460 level due to a lack of any significant fundamental news which could affect the rate during the session.
GBP/USD Outlook: Bulls Face Strong Headwinds From Falling Daily Cloud, All Eyes On Parliamentary Vote On Brexit Plan
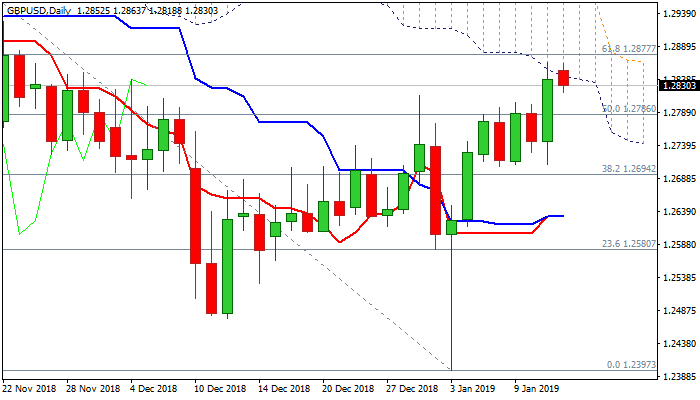
Cable holds in red in early European trading on Monday, as repeated attempts to penetrate daily cloud failed.
Daily cloud is falling and thickening and provides significant resistance, in addition to negative signal from bearish divergence on daily slow stochastic and indicator’s reversal from overbought territory.
Deeper pullback could be expected if the price dips below 55SMA (1.2774) but near-term structure is still bullish and the action under daily cloud could be of corrective nature while the price holds above pivotal supports provided by 10&20SMA’s (1.2738 & 1.2684 respectively).
All eyes turn towards Tuesday’s parliamentary vote on Brexit plan, with wide expectations that the plan will be rejected, but signals that Brexit 29 March deadline would be extended by the EU until at least July, would be supportive factor for the pound.
Res: 1.2843, 1.2877, 1.2927, 1.2958
Sup: 1.2774, 1.2738, 1.2684, 1.2631
GBP/USD Retraced By 62.20% Fibo
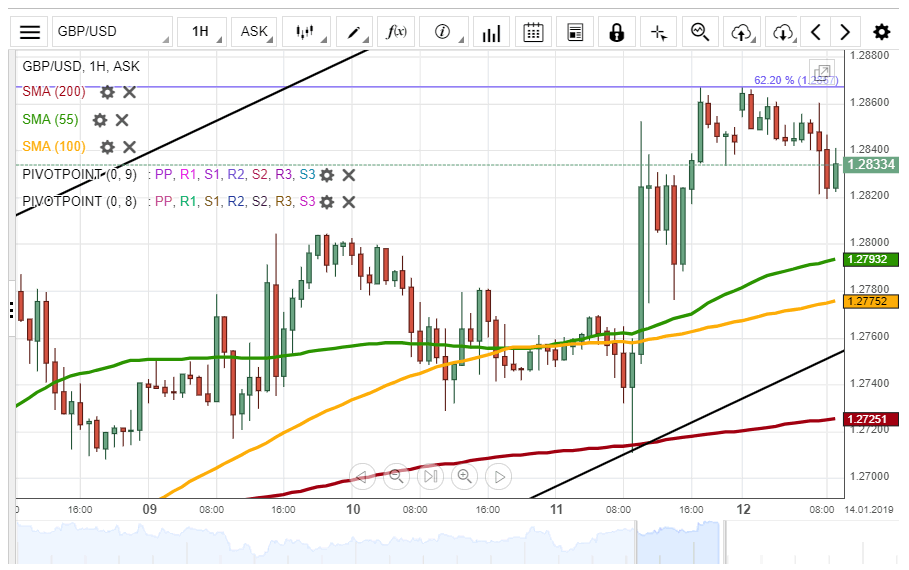
During Monday morning hours, the 62.20% Fibonacci retracement level at 1.2867 retraced the rate to the 1.2835 mark.
In regards to the near-term future, most likely, that the British Pound will get appreciated against the US Dollar to break the resistance level of the 62.20% Fibo to trade at the 1.2900 level. Moreover, the 55-hour and the 100-hour SMAs will support the rate during the trading session.
However, the GBP/USD could keep trading sideways between the 62.20% Fibo and the weekly PP due to a lack of any significant fundamental news which could affect the rate during the day!
USD/JPY Depreciates To 108.00 Level
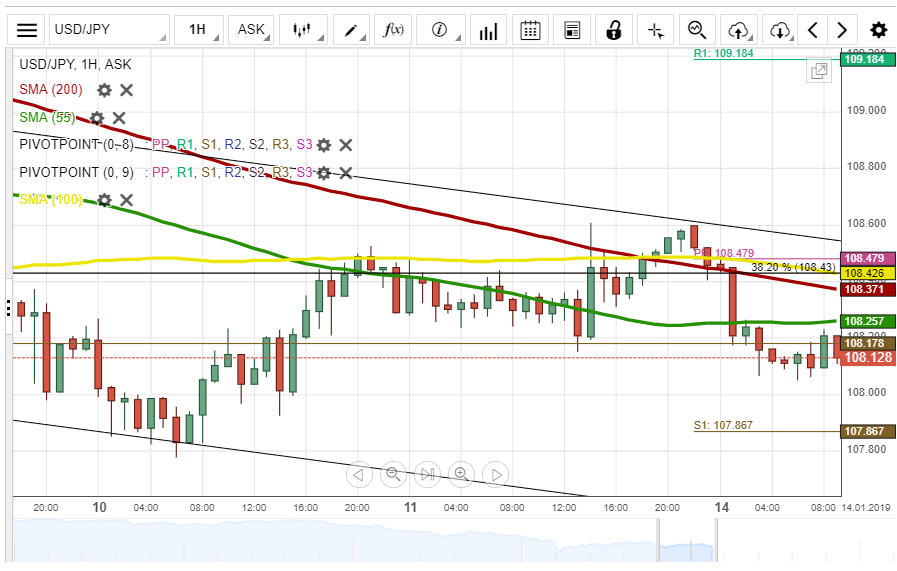
During Monday morning hours, the currency exchange rate was resisted by the 200-hour simple moving average to stay at the 108.15 mark.
In regards to the near-term future, most likely, the rate will be trading sideways between the monthly S1 at 108.17 and the weekly S1 at 107.86.
The resistance levels of the monthly S1 and the 55-hour simple moving average will not let the US Dollar to appreciate against the Japanese Yen during the trading session on Monday.
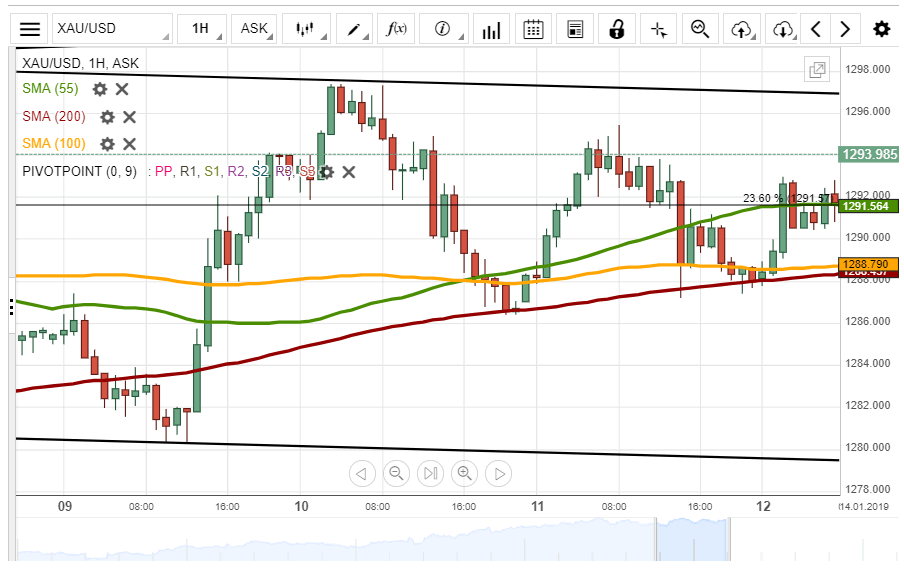
XAU/USD Passes 23.60% Fibo
During Monday morning hours, the yellow metal broke through the resistance levels of the 55-hour simple moving average and the 23.60% Fibo to trade at 1,293.44.
Most likely, the gold will keep surging towards the upper boundary of the descending pattern line at 1,297.00. Besides, the 23.60% Fibo and the 55-hour SMA will try to support the yellow metal during the trading session.
Moreover, the yellow metal could be sure that it will not depreciate against the US Dollar due to a lack of any significant fundamental news which could affect the rate during the day!
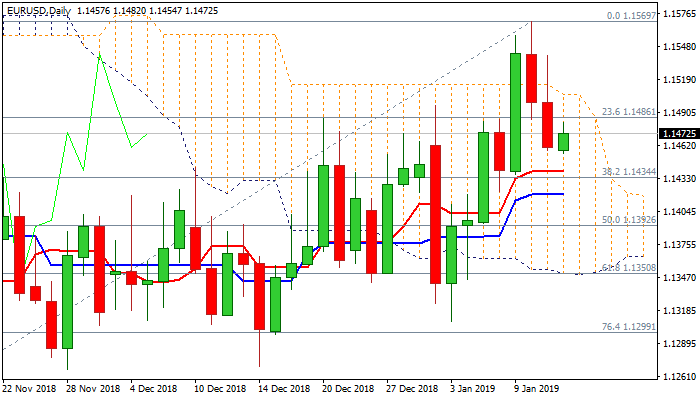
EUR/USD Outlook: Strong Support At 1.1444 Under Pressure After Strong Upside Rejection And Subsequent Pullback
The Euro edges higher in early trading on Monday, but near-term outlook remains negative following strong losses in past two days that left bearish candles with long upper shadows.
Also, failure to clearly break above daily cloud (top of cloud will fall significantly this week) adds to weaker tone.
Monday's action was so far capped by 100SMA (1.1476), which now acts as resistance, following Friday's break and close below, but is underpinned by strong support at 1.1444 (broken 38.2% of 1.1815/1.1215 fall, reinforced by 10SMA).
Hopes of fresh upside would remain in play while the latter holds, with the notion supported by strengthening momentum on daily chart. Break above 100SMA and daily cloud top (1.1506) is needed to confirm scenario and shift near-term focus higher.
On the other side, near-term structure would weaken further on sustained break below 10SMA, that would open strong supports provided by a cluster of daily MA's (20/30/55) at 1.1414/1.1379 zone) and unmask key supports at 1.1350 (daily cloud base / Fibo 61.8% of 1.1215/1.1569 bull-leg).
Res: 1.1476, 1.1506, 1.1540, 1.1569
Sup: 1.1444, 1.1414, 1.1379, 1.1350
Forex Technical Analysis: EUR/USD, USD/JPY, GBP/USD
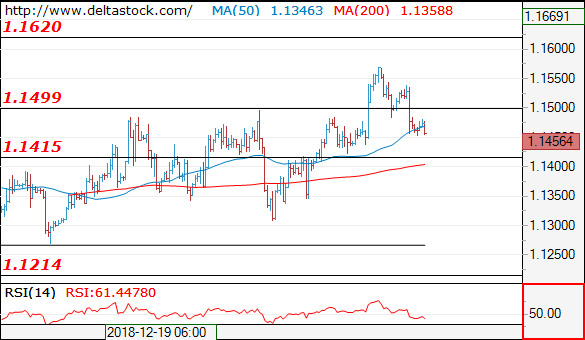
EUR/USD
Current level - 1.1456
The violation of 1.1500 support signals a negative bias, for a test of 1.1410 area. A break through the latter will target 1.1260 zone. Initial intraday resistance lies at 1.1500 and crucial on the upside is 1.1540.
| Resistance | Support | ||
| intraday | intraweek | intraday | intraweek |
| 1.1500 | 1.1630 | 1.1410 | 1.1214 |
| 1.1630 | 1.1820 | 1.1260 | 1.1100 |
USD/JPY
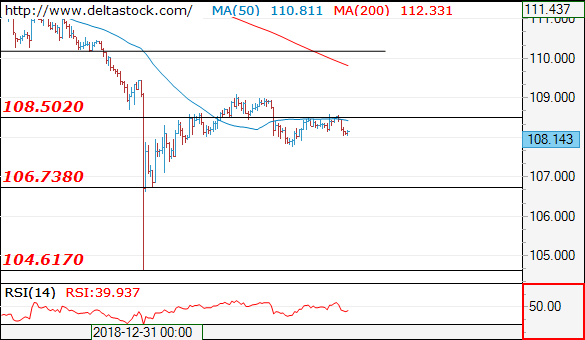
Current level - 108.14
The outlook is bearish after the recent pullback at 108.50 resistance, for a downswing towards 106.70.
| Resistance | Support | ||
| intraday | intraweek | intraday | intraweek |
| 108.50 | 111.45 | 106.70 | 106.70 |
| 109.10 | 112.20 | 106.70 | 104.60 |
GBP/USD
Current level - 1.2825
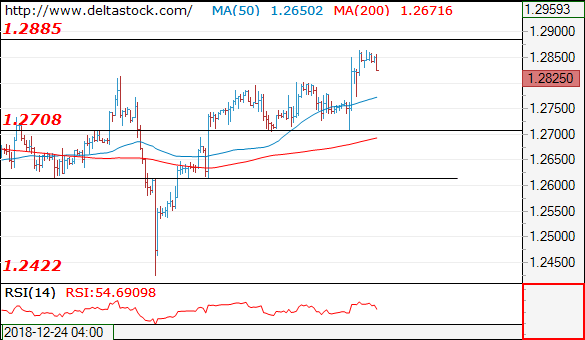
The last attempt at 1.2710 failed as well and the pair broke through the upper boundary at 1.2800, currently targeting 1.28850 resistance area. Intraday support lies at 1.2770 and crucial on the downside is 1.2710.
| Resistance | Support | ||
| intraday | intraweek | intraday | intraweek |
| 1.2885 | 1.2885 | 1.2710 | 1.2420 |
| 1.2885 | 1.3250 | 1.2615 | 1.2340 |