Sample Category Title
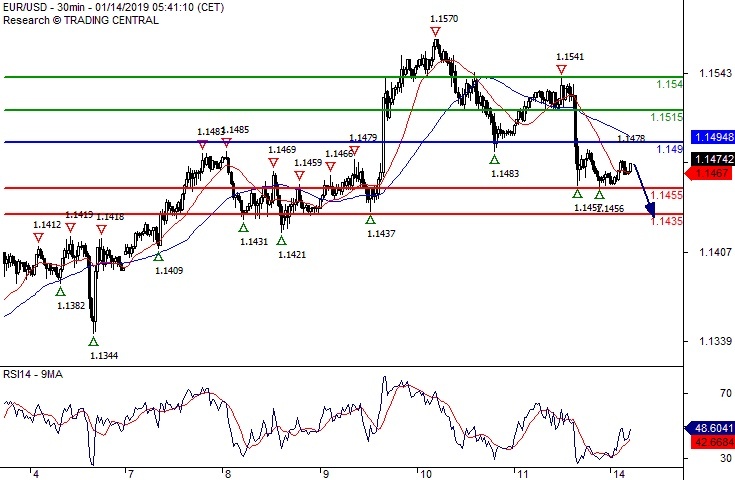
EUR/USD Under Pressure
Pivot (invalidation): 1.1490
Our preference Short positions below 1.1490 with targets at 1.1455 & 1.1435 in extension.
Alternative scenario Above 1.1490 look for further upside with 1.1515 & 1.1540 as targets.
Comment As Long as the resistance at 1.1490 is not surpassed, the risk of the break below 1.1455 remains high.
GBP/USD Daily Outlook
Daily Pivots: (S1) 1.2743; (P) 1.2805; (R1) 1.2900; More....
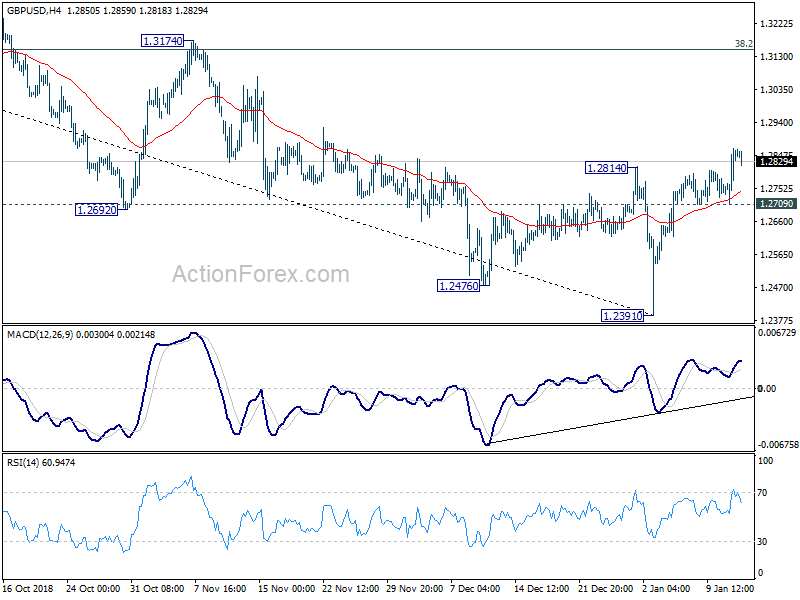
Intraday bias in GBP/USD remains on the upside at this point. Current rebound from 1.2391 is seen as corrective whole down trend from 1.4376. Further rally would be seen to 1.3174 resistance, which is close to 38.2% retracement of 1.4376 to 1.2391 at 1.3149. We'd expect strong resistance from there to limit upside, at least on first attempt. On the downside, break of 1.2709 minor support will argue that such rebound is completed and turn bias back to the downside for retesting 1.2391 low.
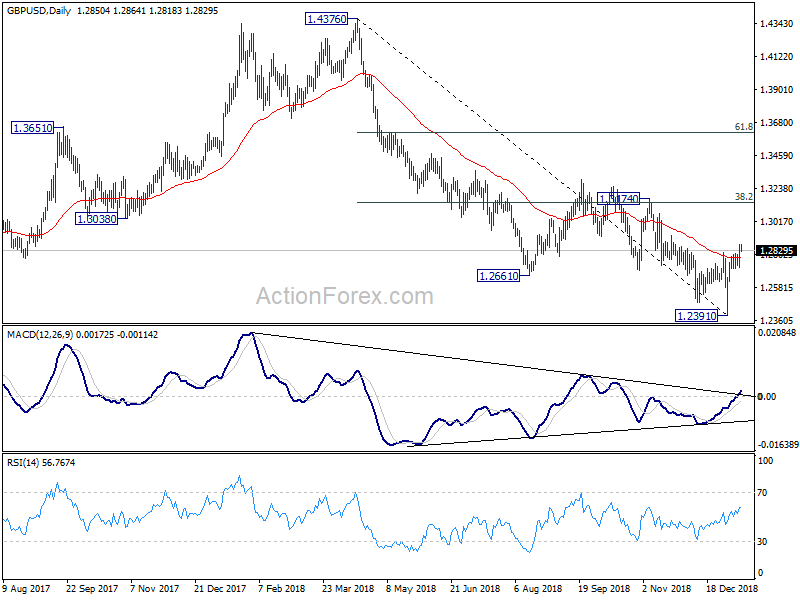
In the bigger picture, whole medium term rebound from 1.1946 (2016 low) should have completed at 1.4376 already, after rejection from 55 month EMA. The structure and momentum of the fall from 1.4376 argues that it's resuming long term down trend from 2.1161 (2007 high). And this will now remain the preferred case as long as 1.3174 structural resistance holds. GBP/USD should target a test on 1.1946 first. Decisive break there will confirm our bearish view. However, sustained break of 1.3174 will invalidate this case and turn outlook bullish.
USD/CHF Daily Outlook
Daily Pivots: (S1) 0.9817; (P) 0.9837; (R1) 0.9860; More....
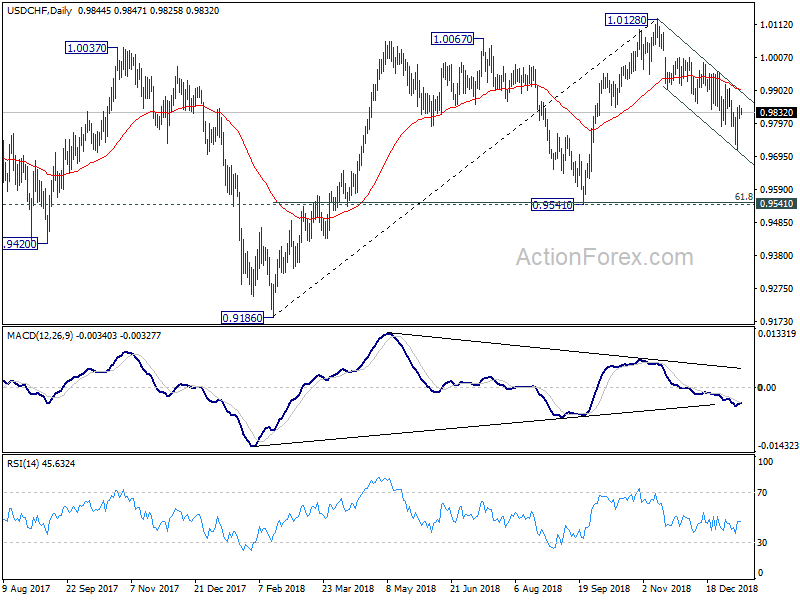
USD/CHF's choppy fall from 1.0128 extended to as low as 0.9716 last week before forming a temporary low and recovered. Initial bias remains neutral this week for some consolidations first. The deeper then expected decline argues that it's correcting whole rise from 0.9186. On the downside, break of 0.9716 will target 0.9541 cluster support (61.8% retracement of 0.9186 to 1.0128 at 0.9546).
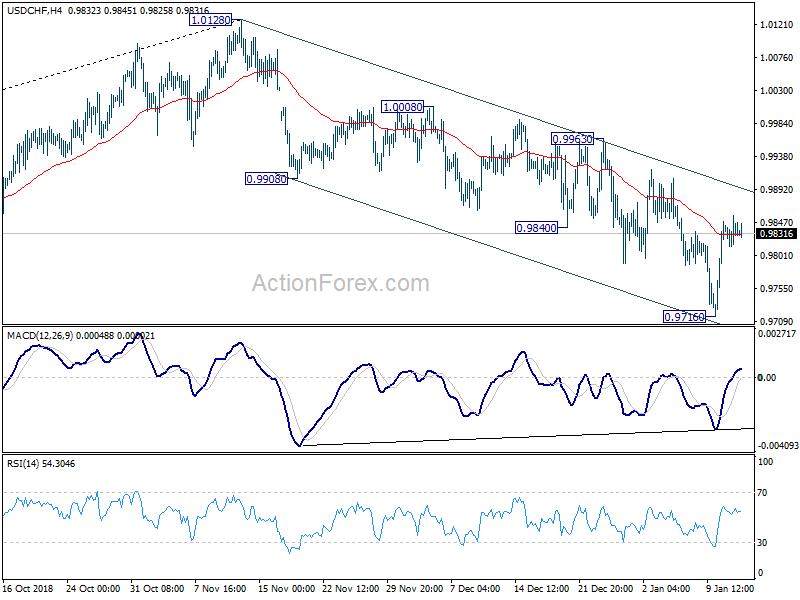
In the bigger picture, current development suggests that rise from 0.9186 has possibly completed with three waves up to 1.0128 already. Decline from 1.0128 could either be correcting this move, or reversing the trend. As long as 0.9541 support holds, we'd slightly favor the former scenario, and expect another rise through 1.0128 at a later stage. However, sustained break of 0.9541 will confirm trend reversal and bring deeper fall back to 0.9186 low.
USD/JPY Daily Outlook
Daily Pivots: (S1) 108.27; (P) 108.44; (R1) 108.73; More..
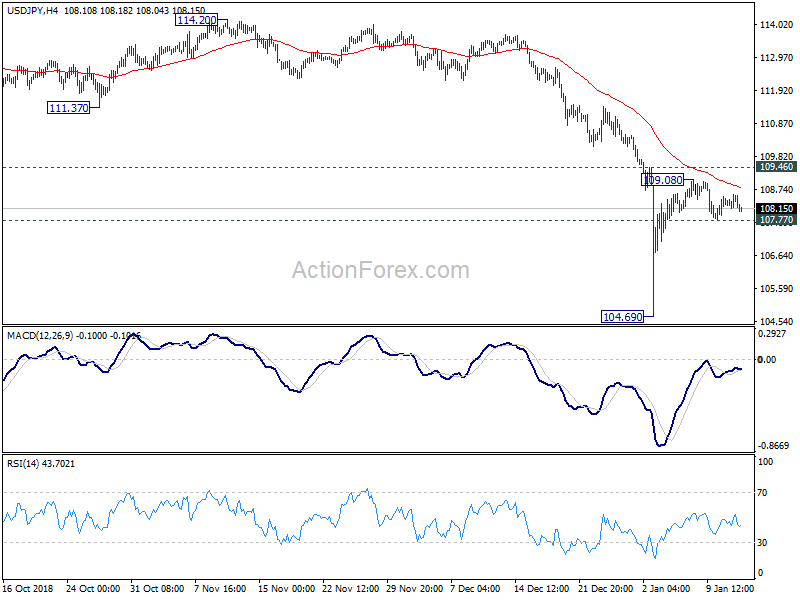
Intraday bias in USD/JPY remains neutral at this point. Outlook is unchanged as we'd expect upside to be limited by 109.46 resistance to complete the rebound from 104.69 short term bottom. On the downside, below 107.77 will turn bias to the downside for retesting 104.69 low. Overall, larger downtrend from 118.65 (2016 high) is expected to resume finally through 104.62 after current consolidation from 104.69 completes.
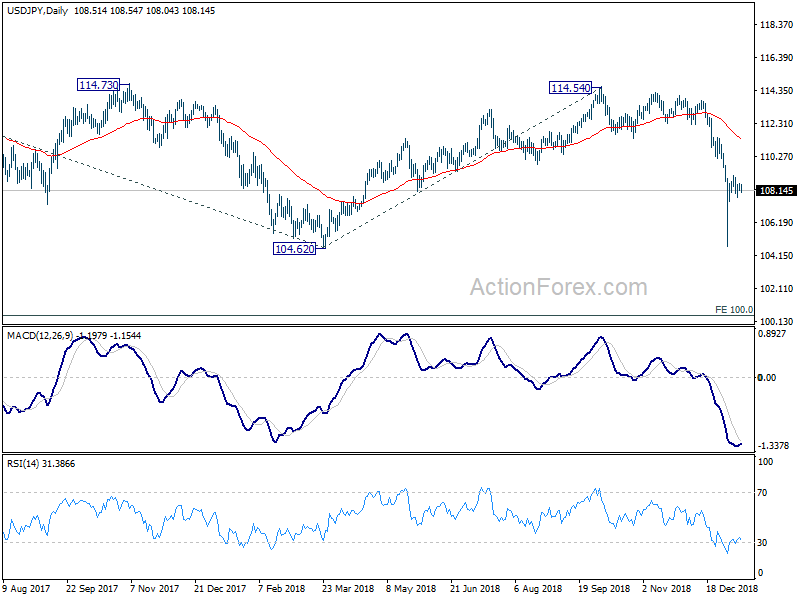
In the bigger picture, price actions from 125.85 (2015 high) are seen as a long term corrective pattern, no change in this view. Apparently, such corrective pattern is not completed yet. Fall from 114.54 is seen as part of the falling leg from 118.65 (2016 high). Break of 104.62 will target 100% projection of 118.65 to 104.62 from 114.54 at 100.51, which is close to 100 psychological level. But in that case, we'd expect strong support from 98.97 to contain downside to bring reversal. Also, this bearish case will remain the preferred one as long as 114.54 resistance holds.
GBP/JPY Daily Outlook
Daily Pivots: (S1) 138.21; (P) 138.85; (R1) 140.03; More...
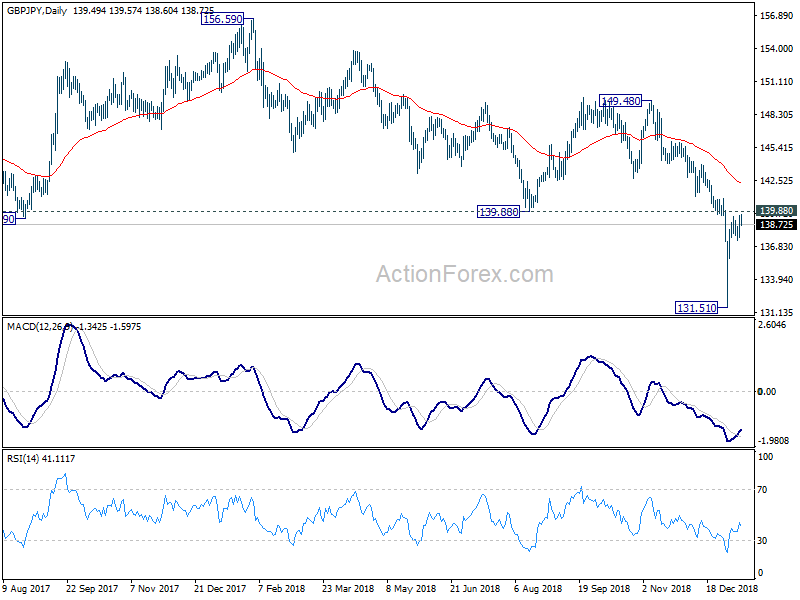
GBP/JPY dips mildly today but stays above 137.35 minor support. Intraday bias remains neutral for the moment. We'd continue to expect strong resistance from 139.88 to limit upside to complete the rebound from 131.51 short term bottom. On the downside, break of 137.35 minor will turn bias to the downside for retesting 131.51 low. However, firm break of 139.88 will extend the rebound to 143.93 resistance next.
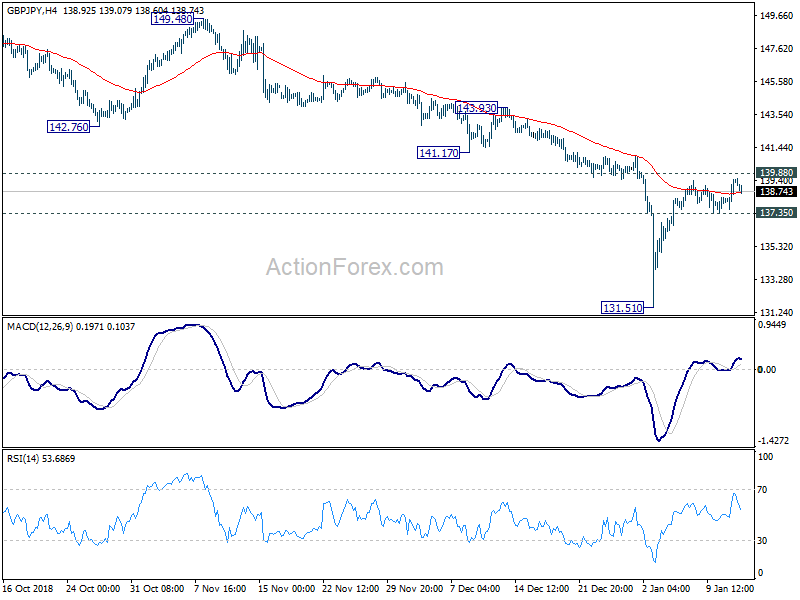
In the bigger picture, corrective medium term rise from 122.36 (2016 low) has completed at 156.69 already. That came after failing to break through 55 month EMA. Fall from 156.59 (2018 high) is seen as resuming the long term down trend from 195.86 (2015 high). Below 131.51 will target 122.36 low first. And this will now remain the preferred case as long as 139.88 support turned resistance holds. Sustained break of 139.88 will mix up the outlook and we'll reassess on the final structure of the rebound from 131.51.
A Dovish Fed May Not Be Enough To Boost Confidence After All
The first full trading week of 2019 may be characterized by improved investor sentiment, return of risk, and much less volatility in equity markets. Thanks to the U.S. FOMC minutes and Fed talk that has shown a willingness to delay further tightening of monetary policy in an obvious sign that policymakers are listening to the markets. This factor coupled with a return of U.S.–China trade negotiations provided a boost to global and U.S. equities. The S&P 500, Dow Jones Industrial Average, and NASDAQ Composite posted solid gains last week of 2.5%, 2.4% and 3.5% consecutively.
The Fed’s shift to a relatively dovish tone is undoubtedly good news to risk sentiment but not enough to keep bulls in control. Many catalysts may support or end last week’s market recovery including earnings announcements, macro data, the U.S. government shutdown, and Brexit vote.
Data released earlier this morning from China was not encouraging. The world’s second largest economy reported the biggest monthly fall in exports in two years, confirming beliefs that the global economy is heading into a slowdown. Increased tariffs by the U.S. are to be blamed, but only partially because Chinese exports to the rest of the world also declined. As a result to the surprisingly negative figures, Asian equities fell and futures pointed to a lower open for Europe and the U.S., while high beta currencies like the Australian and New Zealand Dollar experienced the biggest falls amongst major currencies.
Investor appetite to equities will be heavily tested this week as Corporate America begins to announce earnings results for Q4. Citi Group is the first major U.S. bank to report results today. JP Morgan and Wells Fargo will follow on Tuesday. Goldman Sachs and Bank of America will be announced on Wednesday, while Thursday will be Morgan Stanley along with Netflix. Investors need to keep an eye on loan growth figures as they reflect confidence in the overall economy, any increase in provisions, M&A activity, and how the shutdown may impact the real economy in the eyes of the banks.
The Brexit vote is likely to capture most of the headlines this week. Tomorrow the House of Commons is set to vote on UK Prime Minister Theresa May’s Brexit deal. It is expected that the bill will be voted down, but this won’t be the most significant factor influencing the Pound’s direction,it’s what will happen next. Are we going to see a no-confidence vote in the government? Or another attempt by Theresa May to secure concessions from the EU? Will there be an Extension of Article 50? Or even extreme scenarios such as a new general election and a second referendum? Each of these scenarios will have a different impact on the Pound. As of now,investors seem to be on wait-and-see mode as Sterling is holding against the Dollar near 1.2850.
EURUSD Underperforms Above Downtrend Line In Short Term
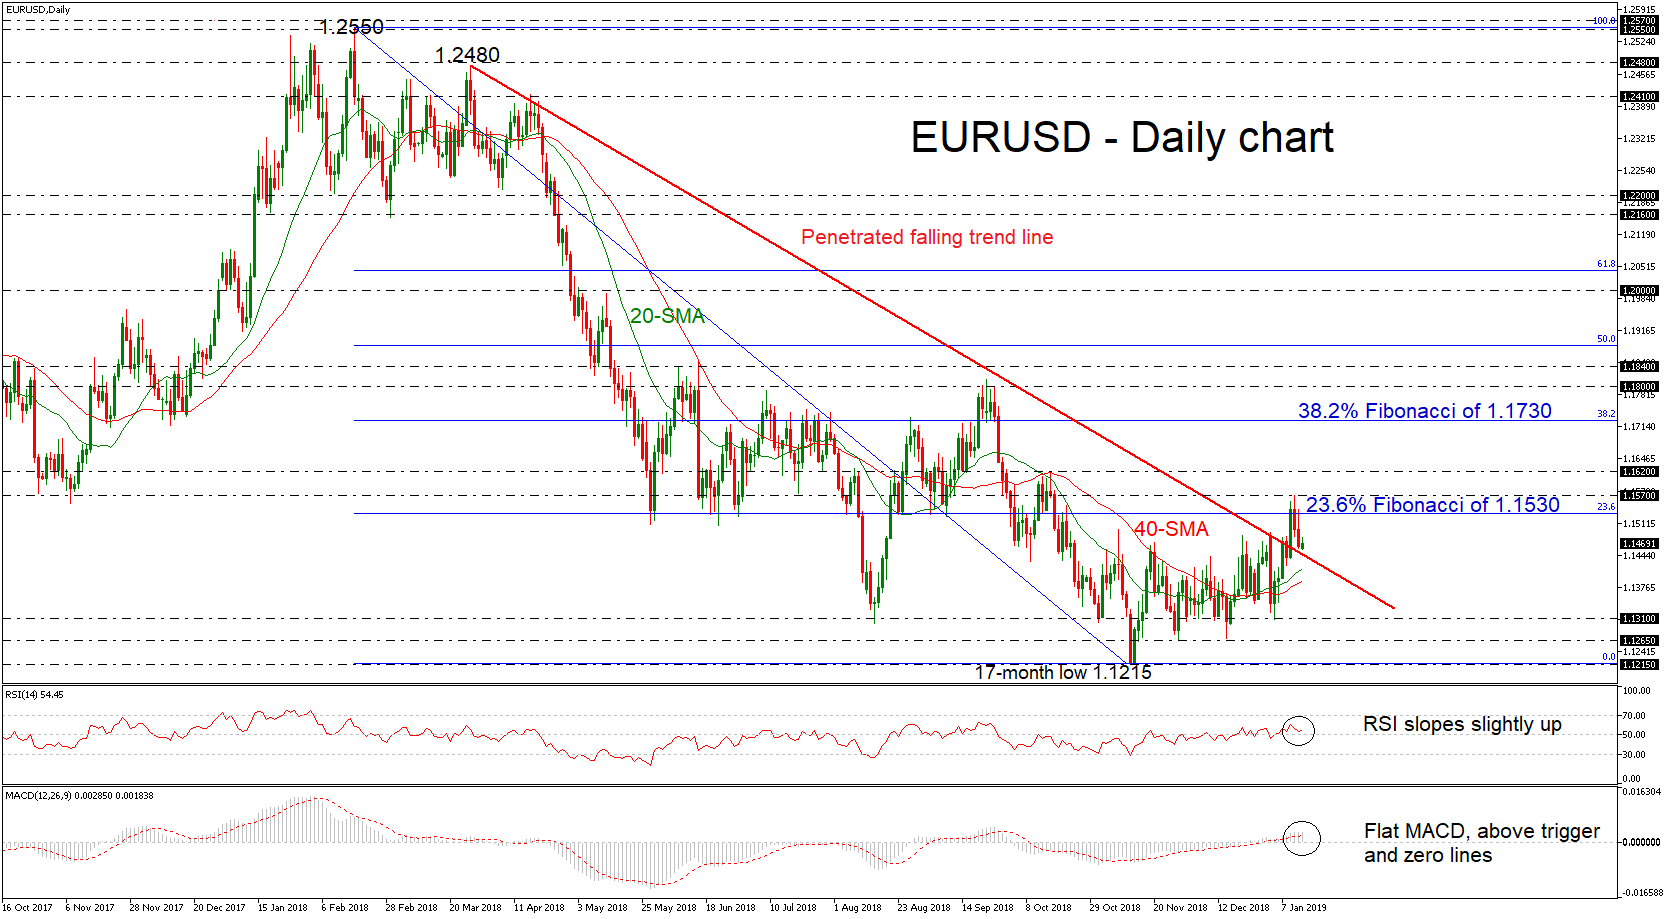
EURUSD lost momentum over the previous couple of sessions finding strong resistance on the 1.1570 hurdle. Despite the upside penetration of the long-term descending trend line the price failed to extend gains well above this level.
In the daily timeframe, the RSI indicator rebounded on the neutral threshold of 50 and is sloping marginally higher, while the MACD oscillator is flattening above the trigger and zero lines. It is worth mentioning that momentum is too weak to provide a sustained move higher.
If the price action remains above the diagonal line, there is scope to test again the 23.6 % Fibonacci retracement level of the downleg from 1.2550 to 1.1215, around 1.1530. This is considered to be a significant resistance area which has been rejected a few times in the past. Rising above it would see prices re-testing the 1.1570 barrier and then the 1.1620 obstacle.
On the other side, in case of further downside pressure, then the focus would turn to the 20- and 40-simple moving averages (SMAs) at 1.1415 and 1.1390 respectively. A drop below these levels would extend losses towards the 1.1310 support and then until 1.1265, identified by the troughs on November 28 and December 14.
Overall, looking at the medium-term, there are significant obstacles before posting a sharp bullish rally, driving the price back down again.
BTCUSD Under Pressure Below $3,660
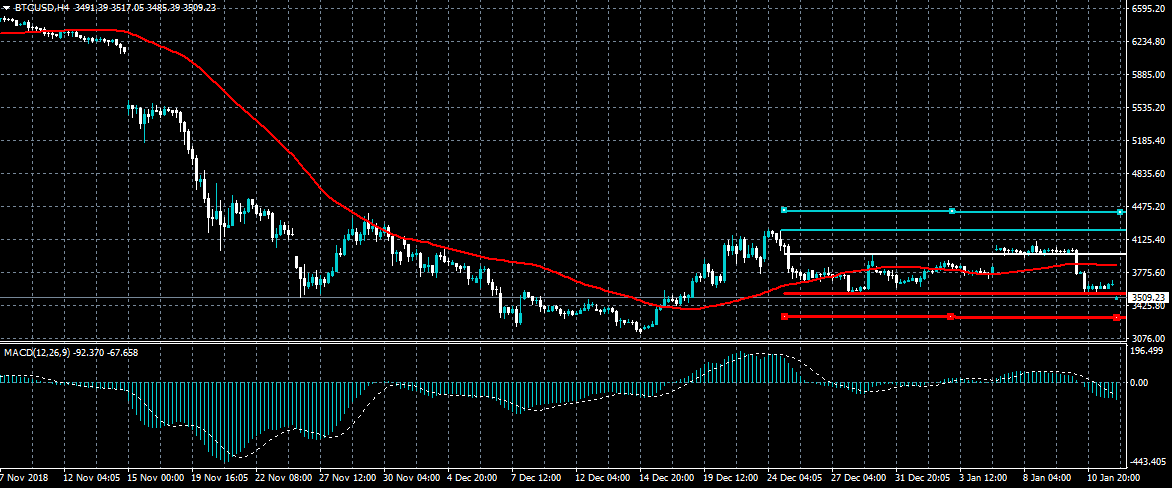
Bitcoin has started the new trading week under downside pressure, with the BTCUSD pair now trading below the important $3,660 technical level. The BTCUSD pair risks additional losses towards the $3,300 level while buyers are unable to hold price above the $3,660. It is also worth noting that despite sellers taking control of price-action BTCUSD trading volumes are declining.
The BTCUSD pair is bearish while trading below the $3,660 level, key technical support is found at the $3,300 and $3,100 levels.
If the BTCUSD pair trades above the $3,660 level, buyers may test towards the $3,850 and $3,960 resistance levels.
EURUSD 1.1460 Now Key Support
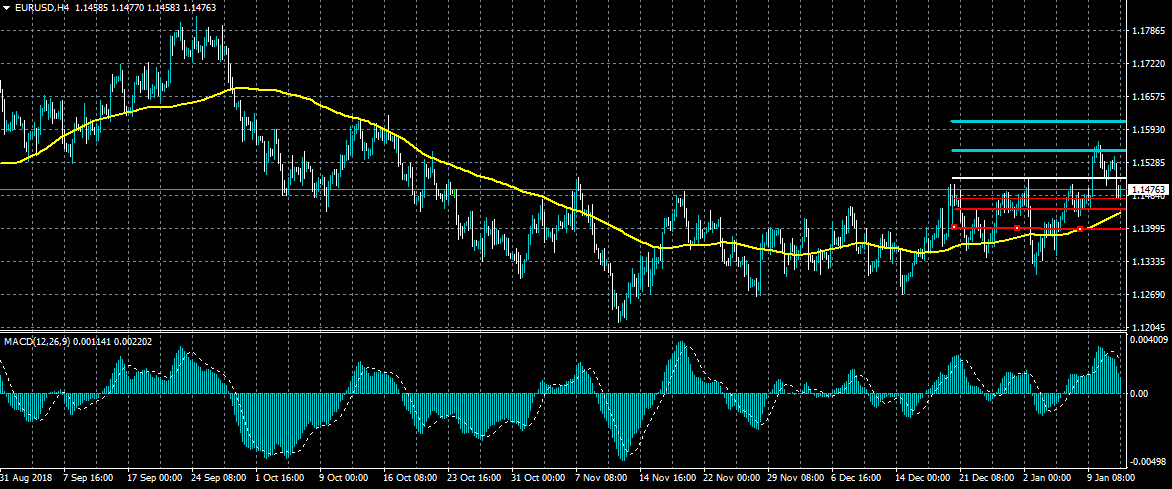
The euro currency continues to trade on the back foot against the US dollar, following Friday’s sharp technical reversal below the pivotal 1.1490 level. The 1.1460 level is the major support area to watch today, with a move below this level likely to trigger further losses towards at least the 1.1430 level. It is also worth noting that the EURUSD pair performed a bearish weekly price close below its 100-day moving average last week.
The EURUSD pair is strongly bearish while trading below the 1.1460 level, key technical support is found at the 1.1430 and 1.1400 levels.
If the EURUSD pair moves above the 1.1490 level, buyers may test towards the 1.1530 and 1.1550 resistance levels.
GBPUSD Intraday Bullish Above 1.2810
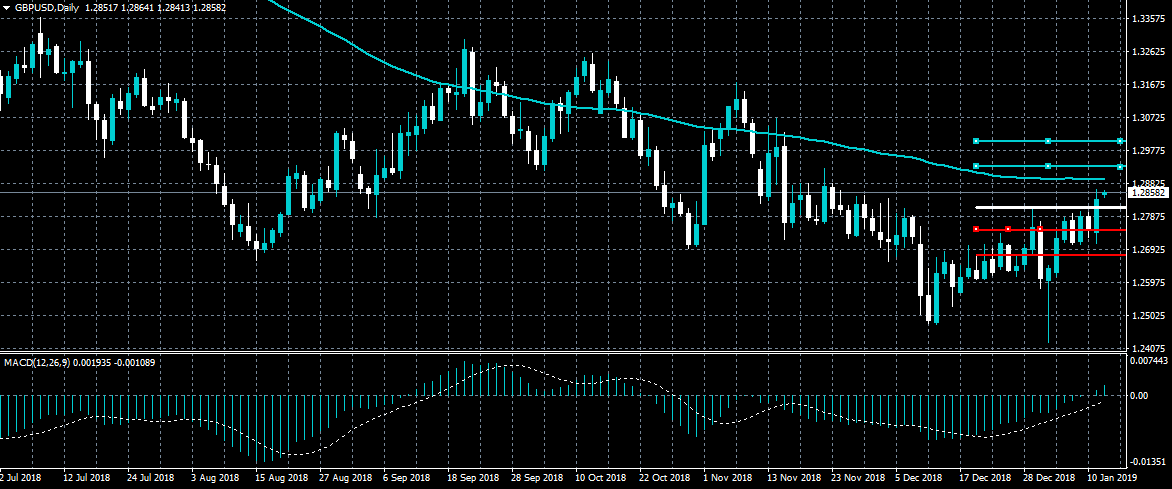
The British pound is trading to the upside against the US dollar in early Monday trade, following reports that the United Kingdom’s departure from the European Union on March 29th could be delayed until July this year. The GBPUSD pair is intraday bullish while trading above the 1.2810 level and the MACD indicator on the daily time frame is also currently bullish. The pairs one-hundred day moving average, at 1.2895, and the 1.3000 level are the major resistance levels to watch.
The GBPUSD pair is intraday bullish while trading above the 1.2810 level, key technical resistance is found at the 1.2895 and 1.3000 levels.
If the GBPUSD pair trades below the 1.2810 level, sellers may test towards the 1.2760 and 1.2685 support levels.