Sample Category Title
Have We Reached Peak Short Term Market Optimism
Markets
With the numerous crosscurrents still in play, US shutdown and Brexit notwithstanding, A mild bout of risk aversion seeped into global markets Friday pressuring US equities, oil prices and US bond yields lower, and we saw mostly US dollar buying as traders pared back extended short dollar positioning on the EUR and CNH.
There was no specific catalyst for aversion to set in except general concerns over Brexit, the US Government Shutdown but there was more balanced debate over the US dollars near term direction which led to a fidgety flip flop Friday of sorts as currency trades are getting crowded quickly in early 2019. ( more on this below in my currency note)
Although it didn’t move the US rates needle, US CPI data did carry some weight given that many Fed officials were suggesting the absence of inflation was a big concern. However, the CPI print was decent with both headline and core figures printing very much in line.
Brexit uncertainty continues, and the clock is ticking with PM May running out of time to get concessions on the unsettling nature of the backstop. This week could hopefully bring us some “meaningful” answers, from a meaningful vote in the UK parliament as we reach the next critical hurdle for Brexit. Currently, a yea vote looks very unlikely in the first attempt, but it may not be all doom and gloom as there is still time for the EU to provide a last-minute pledge.
As for the government shutdown, we could say the writing is on the wall, as Trump threatens to declare a national emergency to bypass Congress. And while there is still no definite end in sight, S&P issued a report estimating that the US economy has already lost USD3.6bn due to the shutdown suggesting the markets will pay increased attention to this issue as those numbers are not small potatoes. And speaking of potatoes, Trump is due to talk to farmers in Louisiana who might not be receiving aide checks due to the shutdown and could turn into a contentious affair.
Fed Chair Powell remained coolheaded as his latest speech drew attention to a ” waiting and watching” FOMC who appear in no rush to raise rates. And then most especially, vice chair Clarida has confirmed that he is leaning on the dovish side by stressing the need for patience and stating that ‘if crosswinds sustained, fed policy should offset them’.Implying interest rates will very likely be kept on hold until June with the markets currently pricing in around zero for the rest of 2019 while monitoring data for clues to the next policy direction. But even with some Fed members discussing the chance of rates moving in either direction, at this stage of the game, a rate hike remains far more likely than a cut in 2019. But overall the FOMC messaging is providing relief to the stock market.’
Overall, Friday’s consolidation and market adjustments look and feel perfectly normal especially with the amount of turbulence still in the water.
Stock markets
Earnings start this week, and there should be a reason for concern given equity market stalwarts like Apple, Samsung and Macey’s have issued profit warnings in the past week, which likely triggered some pre-earnings week jitters on Friday as investors shifted into profit taking mode. But this week could be a critical test to see if we have reached peak short term equity markets optimism or can the positive mood extends.
Oil markets
Some confidence returned to markets last week as US equity, and oil prices climbed higher, however, Brent crude oil turned lower Friday on profit-taking as advancing equity markets hit the pause button after sharp gains in both markets last week. Also, traders were very unimpressed by reports indicating Russia has only reduced crude oil production by 50,000 bpd for January.
OPEC+ production cuts and optimism regarding recent U.S.-China trade talks are the primary factors stabilising prices. Notably, “Saudi Arabia’s oil production is currently at ~10.2 MMBbls/d – down 860 MBbls/d from the record-high in November and below the 10.3 MMBbl/d target it set for January under the production cut agreement”( Industry Data). Sure Saudi is on track to balance markets but is that good enough in the face of slowing global growth to push prices higher.
Meanwhile, comments from the US Federal Reserve chairman that the Fed is willing to be patient on policy buttressed global equity markets. ON the Pboc side of the equation, I think China stimulus will carry a lot of weight in the second half of 2019, but this will take time to filter through, and the market will most likely be unable to hold on to a bullish sentiment until then. So in the meantime, we could still be subject to a bearish worldwide economic view.
Indeed, slowing global growth continues to temper top side ambitions as speculation continues to mount that China will set a lower GDP target for 2019 of 6.0-6.5%. But adding to global slow down fears, the trend of weak data out of Europe continued last week as Industrial Production for November for Germany, France & Spain and Economic Confidence indicators for the European Union all printed lower than expectations, suggesting that the largest economies of the Eurozone contracted.
Who said production cuts are ineffective ? as Alberta’s mandated production cuts have seen the differential between West Canadian Select and WTI evaporate from $50 per barrel last October to under $ 7 per barrel last week as output cuts from both Alberta and Saudia Arabia have caught heavy crude refiners short and now left paying the piper.
Gold Markets
USD weakness will continue to be the key driver of market strength. However, I think equity sentiment this week could be a canary on the Gold mine gauge of global sentiment so Gold traders will be taking note of this very critical earnings season which could make or break this early 2019 equity market rebound. But ultimately on the Fed policy front, everything is lining up for a weaker USD and an eventual breakthrough $1300 level in convincing fashion.
Currency markets
Much of the current USD move on the Feds dovish shift is getting played out on the EUR and CNH which makes both currencies very susceptible to extended positioning and retracements into USD haven appeal.
Euro
While it could be argued that much of the EURUSD push to 1.1570 was a result of short covering, but that would belie the number of EURUSD longs that were entered on the break of 1.1525 only to have a “mea culpa “moment during the brutal move lower as stops were triggered on the break back below 1.1500.
Still, the Fed’s about-face is significant, and it should play out in as weaker USD eventually, but at least for today, the market disagrees. However, I remain confident that provided we can continue to close the day above 1.1450, there is scope for a more significant rally to play out.
Market Conviction LONG EURUSD with the 200 days moving average at 1.1629 the primary target: Provided the Fed has indeed paused, the EUR is going higher as a dovish fed should outweigh the weak EU economic data which is already baked in.
JPY
The Yen is mired in a relatively tight range but given the Fed dovish pivot I would expect more Yen repatriation flows and increased hedging from Japanese lifers, so I remain bullish Yen. I think last weeks flash crash is a foreshadowing of where USDJPY will trade in the months ahead.
Market Conviction NEUTRAL suggesting 107-110 range for USDJPY with the downside vulnerable
CNH
First of all, the stabilisation in CNH has no significant domestic economic rationalisation, but instead, momentum from a softer Fed coupled with easing in US-China trade tensions is providing the bullish synergy. In other words, its a highly speculative driven CNH rally and uber prone to retracements. And while I’m confident the US administration is pushing for a weaker USD but certainly during this depressing economic downturn, China would prefer a stable to weaker Yuan due to the monetary tightening effect a stronger Yuan generates.
And predictably we did get some suggestion of possible intervention in the offing on Friday. “Market News International around 8:00 AM EST: “Any further rapid appreciation by the currency, which has risen sharply at the start of this year’s trading, could impact China’s exports, the source said, without saying whether the PBoC would intervene to slow any move in the yuan. Separately, reports started circulating that The People’s Bank of China does not want a sharp appreciation by the yuan, the reports were citing a “source close to the PBOC”.
So, if we are looking for a reason why the Euro fell look no further then the move in USDCNH that was driven by some concerns that the Pboc could be preparing to slow the pace of the Yuan appreciation.
Market Conviction Short USDCNH with an extended target of USDCNH 6.65: Provided trade war detente continues to move forward constructively there should be a strong recovery in mainland capital inflow. The one stumbling block on the path to 6.65, however, is that the Pboc is starting to express concern via MNI news at the pace of RMB appreciation, While intervention is highly unlikely as the Pboc don’t want to be seen as ” market manipulators ” they are most likely tempering the appreciation via a verbal response. None the less over the short term Pboc warning could be good enough to hold the dollar bears at bay.
However after the trade truce dip fades, long CNH positions will have little in the way of domestic economic support to hang their hat on with domestic growth set to slow to 6% in Q2, the Yuan will most certainly be overvalued and will need to rebalance. So against the current market grain Im looking to build long CNH positions gradually but since I remain long term bullish EUR long EURCNH is the ideal vehicle to express this view, which also leads into my opinion below.
CNH and EUR connection?
If there were a deal afoot between the US and China to weaken the USD, it would make sense for China to buy Euro given that China has an enormous appetite to diversity from USD over-reliance.
The Ringgit
The “risk on” signs are compelling which should benefit commodity and oil-linked currencies driven by a Fed pause and easing the US-China trade tensions.
The Fed pause walks back a lot of long USD positions that were built around the Fed policy normalisation vs BNM neutral stance. And if we get shot in the arm from a definitive Trade war truce, we could see the MYR extend gains to USDMYR 4.05 in a heartbeat.
Over next week traders will put greater emphasis on the dovish Fed vs the already baked in downside risk for the Ringgit.
One of the big key for the Ringgit next week is that Malaysia will soon issue Samurai bond(A samurai bond is a yen-denominated bond issued in Tokyo by the non-Japanese entity). While adding money to the government coffers is always a welcome boost the Samurai issue will remind investors of the fear of a credit rating downgrade, which has been looming over Malaysia capital markets, has left the picture.
Market conviction has improved to guardedly positive from negative territory which is a considerable improvement. Provided trade war detente continues to move forward constructively, oil prices extend into a bullish area ( WTI + $ 55) and the Fed has indeed paused we could see the USDMYR trade to 4.075 and possibly extend below 4.05.
Korean Won
IN the wake of the Samsung warning and the slide in memory chip prices amidst regional growth concerns with China economy flapping in the wind, I’m also shifting negative Won in preference of the high yielding IDR.
Cryptocurrency
BTC, the flagship cryptocurrency took a deep dive to 35, $3500 that is, coincidentally in the wake of the 51% attack on the ethererum classic. These types of security breaches usually cause a drop in investor confidence. I don’t have a particularly exciting view of why this happens other than to suggest investors start to think If it can happen to A, it can happen to B and C; then people panic because someone big is selling to move the markets. Case in point, market chatter was doing the virtual rounds on Sunday of large institutional investors pushing the market lower which unfortunately can spook the Crypto markets which are heavily dominated by retail investors. However, on a break of $3000, there will be no middle ground between success or failure and for those expressing sell-offs are good for Crypto( scratching my head on that theory) , they will likely be in for a reality check as markets could move in to the realm of irrational depreciation on the back of retail investor panic.
EURUSD Backs Off Higher Prices With Eyes On 1.1421 Zone
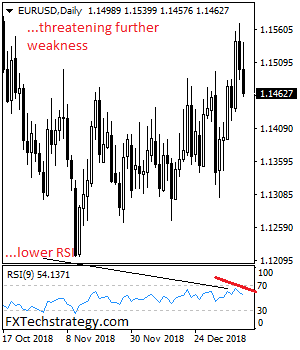
EURUSD backs off higher prices with eyes on 1.1421 zone in the new week. Support comes in at the 1.1450 where a violation will aim at the 1.1400 level. A break below here will target the 1.1350 level. Further down, support lies at the 1.1300. On the upside, resistance resides at 1.1500 level with a break through there opening the door for further upside towards the 1.1550 level. Further up, resistance comes in at the 1.1600 level where a violation will expose the 1.1650 level. All in all, EURUSD continues to threaten further downside pressure on price rejection.
CRUDE OIL Retains Its Bullish Offensive Short Term
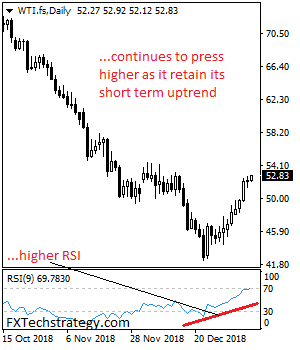
CRUDE OIL retains its bullish offensive short term as it looks for more strength. Support lies at the 52.00 level where a break will expose the 51.50 level. A cut through here will set the stage for a run at the 51.00 level. Further down, support comes in at the 50.50 level. On the upside, resistance resides at the 53.00 level. Further out, resistance comes in at the 53.50 level. A break above here will aim at the 54.00 level and then the 54.50 level followed by the 55.00 level. Its daily RSI is bullish and pointing higher suggesting further strength. All in all, CRUDE OIL remains biased to the upside in the short term.
Eco Data 1/14/19
[php_everywhere instance="1"]
Forex Forecast and Cryptocurrencies Forecast
First, a review of last week's events:
EUR/USD. On Wednesday, January 9, after repeated attempts, the pair managed to break through the upper limit of the mid-term side channel in which it was located, starting from November 2018. Having overcome the resistance in the area of 1.1500, it reached the height of 1.1570, after which the followed by a trend reversal, and the pair once again found itself within the above channel, ending the week at 1.1470.
The weakening of the dollar was influenced by a number of factors: the unplanned "holidays" of the US Government, a very cautious, "pigeon", speech of Fed Chairman Jerome Powell at the Economic Club meeting in Washington, where he pronounced the word "patience" five times. But the main factor, according to many experts, was the active strengthening of the Chinese yuan before the expected signing of a trade agreement with the United States;
GBP/USD . Recall that only 15% of analysts sided with the bulls last week. But they were right. Unclear prospects for the dollar outweighed the concerns associated with Brexit. The pound was supported by positive UK GDP data released on Friday, January 11th. As a result, the pair rose by almost 150 points, reaching the height of 1.2865, after which a slight rebound followed, and the quotes dropped to the zone of 1.2840;
USD/JPY. After the "New Year storm," caused by the lack of liquidity, the Japanese currency is complete calm, moving in a fairly narrow side corridor within 107.75-109.10. The pair met the end of the week in the same place where it started , near the Pivot Point 108.50. The reason for this is the emerging balance between the attractiveness of the yen as a safe-haven currency and the growing interest in other currencies that can bring grat profits if a trade deal is concluded between the US and China;
Cryptocurrencies. Our review is fundamentally different from other reviews in that it is not an opinion of one particular analyst. In our analysis, we strive to collect as many opinions of various experts as possible so that, getting rid of harmful "noises", we can identify the main trend that determines the movement of the pairs in one direction or another. However, it can be very difficult, as, for example, now, for cryptocurrencies.
Some experts consider the decline of the main crypto pairs last week as the end of the positive correction that started in mid-December 2018, and a return to the negative dynamics of the market. And someone, on the contrary, see it as a post-holiday syndrome, at the end of which the quotes will again rush up.
Whatever it may be, the crypto market's capitalization fell from $138 billion on January 6 to $123 billion on Friday January 11, having lost almost 11%. The quotes of major cryptocurrencies, Bitcoin, Litecoin, Ethereum, Ripple, and many other, also fell. Thus, the pair BTC/USD is traded near the three-week low in the $3,700 zone.
The reasons for the fall are the fact that investors, hoping for a festive gap, disappointed, are now closing their positions, and the fact that about 40,000 Ethereum coins have been stolen from Gate.io exchange. The news about the failure of the Japanese regulator FSA to launch ETF based on cryptocurrency might also add to the negative reasons. In general, there are many reasons, but the fact remains that all the main altcoins have moved to the red zone and are traded down, from 5% to 23%, as, say, ETH.
As for the forecast for the coming week, summarizing the opinions of a number of analysts, as well as forecasts made on the basis of a variety of methods of technical and graphical analysis, we can say the following:
EUR/USD. As you know, the European currency has a strong correlation with oil and metals. And on the commodity market, we are now witnessing a positive trend, especially with regard to energy. The intentions of OPEC to completely remove the excess oil from the market should lead to a further increase in prices, which plays into the hands of the euro. The pause, taken by the Fed regarding the increase in lending rates for the US dollar, is worrying investors.
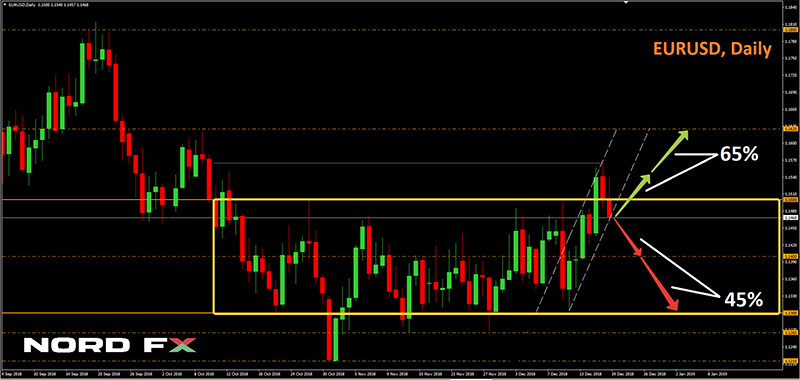
As a result, at the moment, 65% of analysts, supported by 90% of oscillators and 70% of trend indicators on D1, have voted for the rise the pair above the 1.1500 zone up and its growth, first to the height of 1.1550 and then to the level of 1.1625.
The experts, who still remain loyal to the US currency, believe that, returning to the medium-term channel 1.1300-1.1500, it will not break out of it for a long time. And this is why the pair is expected to decline, first to its central line 1.1400, and then 100 points lower;
GBP/USD. It is clear that the absolute majority of indicators are currently colored green. However, already 10% of oscillators on D1 signal that this pair is overbought. The possibility of its falling to the horizon 1.2600 is indicated by graphical analysis on the daily time frame as well. As for experts, there is no clear advantage here either for bulls or bears. 55% of them have voted for the growth of the pair, and 45% are for its fall.
On Tuesday, January 15, the British Parliament will vote on Brexit. It is likely that the version of the agreement with the EU proposed by Prime Minister Teresa May will be rejected, and another delay is coming. At the same time, it is becoming more and more obvious that a tough divorce with the European Union is not included in the government's plans, which positively affects the quotes of the British currency. The additional support for the pound is rendered by the rise in oil prices.
Until the results of the voting become known, there is no sense to make any predictions. One can only specify the key levels: support - 1.2780, 1.2720, 1.2660 and 1.2600, resistance - 1.2925 and 1.3050;
USD/JPY. Indicators and graphical analysis on D1 predict a strengthening of the Japanese currency, with which 65% of experts agree, they expect the pair to decline to 107.50-107.80, and then even lower, to support 106.70.
On the other hand, due to low interest rates in Japan, the pair is quite strongly correlated with the major global stock indices. And the upward trend in this market implies a possible growth of the pair to the levels of 109.10 and 109.45, and in case of the breakdown of the latter, its transition to the zone of 110.25-110.80;
Cryptocurrencies. Despite the fall in the crypto market capitalization, the average daily number of transactions with Bitcoin approached 280,000 over the last week, which is comparable to the peaks of 2018. Therefore, it is is hardly worth it to predict the end of the benchmark cryptocurrency, and indeed the entire market. But the probability of the BTC/USD breakout of support $3,700 and its return to the mid-December lows in the $3,250 zone remains quite high. This scenario is supported by 45% of experts.
Most analysts believe that next week the pair will be able to stay in the three-week "speculative" zone of $3.685-4.385. However, they speak very cautiously about the rise to the level of $5,000 and only in the longer term.
The expectations for Ethereum are somewhat better. Experts expect that after the hard fork called Constantinople, the ETH/USD pair will go up.
Is It Possible to Double Your Money Each Day by Trading?
There are many ads online that tell you can double your profits on Forex in just a day. Of course, this is an exaggeration. And yet, it might be possible.
With this article, you will:
- Explore the most profitable Forex trading strategy;
- See if it is possible to double your starting capital each day.
What Is The Most Profitable Forex Trading Strategy?
There are hundreds of Forex strategies that claim to be profitable. Of course, there is no way we could review all of them in this article. That’s why we are going to discuss just the most profitable one — scalping.
Scalping is a collective term for all strategies that prioritize the number of deals before their profitability. For example, a scalper would have ten profitable orders closing with ten pips of profit rather than have one that closes with 100 pips.
This form of trading allows for extremely tight StopLosses. With scalping, a single lousy order will not hurt your overall disposition on the market — unlike the other way around.
The main issue with scalping is its high demands. Scalpers trade on the small timescales, which means they don’t get a lot of time to make a decision and often have to go with their intuition. And since it is your money that’s involved, scalping causes a lot of stress.
How to Trade With Lazy River?
Lazy River is the friendliest scalping strategy. It is easy to get into, and it provides a fair number of trading opportunities daily. There are other strategies, like Bali Scalping or RSI Scalping, that bring more trading opportunities or larger profit margins. However, they also carry much more risk and aren’t recommended to a newcomer.
Lazy River trader is going to need:
- A 5-minute timeframe;
- Two indicators: exponential 50 MA and 20 MA;
- A currency pair with high liquidity. EUR/USD or USD/CAD are good examples.
Once you have this system set up, wait for the price to get in-between the 50 MA and 200 MA. Consider them the banks of your “river.” If the rate remains there for more than three candlesticks worth of time — do nothing, this situation is not profitable for Lazy River. However, if it attempts to exit the boundaries of the indicators — it’s time to act.
- Open two orders for the same amount of money in the direction of the price movement.
- Close both by StopLoss if the price reverts behind the local extremum;
- Close the first order by TakeProfit when it reaches the StopLoss value;
- Close the second order manually when the trend starts to reverse.
NOTE: If your indicators are crossing, consider stepping back for a couple of minutes, until the things settle down. Even if the other conditions are favorable, the risks get too high.
If it sounds complicated, here’s an example:
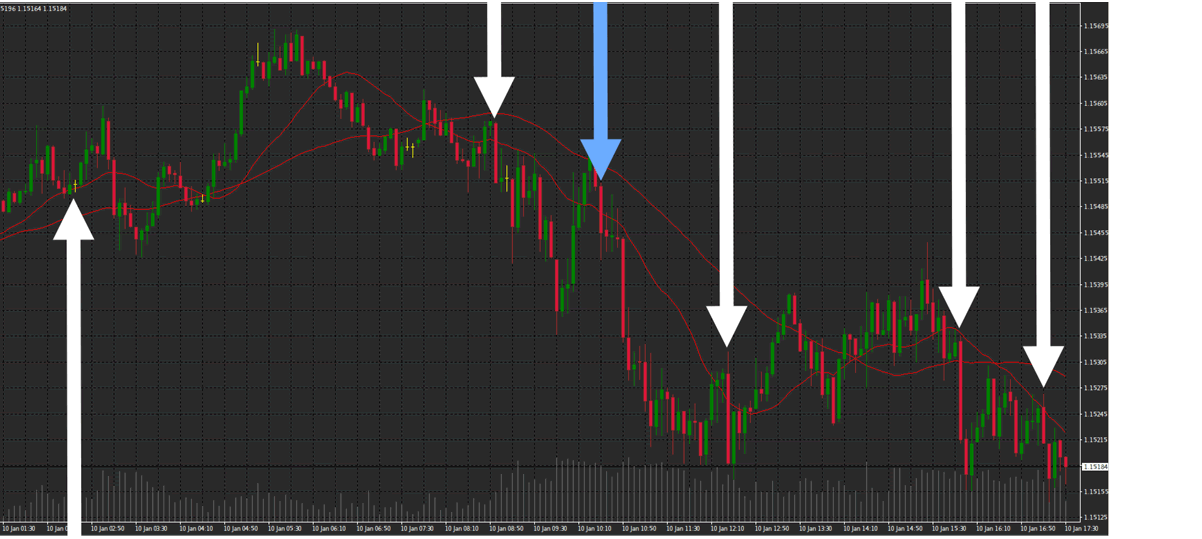
On this EUR/USD chart, the trading opportunities for the lazy river strategy are marked with arrows pointing in the direction of the price leaving the “river.” The best example occurred on January 10, at 10:05 (the third arrow from the left, marked blue). Let’s take a closer look at it:
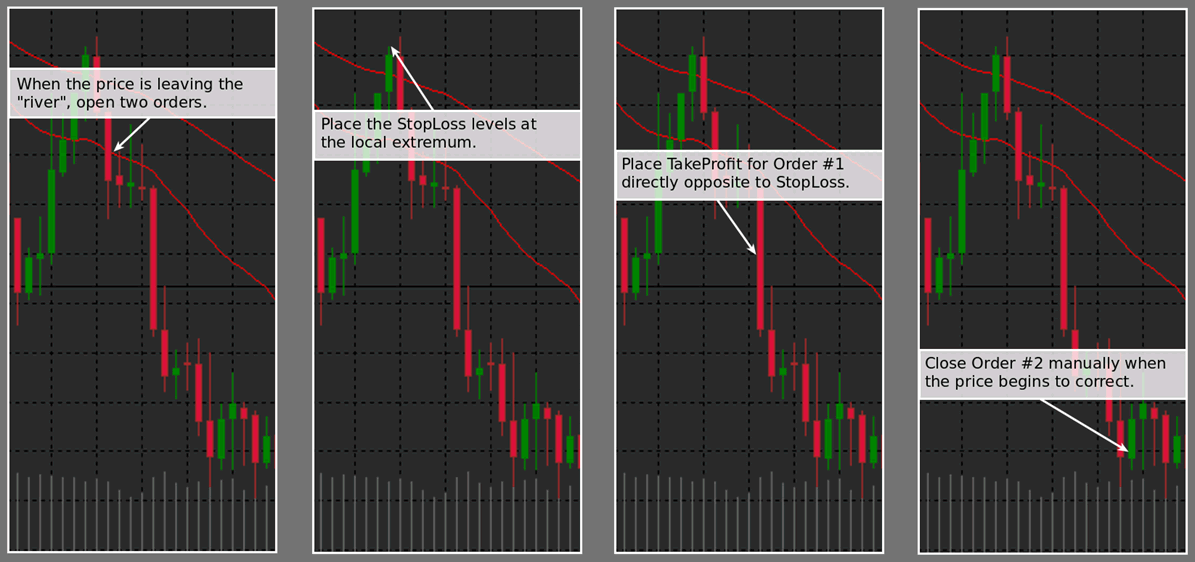
The first order ends up making 80 pips or profit, the second one — 240 pips. If both orders were opened with 10 000 USD, the first order would end up making 8 USD, the second one — 24 USD. Combined, they’d put the trader 0.16% in the green.
0.16% doesn’t sound like much. However, that’s only if you are trading without leverage. With 1:100 leverage, these orders end up making 16% of profit — which is not too shabby for a single order! Of course, this case is exceptional. An average deal would be less profitable — around 5-8%. You can test this strategy on free practice account only by just entering your email here.
Is It Possible to Double Your Starting Capital Daily?
If you take the average order profit of the strategy (8%), you might think that you can easily double your starting capital — after all, you need only 13 successful orders a day. The reality is not that simple.
First of all, not each deal is a success. Even if you do everything right, you still might end up losing money because of an erratic movement on the market. Sometimes the strategy doesn’t work out, and you end up closing by StopLoss or just without profit.
Also, there might not be enough opportunities in a day. For example, in the less volatile currency pairs, you might get only 5 or 6 trading opportunities a day — and getting 20% profit on each of them would be a miracle.
So while it is possible to double your starting capital, it is highly improbable to do so. However, multiplying it by 1.5 is possible and probable, as long as your broker has tight spreads. JustForex ECN Zero accounts, for example, are perfect for Lazy River scalping due to 0 spreads.
EUR/USD Weekly Outlook
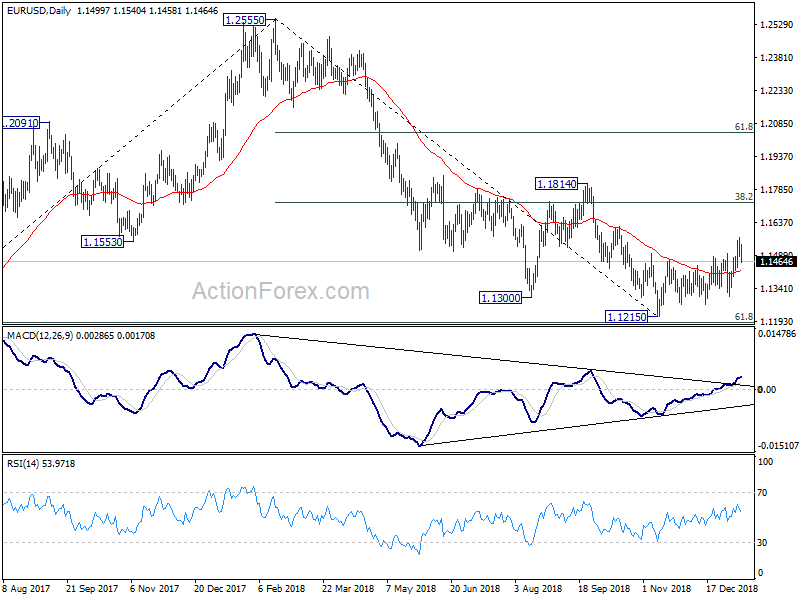
EUR/USD rose to as high as 1.1569 last week and broke 1.1499 resistance. The development argues that rise from 1.1215 is correcting whole down trend from 1.2555. But as a temporary top is formed, initial bias is neutral this week first. On the upside, above 1.1569 will extend the rebound through 1.1621 resistance to 38.2% retracement of 1.2555 to 1.1215 at 1.1727 next. On the downside, however break of 1.1422 support will bring retest of 1.1214 low instead.
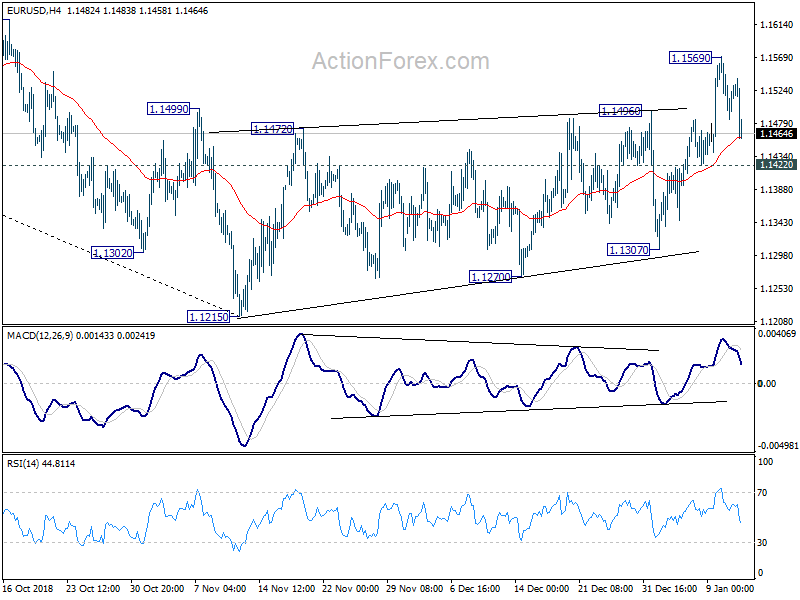
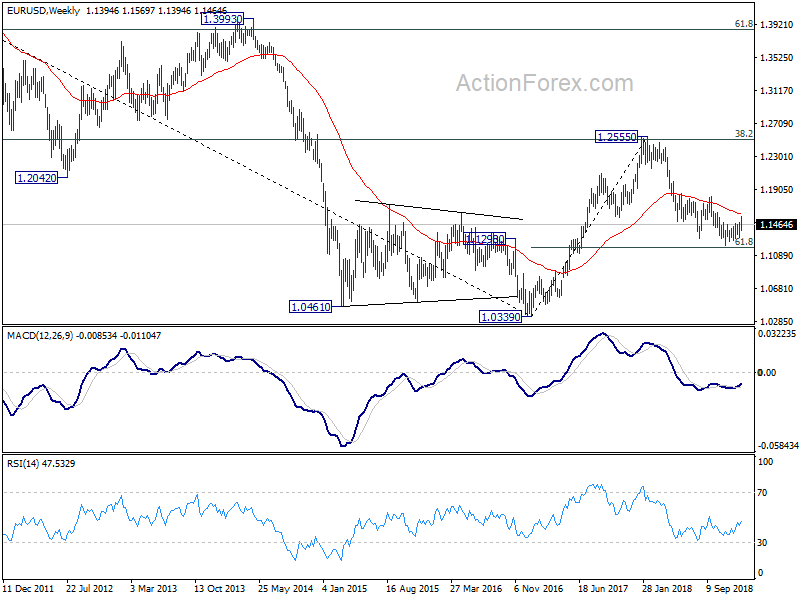
In the bigger picture, as long as 1.1814 resistance holds, down trend down trend from 1.2555 medium term top is still in progress and should target 61.8% retracement of 1.0339 (2017 low) to 1.2555 at 1.1186 next. Sustained break there will pave the way to retest 1.0339. However, break of 1.1814 will confirm completion of such down trend and turn medium term outlook bullish.
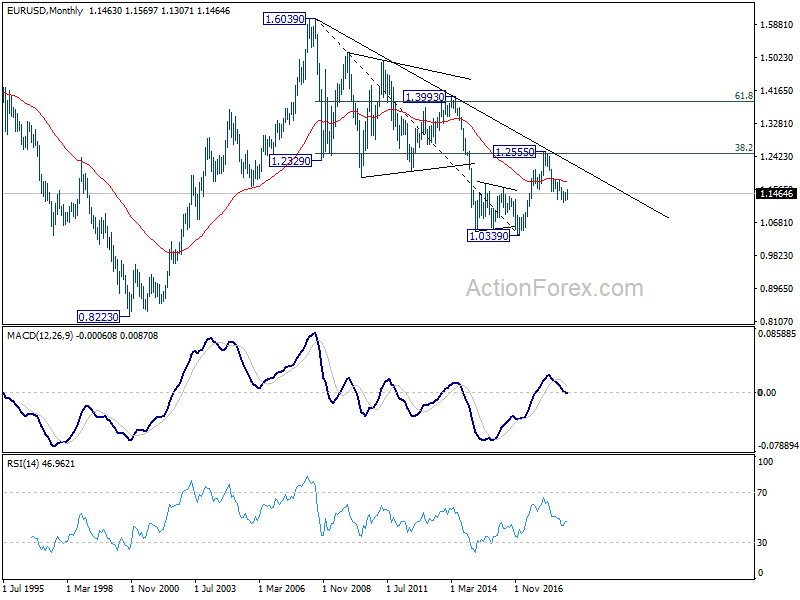
In the long term picture, the rejection from 38.2% retracement of 1.6039 to 1.0339 at 1.2516 argues that long term down trend from 1.6039 (2008 high) might not be over yet. EUR/USD is also held below decade long trend line resistance. Firm break of 61.8% retracement of 1.0339 to 1.2555 at 1.1186 should at least bring a retest on 1.0339 low. This will remain the favored case as long as 1.1814 resistance holds.
USD/JPY Weekly Outlook
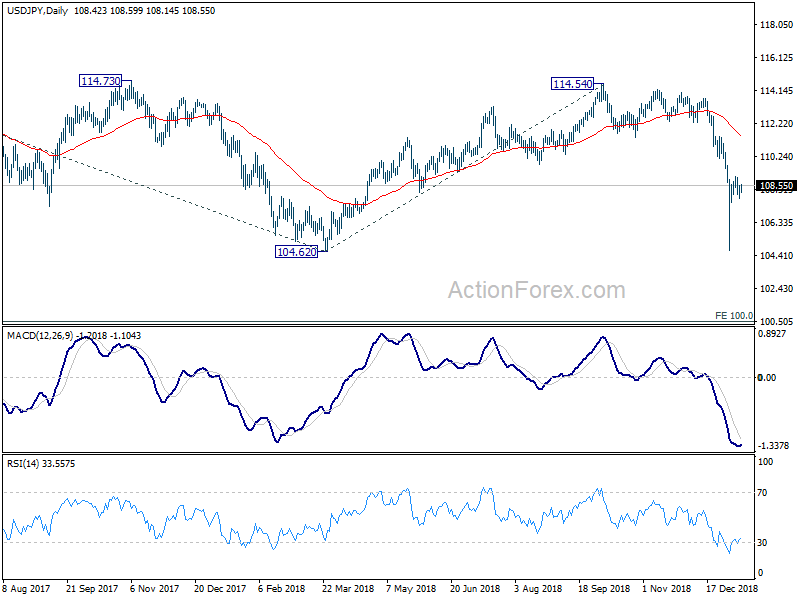
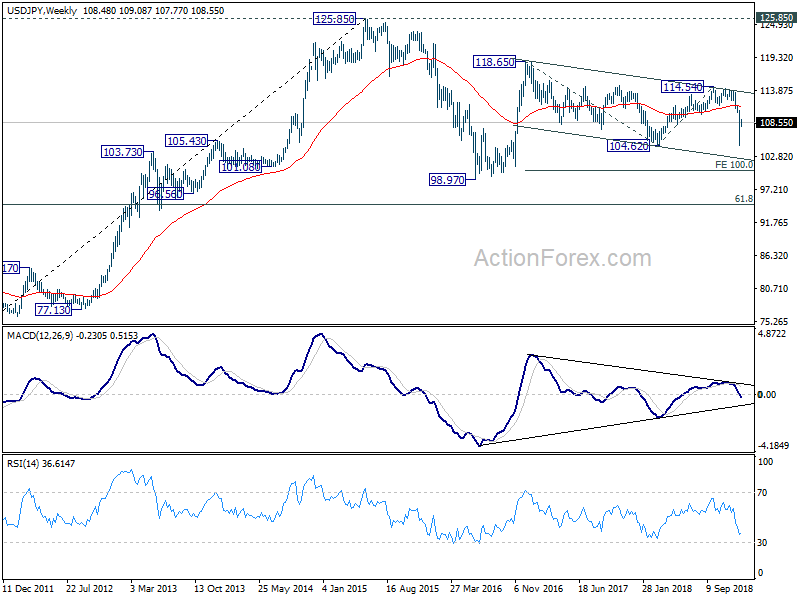
USD/JPY's rebound from 104.69 low extended to 109.08 last week and retreated. But there was no follow through selling after hitting 107.77. Initial bias stays neutral this week first. In case of another rise, upside should be limited by 109.46 minor resistance. On the downside, below 107.77 will turn bias to the downside for retesting 104.69 low. Overall, larger downtrend from 118.65 (2016 high) is expected to resume finally through 104.62 after current consolidation from 104.69 completes.
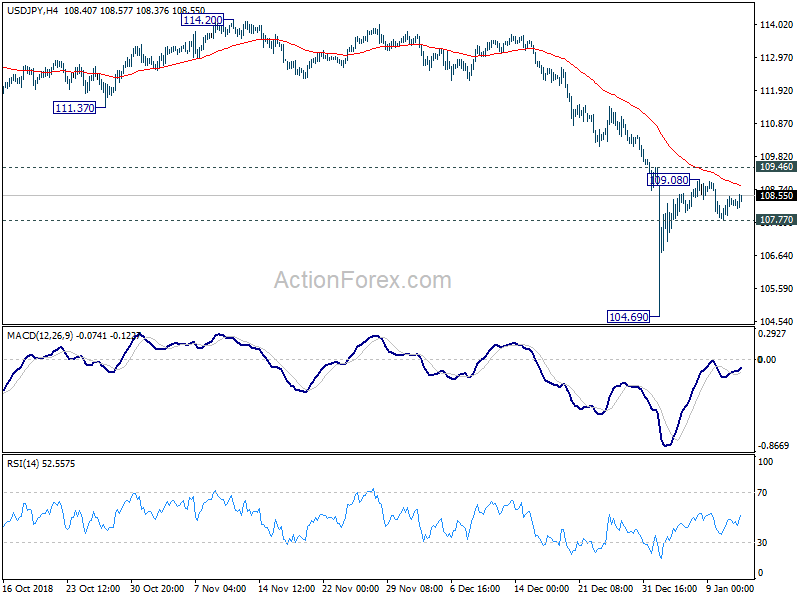
In the bigger picture, price actions from 125.85 (2015 high) are seen as a long term corrective pattern, no change in this view. Apparently, such corrective pattern is not completed yet. Fall from 114.54 is seen as part of the falling leg from 118.65 (2016 high). Break of 104.62 will target 100% projection of 118.65 to 104.62 from 114.54 at 100.51, which is close to 100 psychological level. But in that case, we'd expect strong support from 98.97 to contain downside to bring reversal. Also, this bearish case will remain the preferred one as long as 114.54 resistance holds.
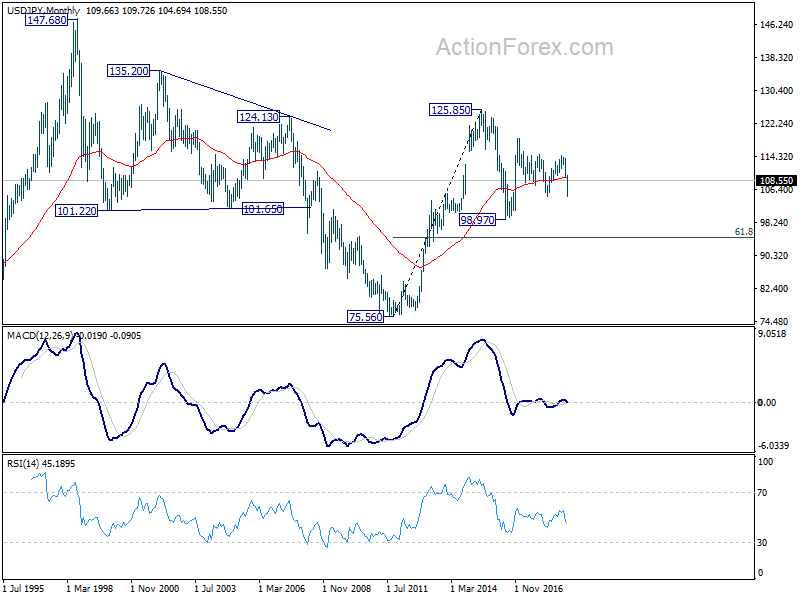
In the long term picture, the rise from 75.56 (2011 low) long term bottom to 125.85 (2015 high) is viewed as an impulsive move, no change in this view. Price actions from 125.85 are seen as a corrective move which could still extend. In case of deeper fall, downside should be contained by 61.8% retracement of 75.56 to 125.85 at 94.77. Up trend from 75.56 is expected to resume at a later stage for above 135.20/147.68 resistance zone.
GBP/USD Weekly Outlook
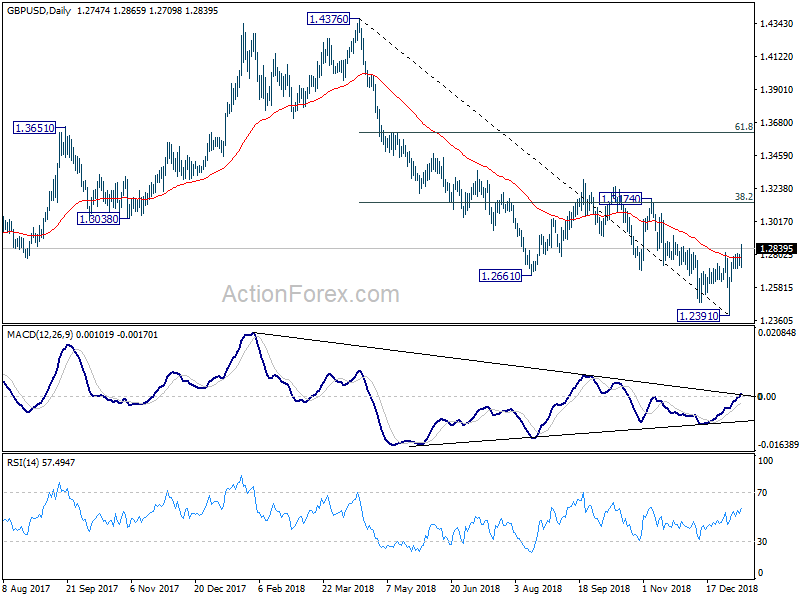
GBP/USD's rebound from 1.2391 extended to as high as 1.2865 last week and broke 1.2814 resistance. The development now suggests that such rebound is correcting whole down trend from 1.4376. Initial bias remains on the upside this week for 1.3174 resistance, which is close to 38.2% retracement of 1.4376 to 1.2391 at 1.3149. We'd expect strong resistance from there to limit upside, at least on first attempt. On the downside, break of 1.2709 minor support will argue that such rebound is completed and turn bias back to the downside for retesting 1.2391 low.
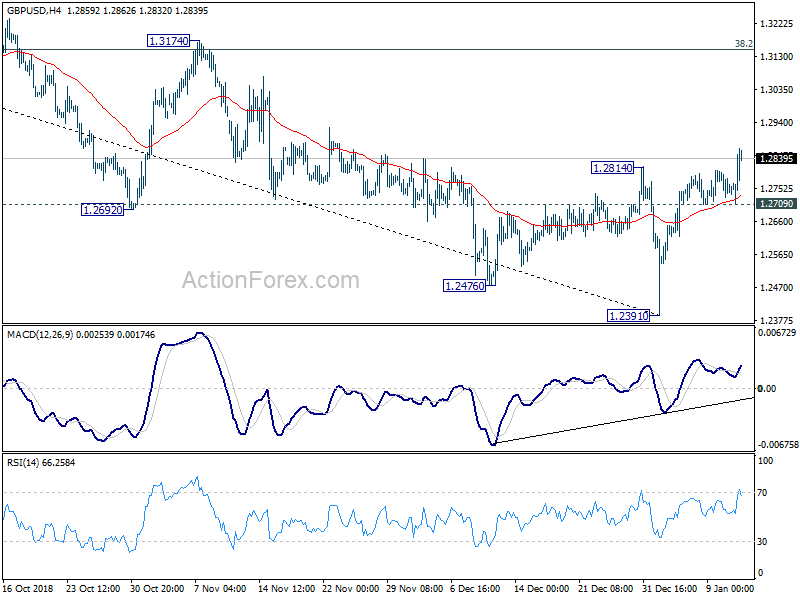
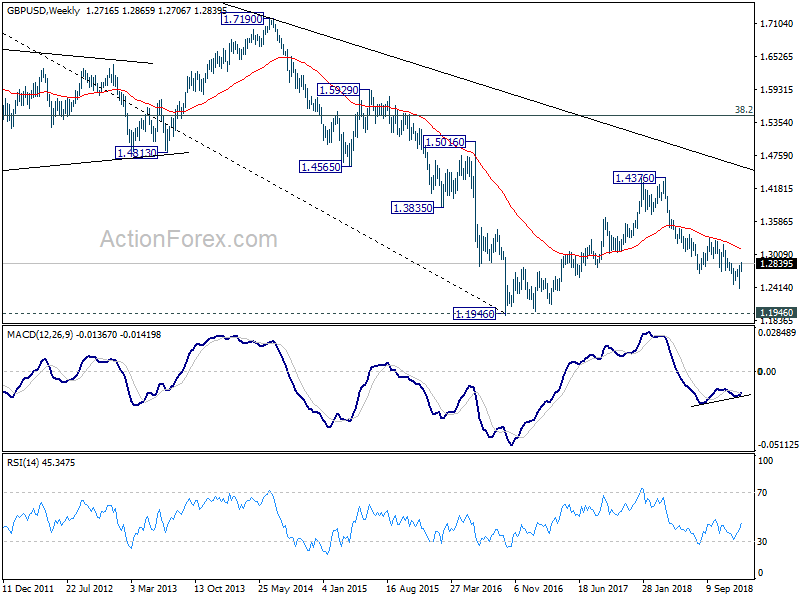
In the bigger picture, whole medium term rebound from 1.1946 (2016 low) should have completed at 1.4376 already, after rejection from 55 month EMA. The structure and momentum of the fall from 1.4376 argues that it's resuming long term down trend from 2.1161 (2007 high). And this will now remain the preferred case as long as 1.3174 structural resistance holds. GBP/USD should target a test on 1.1946 first. Decisive break there will confirm our bearish view. However, sustained break of 1.3174 will invalidate this case and turn outlook bullish.
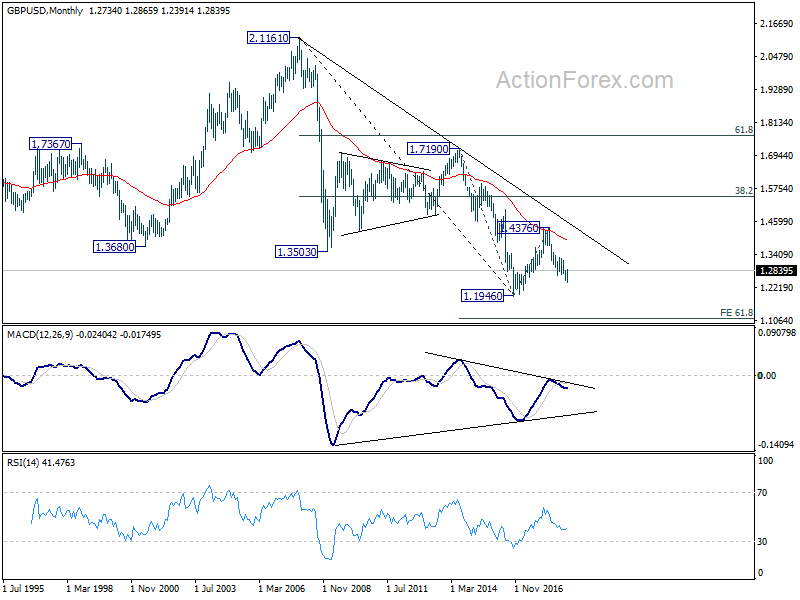
In the longer term picture, outlook in GBP/USD remains bearish. Rebound from 1.1946 was rejected solidly by falling 55 month EMA. The pair was limited well below 38.2% retracement of 2.1161 (2007 high) to 1.1946, as well as the decade long falling trend line. On break of 1.1946, next target will be 61.8% projection of 1.7190 to 1.1946 from 1.4376 at 1.1135.
USD/CHF Weekly Outlook
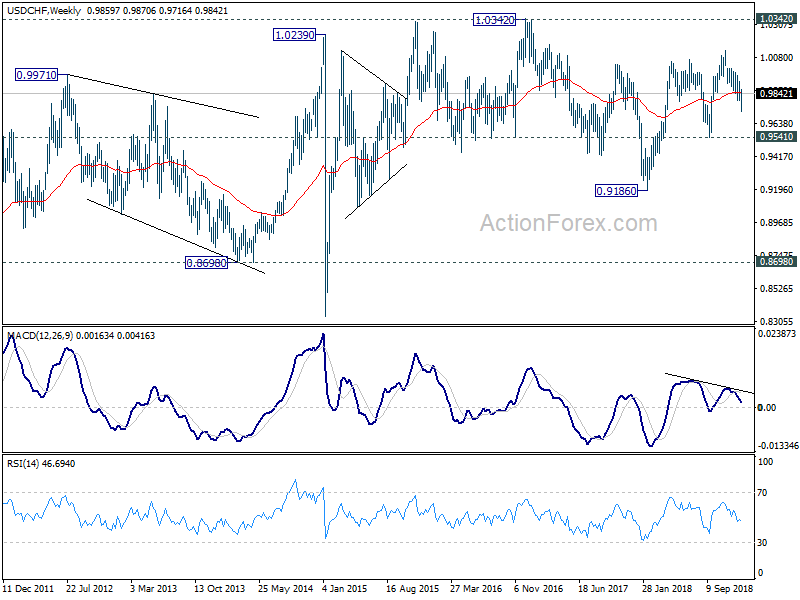
USD/CHF's choppy fall from 1.0128 extended to as low as 0.9716 last week before forming a temporary low and recovered. Initial bias remains neutral this week for some consolidations first. The deeper then expected decline argues that it's correcting whole rise from 0.9186. On the downside, break of 0.9716 will target 0.9541 cluster support (61.8% retracement of 0.9186 to 1.0128 at 0.9546).
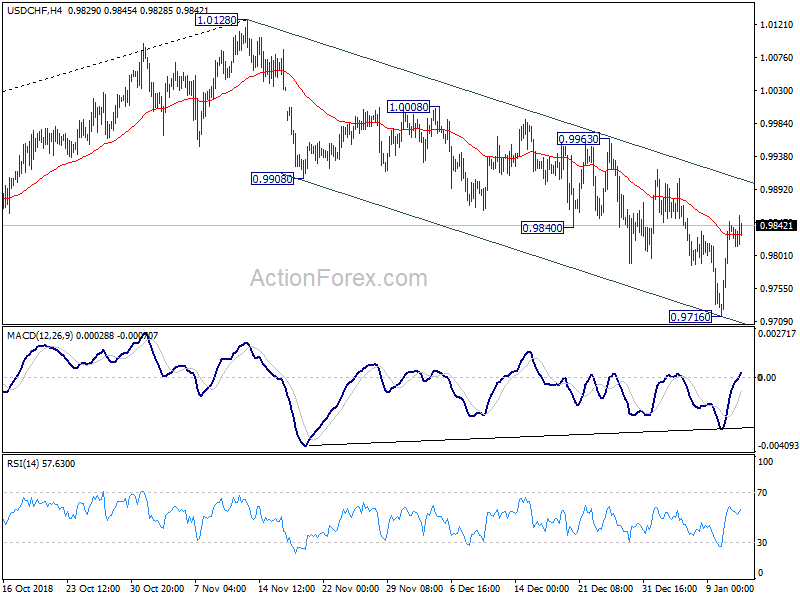
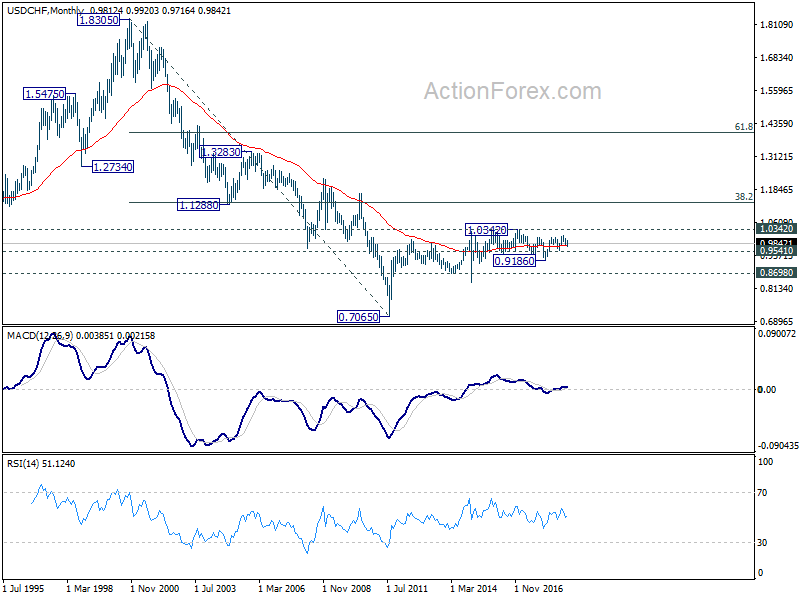
In the bigger picture, current development suggests that rise from 0.9186 has possibly completed with three waves up to 1.0128 already. Decline from 1.0128 could either be correcting this move, or reversing the trend. As long as 0.9541 support holds, we'd slightly favor the former scenario, and expect another rise through 1.0128 at a later stage. However, sustained break of 0.9541 will confirm trend reversal and bring deeper fall back to 0.9186 low.
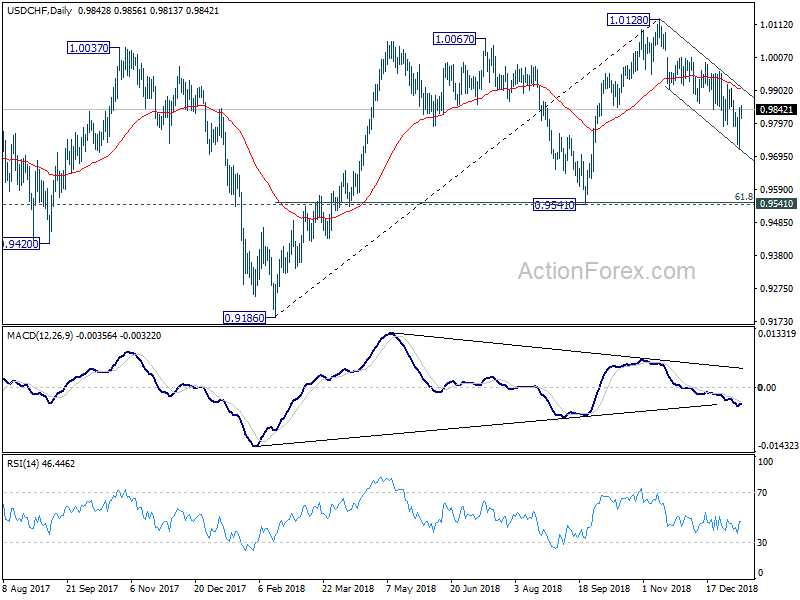
In the long term picture, price actions from 0.7065 (2011 low) are not clearly impulsive yet. Thus, we'll treat it as developing into a corrective pattern, at least, until a firm break of 1.0342 resistance.