

Sample Category Title
Aussie Reverses Its Gains In The Asian Session
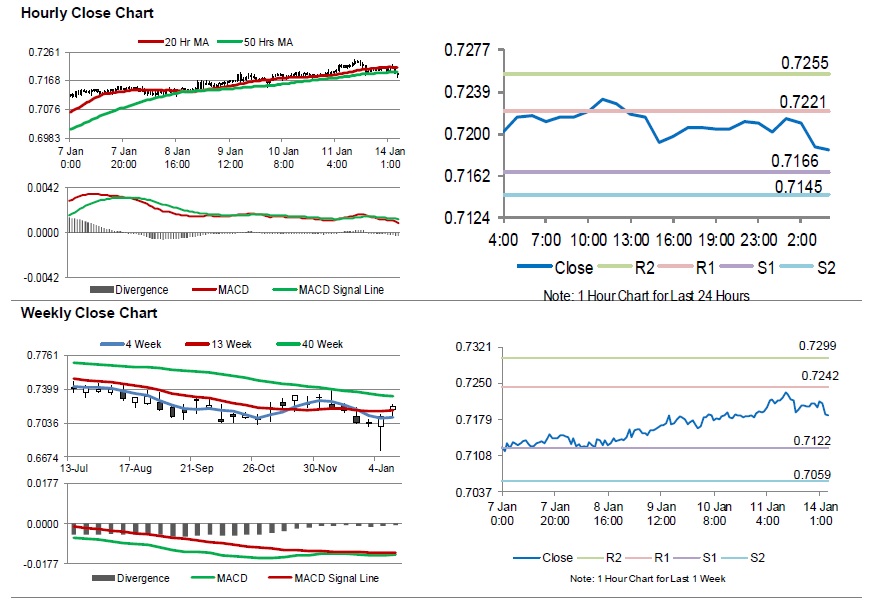
For the 24 hours to 23:00 GMT, the AUD rose 0.14% against the USD and closed at 0.7205 on Friday.
LME Copper prices rose 0.3% or $18.0/MT to $5926.5/MT. Aluminium prices declined 1.5% or $28.0/MT to $1816.0/MT.
In the Asian session, at GMT0400, the pair is trading at 0.7186, with the AUD trading 0.26% lower against the USD from Friday’s close.
Elsewhere in China, Australia’s largest trading partner, China’s trade surplus widened to $57.1 billion in December, surpassing market expectations for a surplus of $51.6 billion. The nation had posited a surplus of $44.7 billion in the prior month.
The pair is expected to find support at 0.7166, and a fall through could take it to the next support level of 0.7145. The pair is expected to find its first resistance at 0.7221, and a rise through could take it to the next resistance level of 0.7255.
The currency pair is trading below its 20 Hr and 50 Hr moving averages.
Gold: Yellow Metal Trading Higher In The Morning Session
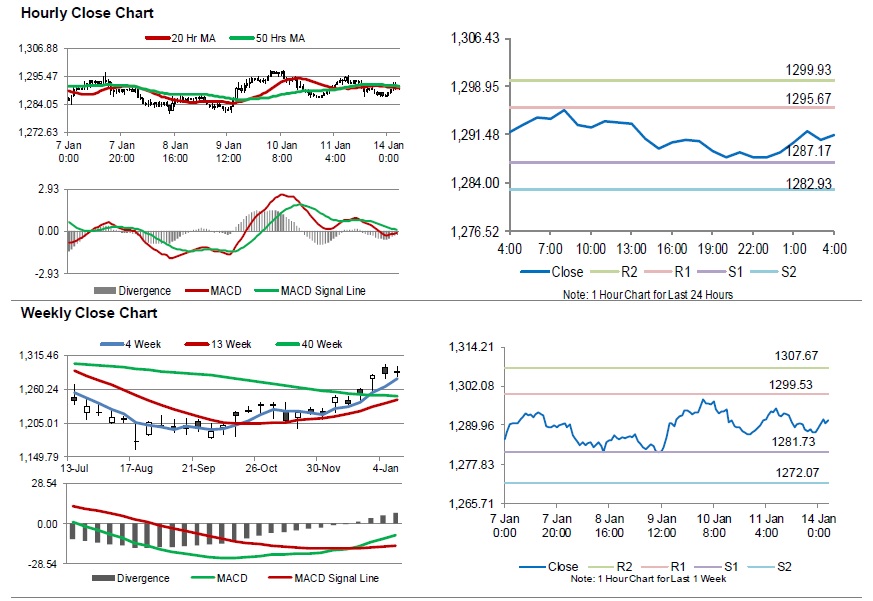
For the 24 hours to 23:00 GMT, Gold declined 0.21% against the USD and closed at USD1288.80 per ounce on Friday.
In the Asian session, at GMT0400, the pair is trading at 1291.40, with gold trading 0.20% higher against the USD from Friday’s close.
The pair is expected to find support at 1287.17, and a fall through could take it to the next support level of 1282.93. The pair is expected to find its first resistance at 1295.67, and a rise through could take it to the next resistance level of 1299.93.
The yellow metal is showing convergence with its 20 Hr and 50 Hr moving averages.
Silver: White Metal Trading On A Weaker Footing This Morning
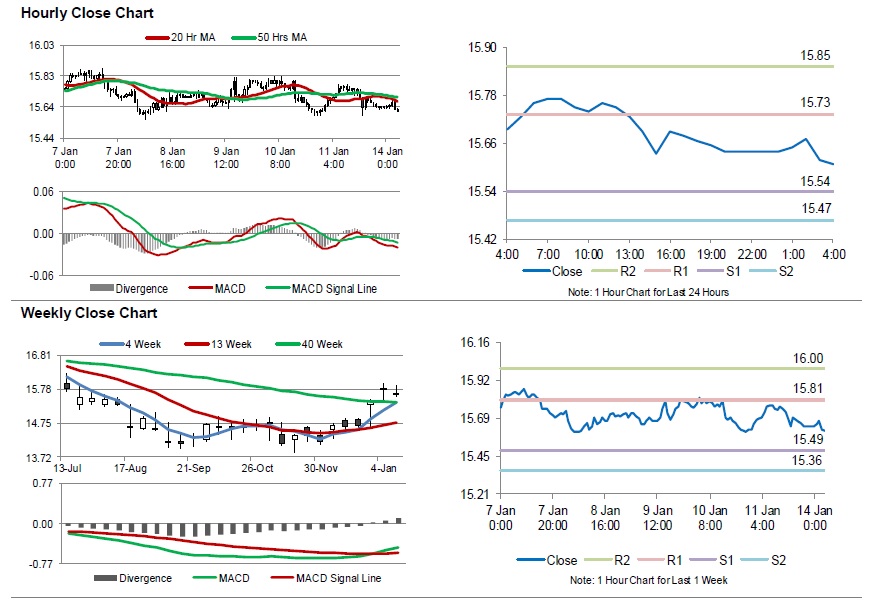
For the 24 hours to 23:00 GMT, Silver declined 0.29% against the USD and closed at USD15.64 per ounce on Friday, tracking losses in gold prices.
In the Asian session, at GMT0400, the pair is trading at 15.61, with silver trading 0.19% lower against the USD from Friday’s close.
The pair is expected to find support at 15.54, and a fall through could take it to the next support level of 15.47. The pair is expected to find its first resistance at 15.73, and a rise through could take it to the next resistance level of 15.85.
The white metal is trading below its 20 Hr and 50 Hr moving averages.
Crude Oil: Oil Extends Its Losses In The Asian Session
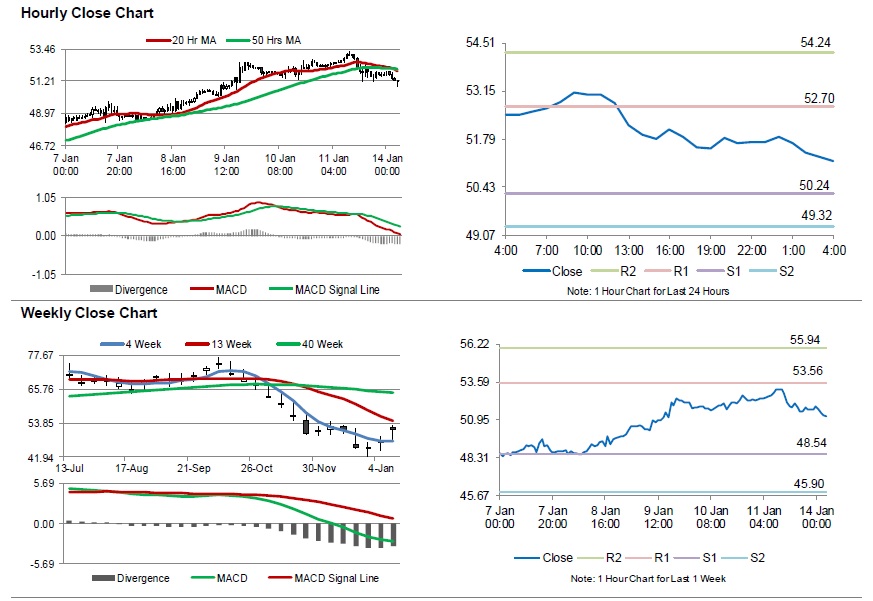
For the 24 hours to 23:00 GMT, Crude Oil declined 1.20% against the USD and closed at USD51.82 per barrel on Friday.
Moreover, fresh figures from Baker Hughes disclosed that the number of active oil rigs declined by four to 873 in the week ended 11 January 2019.
In the Asian session, at GMT0400, the pair is trading at 51.17, with oil trading 1.25% lower against the USD from Friday’s close.
The pair is expected to find support at 50.24, and a fall through could take it to the next support level of 49.32. The pair is expected to find its first resistance at 52.70, and a rise through could take it to the next resistance level of 54.24.
Crude oil is trading below its 20 Hr and 50 Hr moving averages.
China Dec trade balance: Massive -35.8% yoy fall in US imports; exports and imports contracted most since 2016
China posted a set of very disappointing trade data today. Exports and imports posted biggest contraction since 2016. More importantly, imports from the US dropped a massive -35.8% yoy in the month. But for the year, trade surplus with the US hit a record high.
In USD terms in December,
- Trade surplus widened to USD 57.1B, above expectation of USD 51.6B.
- However, exports dropped -4.4% yoy to USD 221.3B.
- Imports dropped -7.6% yoy to USD 164.2B.
- Both imports and exports suffered the steepest decline since 2016.
Staying in December,
- With the US, export dropped -3.5% yoy to USD 40.3B, imports dropped a massive -35.8% yoy to USD 10.4B.
- With EU, exports dropped -0.3% yoy to USD 37.6B, imports dropped -2.7% yoy to USD 22.5B.
- With Australia, exports dropped -5.2% yoy to USD 4.0B, imports dropped -3.4% yoy to USD 7.3B.
For the year as a whole,
- With the US, exports rose 11.3% yoy to USD 478.3B, imports rose just 0.7% yoy to USD 155.1B.
- Trade surplus with the US jumped 17.2% yoy to USD 323.2B, highest on record.
- With EU, exports 9.8% yoy to USD 408.6B, imports rose 11.7% yoy to USD 273.4B.
- Trade surplus with EU rose 6.2% yoy to USD 135.1B.
- With Australia, exports rose 14.2% yoy to USD 47.3B, imports rose 11.2% to 105.45B.
- Trade deficit with Australia rose 8.9% yoy to USD 58.1B.
Link to China customs department data, in simplified Chinese.
UK PM May: Blocking Brexit will be catastrophic and unforgivable breach of trust in our democracy
Ahead of the Brexit meaningful vote on Tuesday, UK Prime Minister Theresa May said in an articles in Sunday Express that blocking Brexit would be a catastrophic and unforgivable breach of trust in our democracy". And she urged the Parliament to "forget the games and do what is right for our country."
May is also expected to warn in a speech today that "there are some in Westminster who would wish to delay or even stop Brexit and who will use every device available to them to do so". And, based on the evidence she recent saw, it's more likely for MPs to block Brexit than leaving EU with no deal. May will ask MPs to "consider the consequences of their actions on the faith of the British people in our democracy".
Separately, pro-EU Liberal Democrat leader Vince Cable said on Sunday that the parliament will act to stop no-deal Brexit from happening. Should May's deal be voted down, Cable said MPs would bring forward legislation to revoke Article 50. He added "that is exactly what we should be doing because it would be absolutely outrageous and unforgivable if the chaotic circumstances of a no deal were allowed to happen."
Labour leader Jeremy Corbyn told BBC TV that "my own view is that I would rather get a negotiated deal now, if we can, to stop the danger of a no-deal exit from the EU on the 29th of March which would be catastrophic for industry, catastrophic for trade."
GBP/USD Remains Buy On Dips And EURGBP Sell On Rallies
GBP/USD gained momentum recently and broke the 1.2750 and 1.2800 resistance levels. EUR/GBP declined heavily and broke the 0.8960 and 0.8950 supports.
Important Takeaways for GBP/USD and EUR/GBP
- The British Pound traded with a bullish bias recently and climbed above the 1.2800 barrier.
- There is a connecting resistance trend line in place at 1.2875 on the hourly chart of GBP/USD.
- EUR/GBP declined heavily and traded below the 0.9000 and 0.8960 support levels.
- There was a break below a major bullish trend line with support at 0.9025 on the hourly chart.
GBP/USD Technical Analysis
The British Pound started a solid upward move from the 1.2500 support area against the US Dollar. The GBP/USD pair climbed above the 1.2600 and 1.2750 resistance levels to move into a positive zone.
The pair even surged above the 1.2850 level and traded close to the 1.2870 level on FXOpen. A high was formed at 1.2865 and the pair is currently correcting lower. An initial support is near the 1.2825 level and the 23.6% Fib retracement level of the last wave from the 1.2710 low to 1.2865 high.
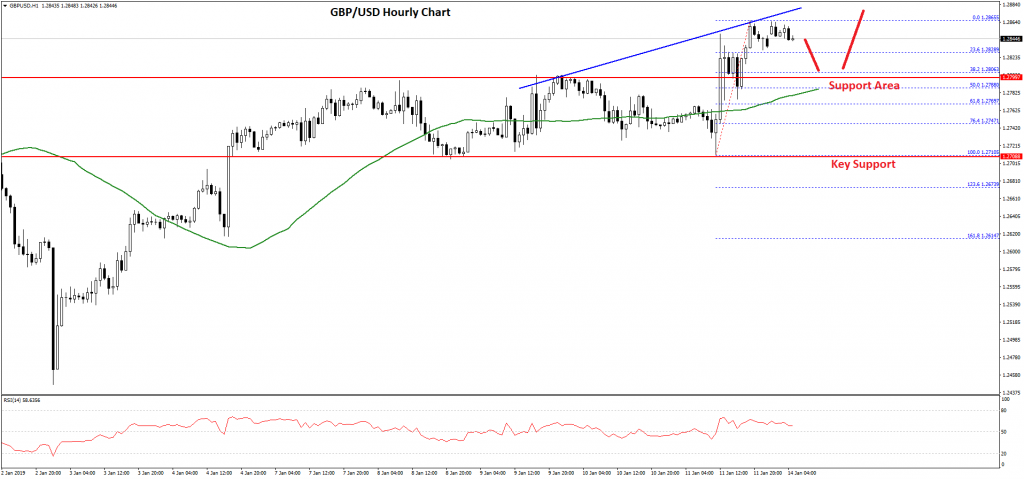
On the downside, there are many supports near the 1.2800, 1.2785 and 1.2750 levels. The main support is near the 50 hourly simple moving average and the 50% Fib retracement level of the last wave from the 1.2710 low to 1.2865 high near 1.2785.
If there is a break below the 50 hourly SMA, the price may decline towards the 1.2750 and 1.2720 support levels. On the upside, an initial resistance is near the recent high at 1.2865.
Moreover, there is a connecting resistance trend line in place at 1.2875 on the hourly chart of GBP/USD. A break above the trend line and 1.2880 could push the pair above the 1.2900 resistance in the coming sessions.
Overall, GBP/USD remains well supported on dips if there is a downside correction towards 1.2800 or 1.2785.
EUR/GBP Technical Analysis
The Euro failed on more than two occasions to break the 0.9060 resistance against the British Pound. As a result, the EUR/GBP pair started a major decline and broke the 0.9030 and 0.9000 support levels.
During the decline, there was a break below a major bullish trend line with support at 0.9025 on the hourly chart. The pair declined heavily and settled below the 0.9000 support and the 50 hourly simple moving average.
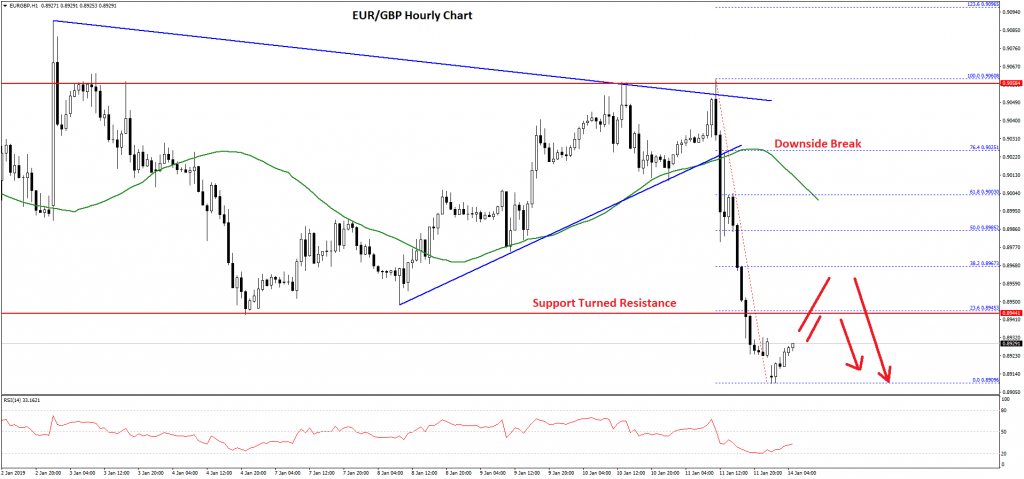
More importantly, the pair traded below the 0.8960 and 0.8945 support levels. A low was formed at 0.8909 and the pair is currently correcting higher. An initial resistance is near the previous support at 0.8945.
Besides, the 23.6% Fib retracement level of the recent decline from the 0.9060 high to 0.8909 low is also near the 0.8945 level to act as a solid resistance.
If there is a break above the 0.8945 and 0.8950 levels, the pair may recover towards the 0.8960 or 0.8985 resistance levels. The latter one is significant since it is the 50% Fib retracement level of the recent decline from the 0.9060 high to 0.8909 low.
Therefore, if the pair corrects higher towards 0.8945 or 0.8960, it is likely to face a strong selling interest in the near term.
EUR/USD Remains Supported Above 1.1420
Key Highlights
- The Euro traded towards 1.1570 and later corrected lower against the US Dollar.
- There was a break below a major bullish trend line with support at 1.1510 on the 4-hours chart of EUR/USD.
- The US CPI in Dec 2018 declined 0.1% (MoM), similar to the market forecast.
- The Euro Area Industrial Production for Nov 2018 will be released today, which could decline 1% (MoM).
EURUSD Technical Analysis
This past week, there was a steady recovery in the Euro above the 1.1500 resistance against the US Dollar. The EUR/USD pair even broke the 1.1550 resistance and later started a major downside correction.
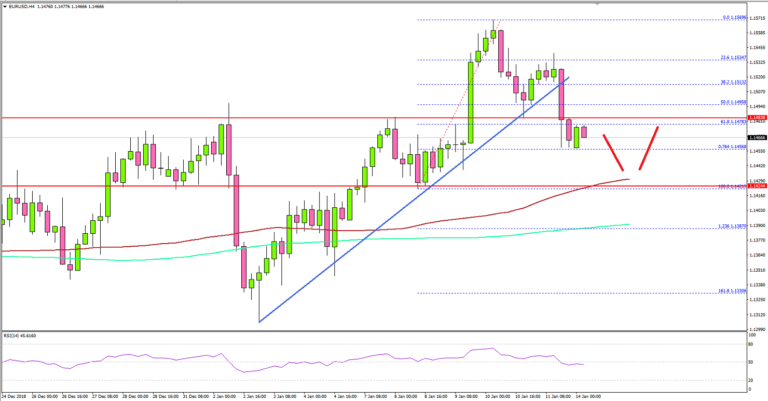
Looking at the 4-hours chart, the pair traded as high as 1.1596 before starting a downside correction. The pair declined below the 1.1550, 1.1520 and 1.1500 support levels. There was a break below the 50% Fib retracement level of the last wave from the 1.1421 low to 1.1569 high.
Besides, there was a break below a major bullish trend line with support at 1.1510 on the same chart. The pair is currently trading in a bearish zone and it seems like it could test the 1.1420 and 1.1410 support levels, which are near the 100 simple moving average (red, 4-hours).
If there is a break below the 1.1410 support, the pair may extend declines towards the 1.1385 level and the 1.236 Fib extension level of the last wave from the 1.1421 low to 1.1569 high.
On the flip side, if there is a fresh upward move, the pair could face sellers near the 1.1485 level. A break above the 1.1485 and 1.1500 resistances may perhaps spark a move towards 1.1550 and 1.1575.
Fundamentally, the US Consumer Price Index report for Dec 2018 was released by the US Bureau of Labor Statistics. The market was looking for a 0.1% decline in the CPI in Dec 2018 compared with the previous month.
The actual result was similar as there was a 0.1% decline in the CPI. The yearly change posted a 1.9% increase in Dec 2018, which was less than the last 2.2%. The report added that:
The seasonally adjusted decline in the all items index was caused by a sharp decrease in the gasoline index, which fell 7.5 percent in December. This decline more than offset increases in several indexes including shelter, food, and other energy components. The energy index fell 3.5 percent, as the gasoline and fuel oil indexes fell, but the indexes for natural gas and for electricity increased. The food index increased 0.4 percent in December.
Overall, the US Dollar could gain a few points in the short term, but pairs like EUR/USD and GBP/USD are likely to recover further.
Economic Releases to Watch Today
- Euro Zone Industrial Production for Nov 2018 (MoM) – Forecast -1.0%, versus +0.2% previous.
- Euro Zone Industrial Production for Nov 2018 (YoY) – Forecast -1.4%, versus +1.2% previous.
Market Morning Briefing: The Euro-Yen Continues To Trade Below 125.20
STOCKS
Our caution about Resistances near current levels, or just overhead, for the Dow (23995.95, -5.97, -0.02%) and DAX (10887.46, -34.13, -0.31%) in the near-term may have some merit.
Note the Moving Average Resistance at 24000 on the 3-day line chart on the Dow and the trendline Resistance near 11000-11050 on the Daily Candles on the DAX. Both could see near-term dips towards 23500 and 10800-700 respectively before moving up further later. A fall below 23500 and 10700, if seen, may trigger a deeper decline.
The Nikkei (20359.70, +0.97%) has been consolidative over the last few days. It is long-term bullish while above trendline Support at 19500 on the Weekly Line chart and dips are likely to be bought.
Unlike the Nikkei, which does not seem to have any immediate Resistance, the Shanghai (2539.33, -0.57%) may have a near-term trendline Resistance on the Weekly Candles, which may/ may not be broken this week.
The Sensex (36009.84) and Nifty (10794.95) look a little mixed in the near-term and might/ might not produce a near-term dip, which might well get bought for the longer term.
COMMODITIES
Precious metals look bearish for the near term but could see a few sessions of sideways trade before falling sharply. Crude is set for a corrective dip. Copper could move up after a small period of ranged movement.
Brent (60.28) and Nymex WTI (51.40) have dipped a bit. Immediate resistance near 62.50 on Brent and 54 n WTI seem to be holding for now. While 62.50 and 54 holds, the prices could come off towards 58 and 50 respectively. A corrective dip could be in place for the coming sessions.
Gold (1292.60) and Silver (15.68) are stable. While above 1280, Gold has some scope of trading sideways within 1280-1300 region for a few more sessions. 1300-1320 is an important resistance zone for Gold in the near term and is likely to hold, pushing back the price to levels below 1280 soon. Silver is also ranged within 15.50-16.00 region and may trade sideways for the next 1-2 sessions before a sharp move on either side of the range is seen. Overall bias is towards the downside for the medium term.
Copper (2.6565) has some scope of rising towards 2.70/75 in the near term. Near term looks bullish.
FOREX
Euro (1.1469) is coming off 1.1570 while immediate resistance near 1.16 seems to be holding well. A test of 1.14 is possible in the near term. On the daily candles, the broad 1.16-1.1350 zone seems to be holding well. Near term looks bearish.
Dollar Index (95.62) is holding above 95 and could try to move up towards 96.50 again in the next few sessions. An eventual break above 98, if seen and sustains would turn bullish for the index in the longer run.
The Euro-Yen (124.04) continues to trade below 125.20 and while that holds, the pair has potential to move down further towards 123.00-122.80 in the near term. View is tilted to the downside just now.
Dollar Yen (108.19) is stable just now. While above 107, the pair looks bullish. Some sideways trade could be a possibility for the near term.
Pound (1.2844) has moved up sharply breaking above our expected resistance near 1.28. This rise above 1.28 if sustains could take Pound towards 1.30/31 in the near to medium term. View is bullish.
Aussie (0.7186) is heading towards the 3-day candle resistance near 0.73 before coming off from there. Near term looks potentially bullish.
USD-CNY (6.7523) has fallen sharply and looks strongly bearish. A pause could be seen near 6.70/68 levels from where a decent bounce could be expected. Near term looks strong for the Yuan.
Dollar Rupee (70.4950) could test 70.20 on the downside while it could be capped near 70.60/80 on the upside. 70.80 could eventually push the pair towards 70 in the near term.
INTEREST RATES
Friday saw a slight dip in US Yields (2Yr 2.54% down from 2.56%, 5Yr 2.53% down from 2.55%, 10Yr 2.70% down from 2.73% and 30Yr 3.02% down from 3.05%) on Friday. They seem to be consolidating sideways over the last few days. Now we are not very sure if they are likely to move up or down over the medium term. we need to watch the movement over the next few days for directional ideas.
As mentioned on Friday, keep an eye on the US-Japan 10Yr Spread (2.70%) which could be bouncing off a long-term Support trendline coming up from 1.62% in 2016. A further rise here could help pull Dollar-Yen higher.
The 10Yr GOI (7.5030%) moved up again on Friday after a small dip to 7.47% ealier in the week. we are not too sure of near term direction and have to stand back and see how the market evolves.
Daily Markets Broadcast
Wall Street steadies after a strong week
US indices consolidated a bullish week on Friday, though the ongoing US government shutdown capped sentiment. A Japan holiday today could impact liquidity in the Asian session. China releases trade data for December, which could dictate near-term direction.
US30USD Daily Chart
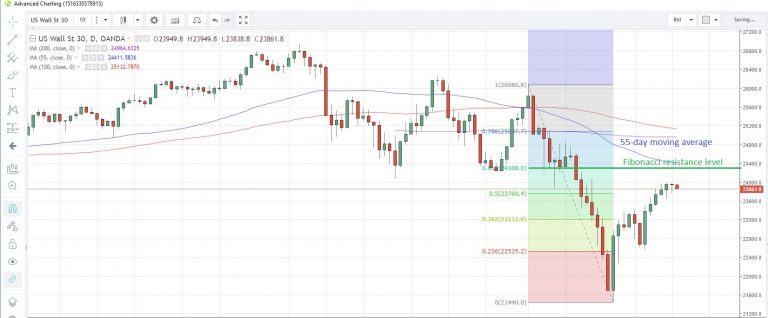
The US30 index posted its biggest weekly gain since late-November last week, buoyed by a dovish shift from the Fed
The 61.8% Fibonacci retracement of December’s drop is at 24,308, while the 55-day moving average has edged lower to 24,411
US consumer prices matched expectations in December, falling 0.1% m/m, the first decline in nine months. There are no major data releases today but markets will be keeping an eye on the US government shutdown situation.
DE30EUR Daily Chart
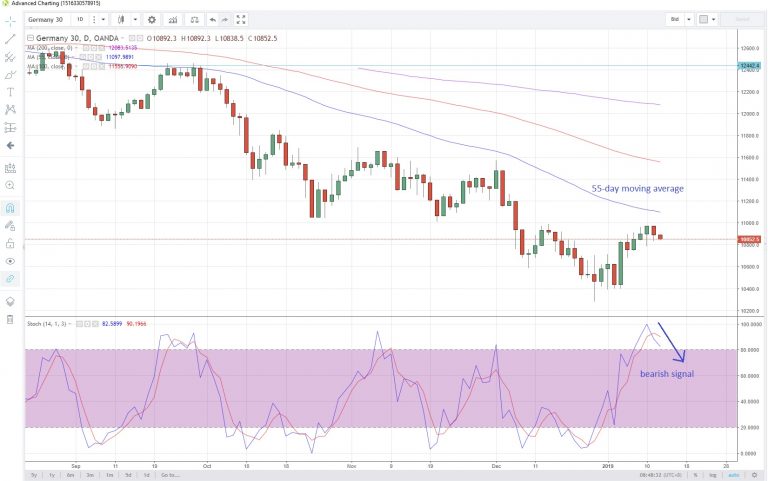
The Germany30 index snapped a three-day winning streak on Friday as the UK’s looming parliamentary Brexit vote (tomorrow) dented sentiment
The 55-day moving average at 11,098 looks as if it might continue to cap the recent upmove, as the slow stochastics momentum indicator turns bearish
Euro-zone industrial production data for November is due today. It’s expected to decline 1.0% m/m and a worse number could suggest a near-term top is in place for German equities.
CN50USD Daily Chart
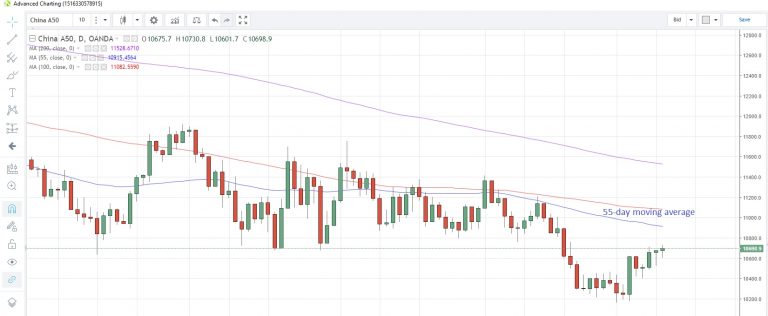
China shares rose four out of five days last week, the third weekly advance in a row, as trade talk hopes increased
The 55-day moving average is at 10,916. The index has traded below this average since December 13
China’s trade data for December are due today. Imports are expected to increase to 5.0% y/y from +3.0% in November, while export growth is seen slowing to +3.0% from +5.4%.