Sample Category Title
USD/CAD Set For Breakout
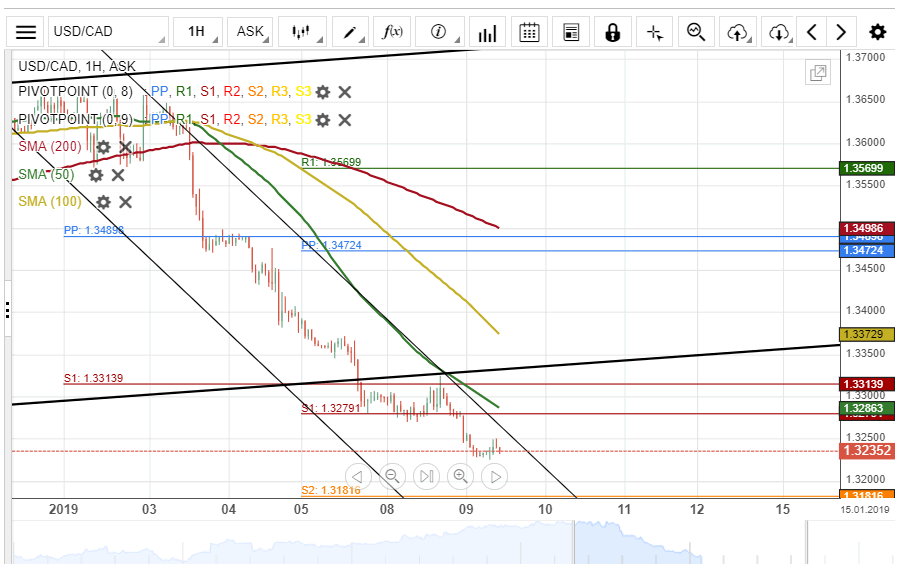
The US Dollar edged lower about 78 base points against the Canadian Dollar on Tuesday. The currency pair dashed through a support cluster at 1.3279 during the previous trading session.
The exchange rate is trading near the upper boundary of a descending channel pattern at 1.3241 during the middle of the European trading session on Wednesday and could be set for a breakout.
If this breakout occurs, the USD/CAD currency exchange rate will target the 50-hour simple moving average at 1.3290 during the following trading session.
NZD/USD Likely To Maintain Channel
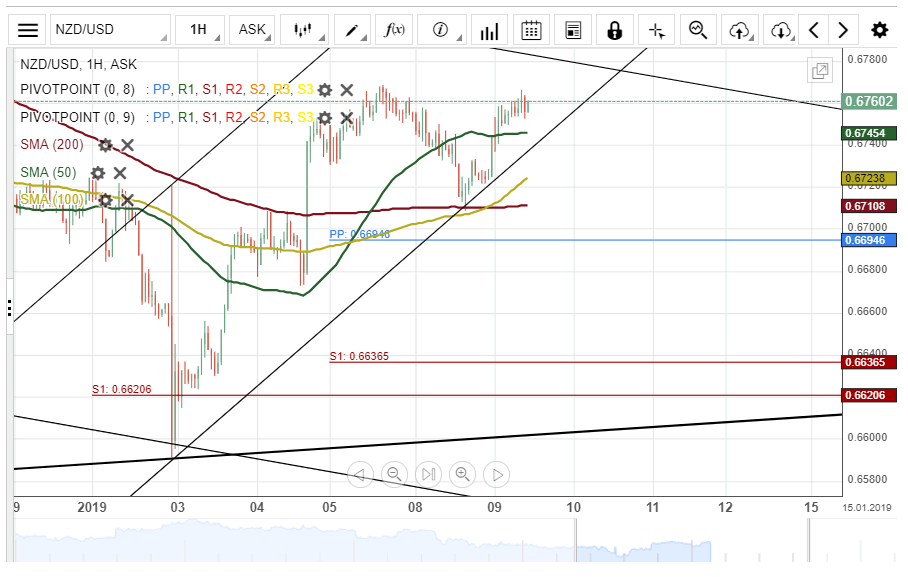
The New Zealand Dollar appreciated about 50 base points against the US Dollar on Tuesday. The currency pair breached the 50-hour simple moving average at 0.6745 during the end of Tuesday's trading session.
As for the near future, it is likely that the NZD/USD exchange rate will maintain the junior ascending channel.
The potential upside targets for the currency exchange rate will be near a resistance level formed by the combination of the weekly and the monthly pivot points at 0.6795.
Meanwhile, technical indicators flash bullish signals on the 4(H) time frame chart.
EUR/USD Aims At 1.1500 Level
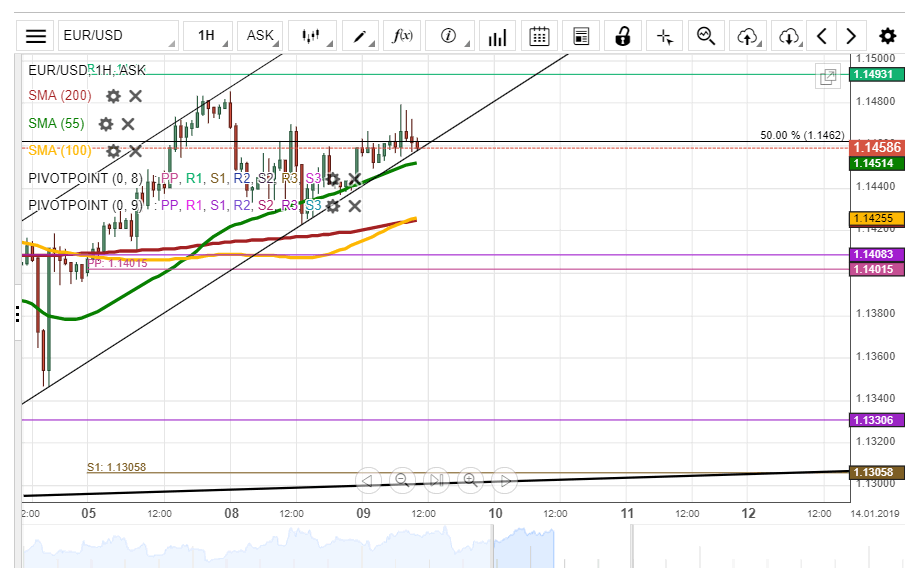
During Wednesday morning hours, the European Single Currency broke the resistance of the 50.00% Fibonacci retracement level at the 1.1465 mark to trade towards the weekly R1 at the 1.1493 mark.
Most likely, the currency exchange rate will continue the uptrend towards the 1.1500 level. The 55-hour simple moving average and the bottom boundary of the ascending pattern line at the 1.1460 mark should support the rate during the day.
On the other hand, today's US FOMC Meeting Minutes at 19:00 GMT could push the European Single Currency to depreciate against the US Dollar to the 1.1420 level.
GBP/USD Remains At 1.2750 Level
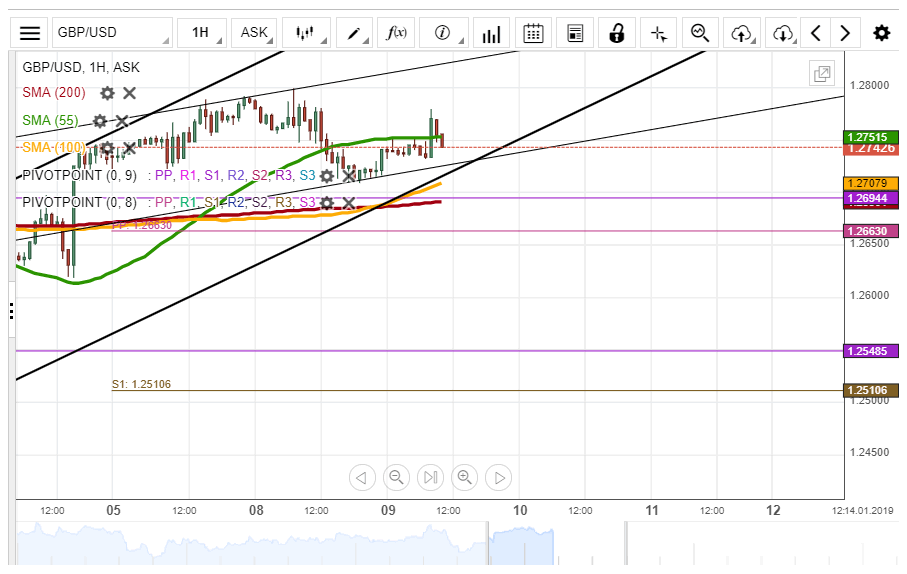
During the previous trading session, the British Pound was resisted by the 55-hour simple moving average to push the rate towards the 1.2700 level.
On Wednesday, the currency exchange rate tried to break the resistance level of the 55-hour simple moving average to trade above the 1.2751 mark.
In regards to the near-term future, most likely, the rate will get retraced by the bottom boundary of the medium pattern line at the 1.2750 mark to push the rate to the 1.2750 level.
However, the British Pound could depreciate against the US Dollar during today's US FOMC Meeting Minutes at 19:00 GMT to trade at the 1.2650 level.
USD/JPY Will Depreciate To 38.20% Fibo
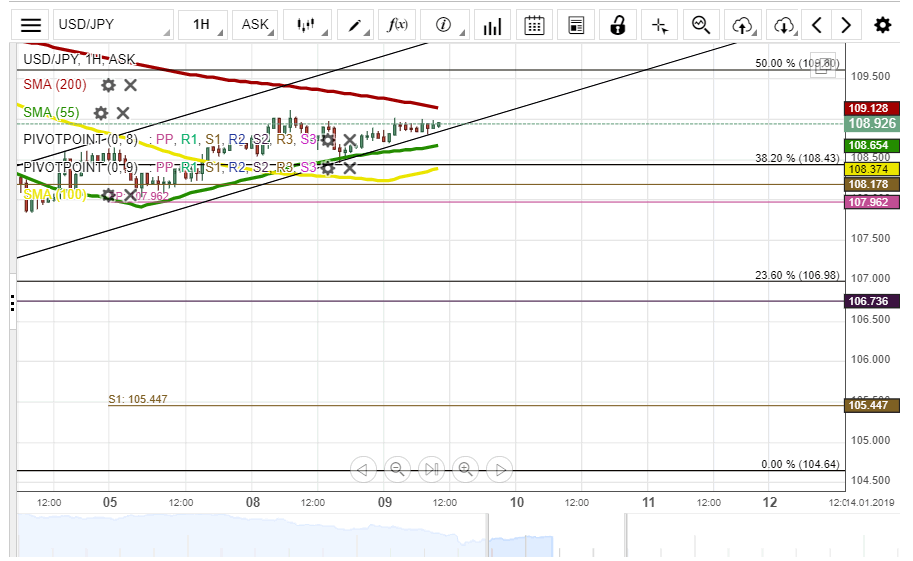
On Wednesday, the USD/JPY was trading between the 200-hour and the 55-hour simple moving averages at the 108.84 mark. Meanwhile, the 55-hour simple moving average was supporting the rate to remain the rate at the 108.50 level during the previous trading day.
It is expected that the US Dollar will depreciate against the Japanese Yen to trade near the 38.20% Fibonacci retracement level at the 108.43 mark.
However, the situation might change during today's US FOMC Meeting Minutes at 19:00 GMT which could push the US Dollar to appreciate against the Japanese Yen to the 109.50 level.
Eurozone unemployment rate dropped to 7.9%, lowest since Oct 2008
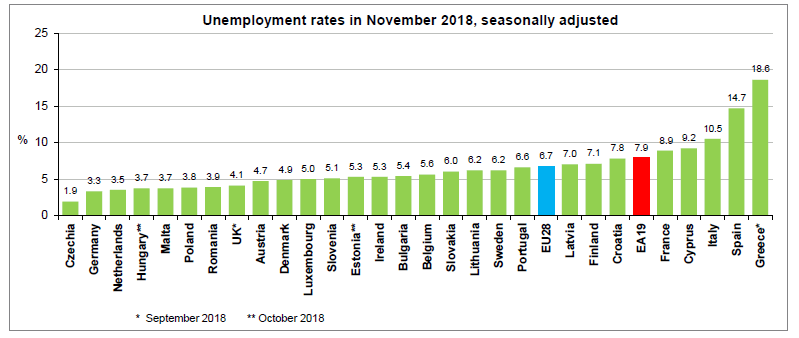
Eurozone unemployment rate dropped to 7.9% in November, lower than expectation of 8.1%. That's notable improvement from 8.7% back in November 2017. It's also the lowest figure since October 2008.
Among the Member States, the lowest unemployment rates in November 2018 were recorded in Czechia (1.9%), Germany (3.3%) and the Netherlands (3.5%). The highest unemployment rates were observed in Greece (18.6% in September 2018) and Spain (14.7%).
XAU/USD Depreciates To 1,275.00
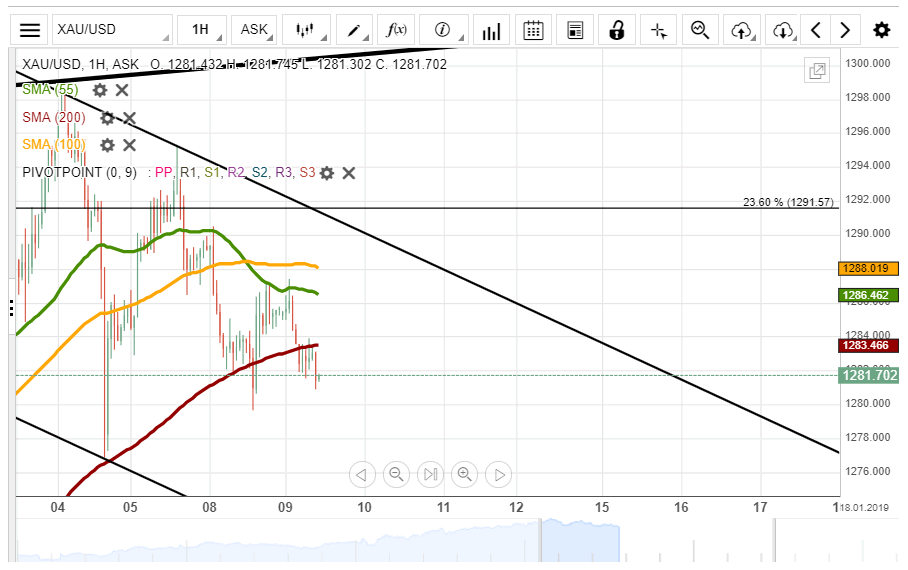
During Wednesday morning hours, the yellow metal was resisted by the 200-hour simple moving average to push the gold to the 1,283.23 mark.
Most likely, the XAU/USD will be trading bellow the resistance level of the 200-hour simple moving average at the 1,275.00 level during the trading session.
However, the gold might appreciate against the US Dollar during today's US FOMC Meeting Minutes at 19:00 GMT to push the yellow metal to break through the resistance level. Watch out for the fundamental!
EUR/JPY Likely To Trade Sideways Today
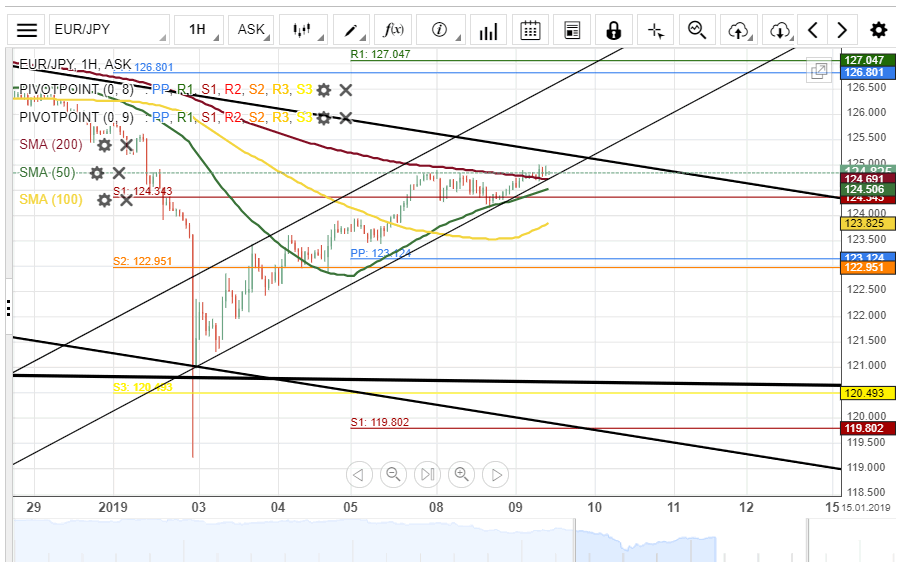
The common European currency traded with low volatility against the Japanese Yen on Tuesday. The currency pair was bouncing between the 50– and 200-hour SMAs during yesterday's trading session.
The exchange rate breached the 200-hour simple moving average at 124.70 during the middle of Wednesday's trading session.
It is likely that the currency exchange rate will continue moving in a narrow ascending channel during the following trading session.
Furthermore, technical indicators demonstrate that the EUR/JPY pair could continue to trade sideways today.
AUD/USD Continues To Trade Sideways
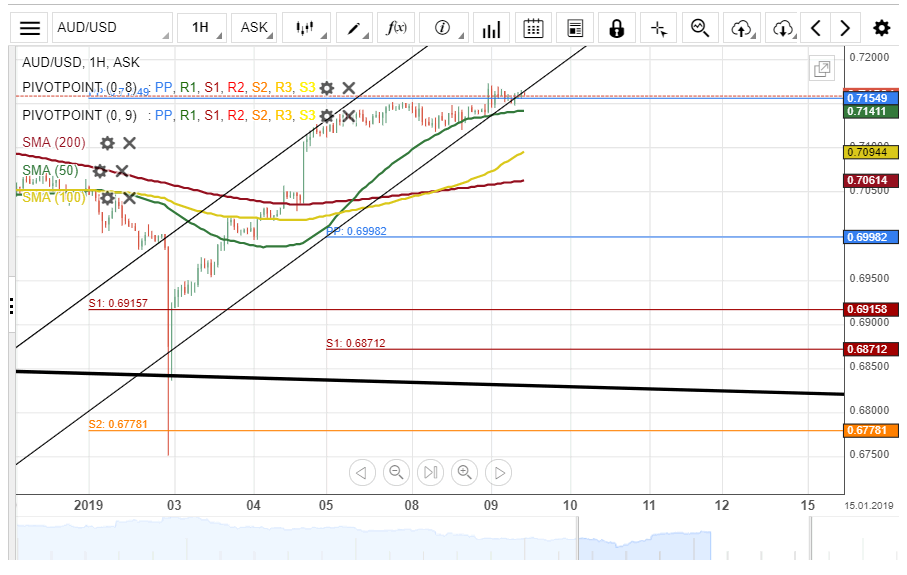
The Australian Dollar has continued to trade sideways against the US Dollar. The AUD/USD currency pair was moving within a range of 40 pips during Tuesday's trading session. The 50-hour simple moving average continued to provide support for the exchange rate at 0.7140. If this 50-hour SMA continues to hold, the currency exchange rate might increase its trading range today. However. If the price passes the 50-hour SMA, a decline towards the 100– and 200-hour SMAs at 0.7060 is a possibility.
ECB Research: Guns (And Not Bazookas) Dominate ECB’s Crisis Arsenal
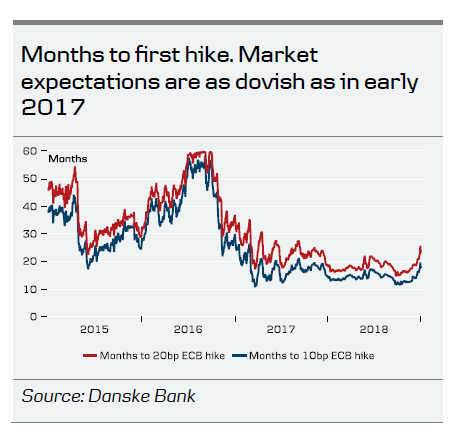
The ECB's outlook has been taken a beating recently from a moderation in both euro-area growth indicators and the spill over from global indicators. Consequently, markets have repriced the ECB to indicate a 20bp hike in 23 months' time only. The first rate hike is now priced as dovishly as in early 2017. We find it troubling that markets have such low expectations given that the economic environment and outlook are significantly different now than two years ago and, furthermore, given that the softer data at the end of the year/early start of the new year was warranted.
At the same time, the inflation curve has bull flattened, with the 2Y2Y inflation swap at 1.15% and the 5Y5Y inflation swap at 1.56%, which are both at their lowest levels for around two years. Naturally, the question arises: is the ECB behind the curve already, with just one policy-tightening step of ending QE net purchases on a strong euro area expansion? What can the ECB do in a global or euro area slowdown to stimulate the economy? This piece does not reflect our baseline views (read more in Euro area - Darker clouds on the horizon, 11 December 2018), but considers what the ECB might do if the economic outlook continues to deteriorate, i.e. if the moderation is structural and core inflation fails to pick up this year as we expect.
Economics is not physics…
In the field of physics, people agree on certain fundamentals, such as if an apple falls from a tree, gravity will pull it towards the item with the bigger mass, which in this case is the centre of the earth. However, such rules do not exist when it comes to economic developments and, in particular, inflation dynamics.
…and there is a risk core inflation will not pick up at historical pace
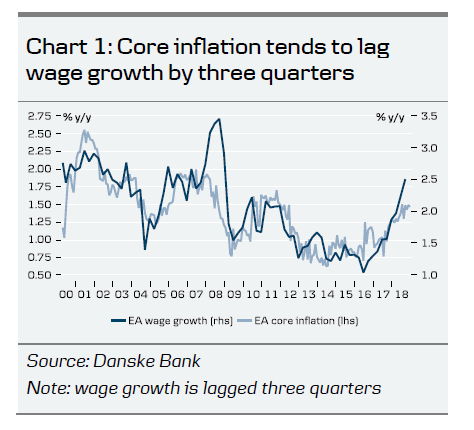
In Q3 18, we saw euro area wage growth at its strongest level in 10 years at 2.5%. In Chart 1, we show the historical relationship, indicating around a three quarter lag between wage growth and core inflation (in Interview with Handelsblatt, 23 November 2018, ECB Chief Economist Peter Praet indicated 6-12 months), but what if this time is different and the pass-through is longer than that? Or if the economic outlook is perceived to be so fragile that companies will not pass on the higher labour costs to consumers (generating inflation), but would rather compress their margins? In that scenario, the ECB could very well go into easing mode again before actually starting normalising policy rates. This is the main risk to our 20bp rate hike call in December 2019. We discussed our inflation outlook in Euro Area Research: Is the Phillips curve finally coming alive in 2019?, 18 December 2018.
Step 1 – longer-term liquidity operation
The first TLTROII operations will have a residual maturity falling below one year this summer, which may lead to a liquidity squeeze for certain euro area banks within a few months. Therefore, we expect it to be quite certain that the ECB will have another longerterm liquidity operation, which we expect to be announced in March and implemented in June ahead of the implementation of the new NSFR in July 2019
Step 2 – postpone the guidance on the first rate hike
The first easy choice indicating a change in policy direction is a postponement of the first rate hike beyond the current ‘at least through the summer of 2019' language from the ECB. The ECB has been doing forward guidance in recent years, and so stronger guidance is not a new phenomenon or politically difficult to do. However, with the US slowing down and China likewise, a significant postponement of an ECB hike guidance could well also mean that the ECB will not be able to hike in this cycle – leaving less room for manoeuvre in a future recession.
However, markets have already re-priced ECB expectations and this measure would be likely to have a limited impact. If the next step were communicated as a cut, however, a marked impact should be expected.
Step 3 – commit to reinvesting maturing bonds
The ECB has already communicated its intention to reinvest the principal in full of the maturing securities for an ‘extended period of time past the date when we start raising the key ECB interest rates and in any case for a long as necessary'. If step 2 were communicated to delay the first rate hike, this would also lead to a commitment to reinvest the principal of maturing securities for a very long time. We expect a gradual balance sheet reduction only after the changes to the policy rates, as communicated by Mario Draghi already.
Step 4 – restart QE with the capital key but with new limits and potentially enter into new asset classes (such as ETF/equities)
A natural measure to take on a deteriorating economic situation, after delaying the first rate hike, may be restating QE. Admittedly, we see the threshold to restart QE as high, but given the self-imposed ISIN limit binding certain countries already, such a restart would also include relaxing some of the ISIN/issuer restrictions. We expect purchases to be done according to the new capital key.
A restart of net asset purchases may also entail the ECB entering into riskier assets to give the measure a bigger boost (such as ETFs or equities). If not, the effect of restarting QE may not be as powerful as the ECB would like to think, as it already holds a large chunk of the EGB universe. However, the more significant market effect would come from the strong forward guidance/commitment.
A move into ETFs/equities is not unprecedented in central banking history, but entering into them would mark a significant step closer to a Japanese scenario (the Bank of Japan (BoJ) started buying its first ETFs in October 2010). The ECB has not ruled out riskier assets. In December 2014, when the ECB discussed starting QE, Draghi said that ‘we discussed all assets but gold', while more recently, board member Benoit Coeuré suggested that depending upon the nature of the crisis, rate cuts or purchases of riskier assets than public or corporate debt could be warranted. Similar wording has also been shared by Draghi recently.
Restarting QE would not have the ‘bazooka effect' it had in 2014/15, so it would have to be coupled with a new asset class. However, buying equities will not help the euro area economy much given that the biggest effect would be observed for financial market participants and only to a lesser degree the average consumer in the euro area. It could lead to a weaker euro due to the entailed balance sheet expansion.
Step 5 – cut rates further into negative territory
As we gradually progress into the policy tools less likely to be implemented, we also have to acknowledge that some of the measures historically have shown a diminishing return relative to the effectiveness, compared to the political resistance to it. A rate cut into further negative territory falls into this category.
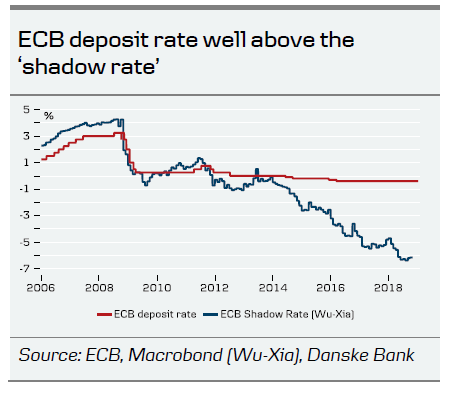
When the ECB cut rates into negative territory, it communicated its effective lower bound of -20bp on the deposit rate. Nevertheless, it cut the deposit rate by 10bp twice. Since then – see also the comment by Benoit Coeuré above – the view of the ECB's governing council has changed and further cuts into negative territory cannot be ruled out. However, we find it less likely than restarting QE. Furthermore, we find the effectiveness in terms of stimulating the economy through cuts to be rather limited. Academic research indicates that the ‘real' policy rate (the so-called ‘shadow rate') is at -6.2% already.
Step 6 – enter into riskier assets (ETF/equities)
We discussed a potential move into a new asset class in step four. However, we highlight here that we find it more likely that the ECB would enter into new asset classes after a rate cut. Entering into a new asset class is a significant step into crisis mode and would entail even higher barriers to cross than just restarting QE in the existing asset classes.
Step 7 – yield curve cap and deviating from the capital key
Introducing a cap on the European government bond (EGB) yields would be a serious step one into ‘full-scale' BoJ crisis mode. Such a measure is unlikely to be a complete mirror of the BoJ's yield curve control, where it targets a specific level/range on the 10Y JGB. However, given that the ECB is a central bank for 19 individual member states (most of them with individual yield curves), specifying a target for each country would also mean that the ECB would define and control the risk premium attached to each sovereign, which in turn could spark moral hazard behaviour from governments. Therefore, we believe the yield curve target for each member state would be contrary to TFEU Article 123 (monetary financing of member states).
The ECB could still take control of the yield curve for governments to a greater extent than QE (step four) by introducing a yield curve cap. Such a cap would imply that the ECB ensured that all yields on EGBs would be below a specific level. In order to carry out such a measure, the ECB would have to deviate from the foundation of the currency union, namely the capital key. Such a move would be highly effective in the markets and ensure favourable financing conditions across the euro area. That said, such a measure could also be in breach of Article 123.
Step 8 – helicopter money
Helicopter money has long been an academic exercise, which in principle should boost euro area demand and in turn spur growth. However, political resistance to giving money to euro area inhabitants is very high, and despite the ECB technically being able to ‘sterilise' the measure, resistance to it would be very high indeed. Helicopter money is the last and, in our view, least likely (but also very effective) bullet in the ECB's arsenal.
Step 9 – change the target
We expect the ECB to do ‘whatever it takes' to preserve the euro, also with a new ECB President, despite this not being certain (Draghi is due to step down from his position as ECB President in October this year). The market impact of the ECB changing target is ambiguous. It could be perceived as the ECB ‘giving up' on getting inflation ‘close to, but below, 2%' or entailing a larger commitment to do even more to boost growth/inflation, such as including an employment measure.
However, there are difficulties attached to changing the target. The treaty only specifies price stability as the mandate of the ECB, so within that interpretation, the 25 ECB governing council members can themselves decide on how to implement that. If the new target is not within that interpretation, a treaty change is likely to be needed and that would not be an easy fix, given the need for governments to agree on it.