Sample Category Title
GBPUSD Bulls Need To Break 1.2810 Level
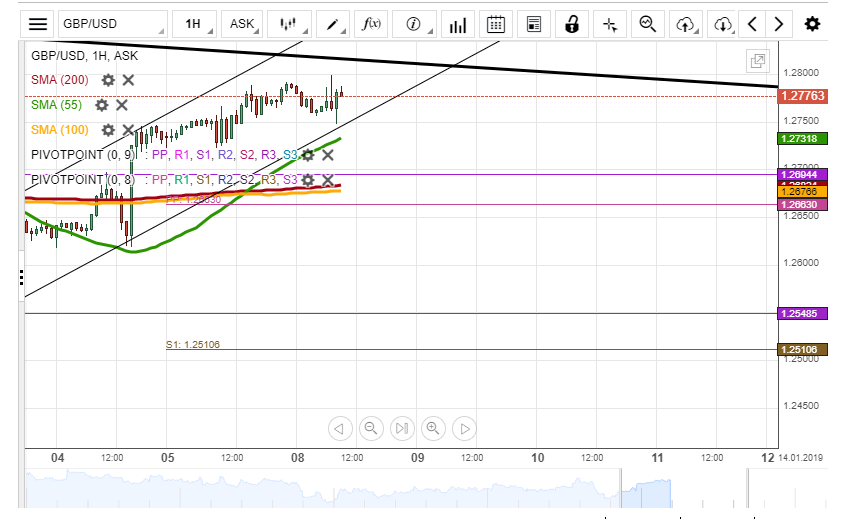
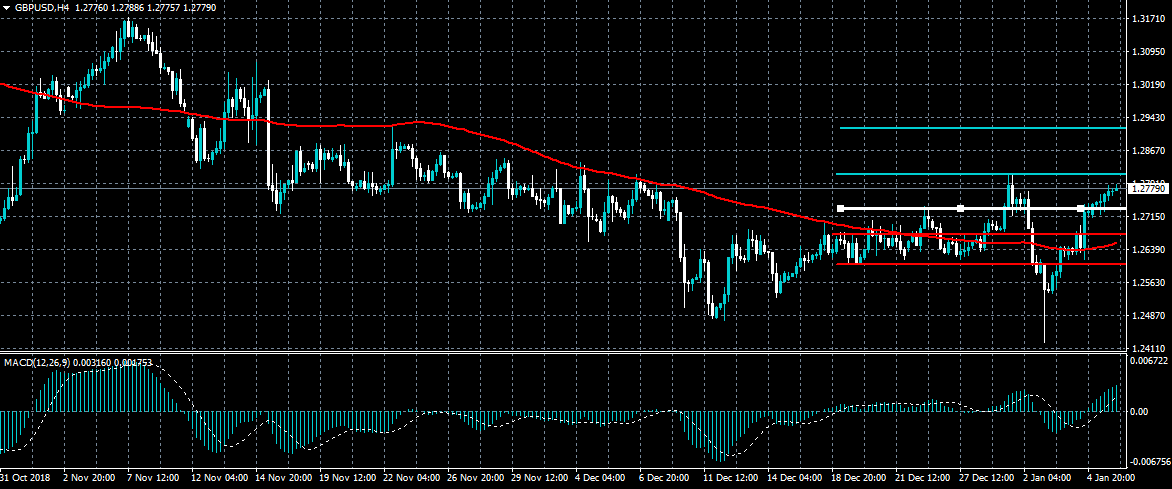
The British pound continues to edge higher against the US dollar in early Tuesday trade, as buyers test towards the 1.2800 resistance level. If buyers can break above the 1.2810 resistance level, the GBPUSD pair could eventually rally towards the 1.2930 level. Technical failure before the 1.2810 resistance level will likely trigger heavy selling back towards the 1.2660 level.
The GBPUSD pair is only intraday bullish while trading above the 1.2740 level, key technical resistance is now found at the 1.2810 and 1.2850 levels.
If the GBPUSD pair trades under the 1.2740 level, sellers are likely to test the 1.2700 and 1.2660 levels.
The Analytical Overview Of The Main Currency Pairs
The EUR/USD currency pair
Technical indicators of the currency pair:
Prev Open: 1.13955
Open: 1.14738
% chg. over the last day: +0.60
Day's range: 1.14322 – 1.14844
52 wk range: 1.1214 – 1.2557
Yesterday the US dollar was weakened against the basket of major currencies. The quotes grew by 80 points. Jerome Powell, the Head of Federal Reserve, mentioned that the further rates of the interest rate growth will be determined by the future reports and the world economy. The pressure on the USD is caused by the weak business activity data in the non-industry economic sector. The EUR/USD is consolidating around 1.14300-1.14600, you should open positions from these levels.
The Economic News Feed for 08.01.2019:
Trading Balance Report (US) – 15:30 (GMT+2:00);
Job Openings and Labor Turnover Survey (US) – 17:00 (GMT+2:00);
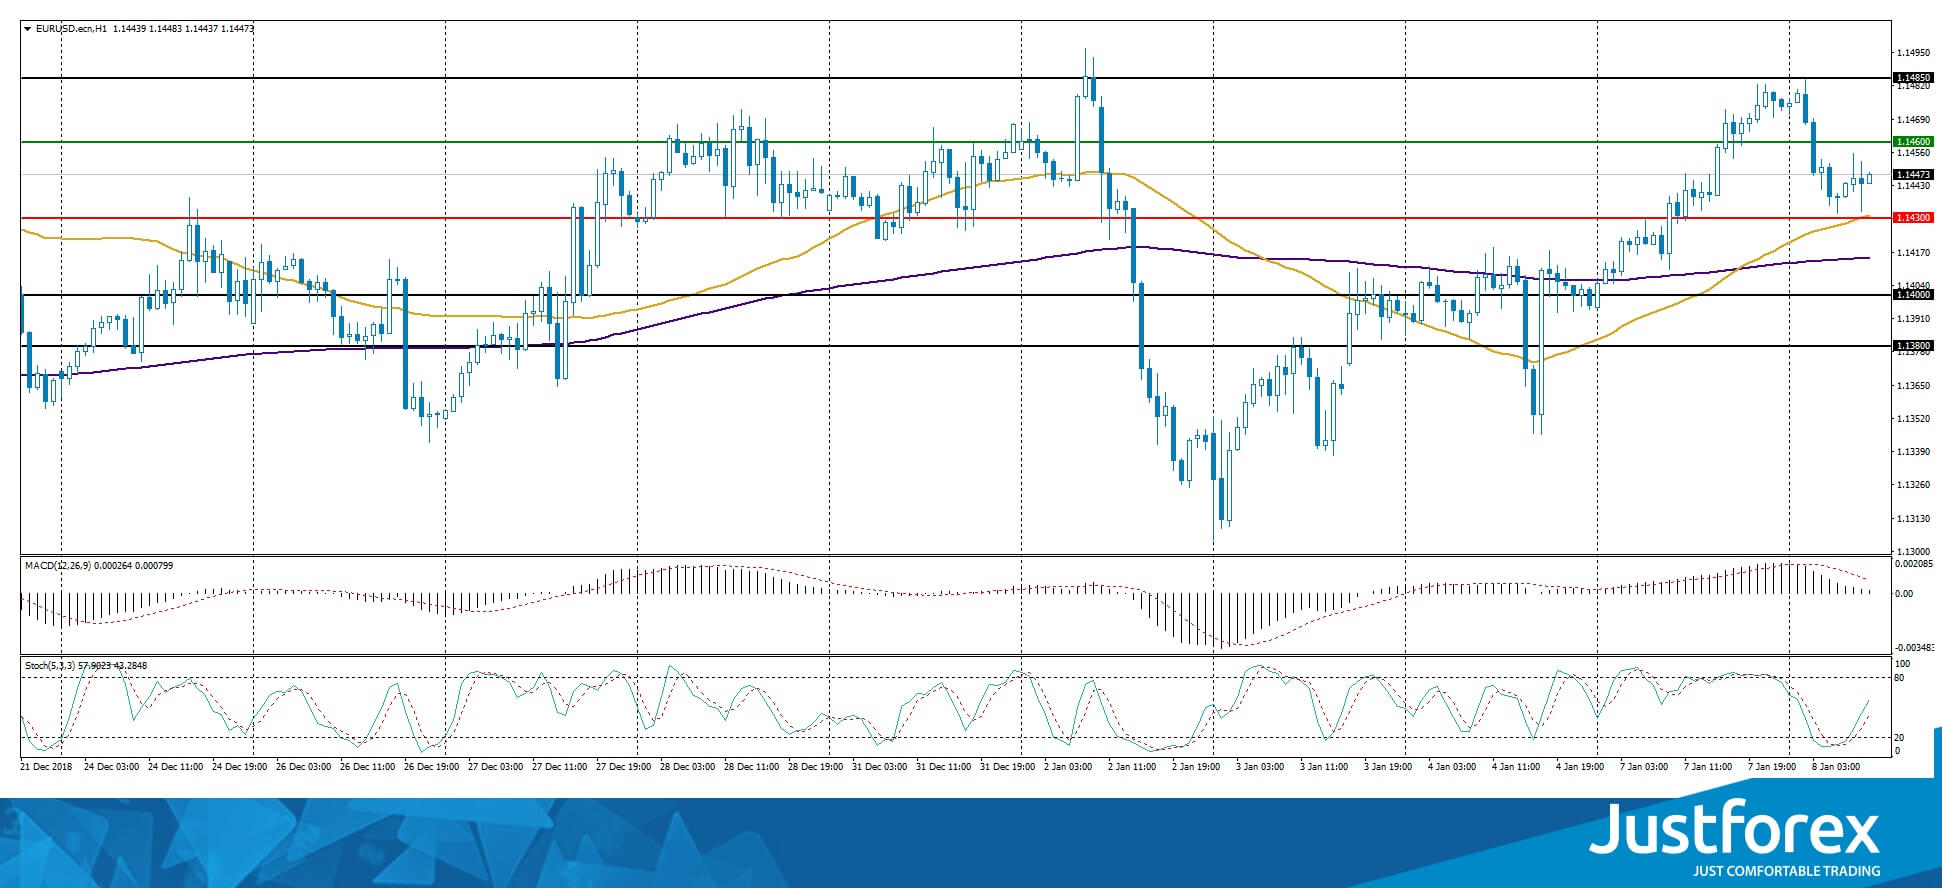
The price fixed above 50 MA and 200 MA, which points toward the power of the buyers.
The MACD histogram is around 0. There are no signals at the moment.
The Stochastic Oscillator is in the neutral zone, the %K line is above the %D line, which gives a signal to buy EUR/USD.
Trading recommendations
Support levels: 1.14300, 1.14000, 1.13800
Resistance levels: 1.14600, 1.14850, 1.15000
If the price fixes above 1.14600 expect further growth toward 1.14850-1.15000.
Alternatively the quotes can correct toward 1.14000.
The GBP/USD currency pair
Technical indicators of the currency pair:
Prev Open: 1.27152
Open: 1.27767
% chg. over the last day: +0.42
Day's range: 1.27459 – 1.27971
52 wk range: 1.2438 – 1.4378
GBP/USD recovered the majority of its losses after a sharp decline in the beginning of the month. The pound is being traded in a flat. The quotes are testing the local support and resistance levels at 1.27350 and 1.27900 and have further growth prospects. Investors are waiting for new data on Brexit. Positions should be opened from the key levels.
The Economic News Feed for 08.01.2019 is calm.
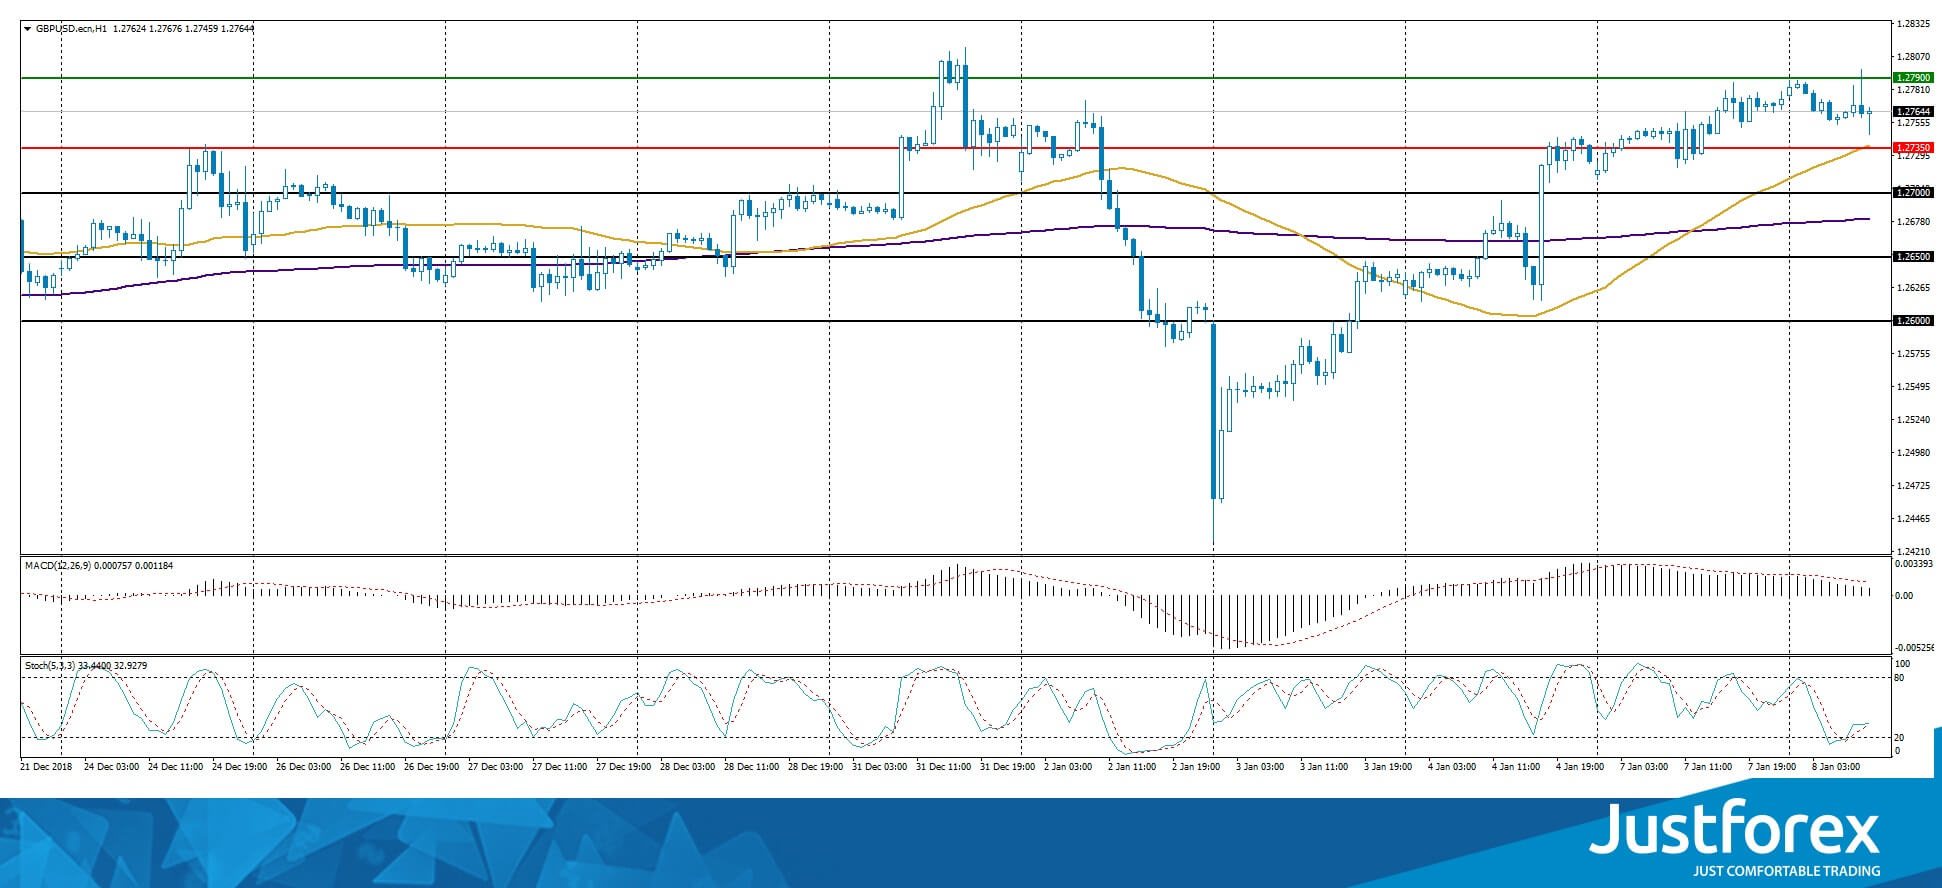
The indicators do not provide precise signals, the price has crossed 50 MA and 200 MA.
The MACD histogram is in the positive zone and keeps rising, which points toward a bullish sentiment.
The Stochastic Oscillator is in the neutral zone, the %K line is crossing the %D line. There are no precise signals.
Trading recommendations
Support levels: 1.26000, 1.25400, 1.25000
Resistance levels: 1.26500, 1.27000, 1.27350
If the price fixes above 1.26500, expect the further correction of the GBP/USD toward 1.27000-1.27400.
Alternatively the quotes can correct toward 1.25500-1.25000.
The USD/CAD currency pair
Technical indicators of the currency pair:
Prev Open: 1.35840
Open: 1.34850
% chg. over the last day: -1.14
Day's range: 1.34449 – 1.34956
52 wk range: 1.2248 – 1.3664
USD/CAD is showing an aggressive sell-off. During the last two days, the quotes have fallen by 130 points. The CAD has updated the local minimums despite being supported by the positive oil quotes trend. The key range is 1.34450-1.34850, you should open the positions from these levels. The currency pair has prospects for further descend, based on the Labour Market reports for US and Canada.
At 15:30 (GMT+2:00) Canada will publish the Labour Market report.
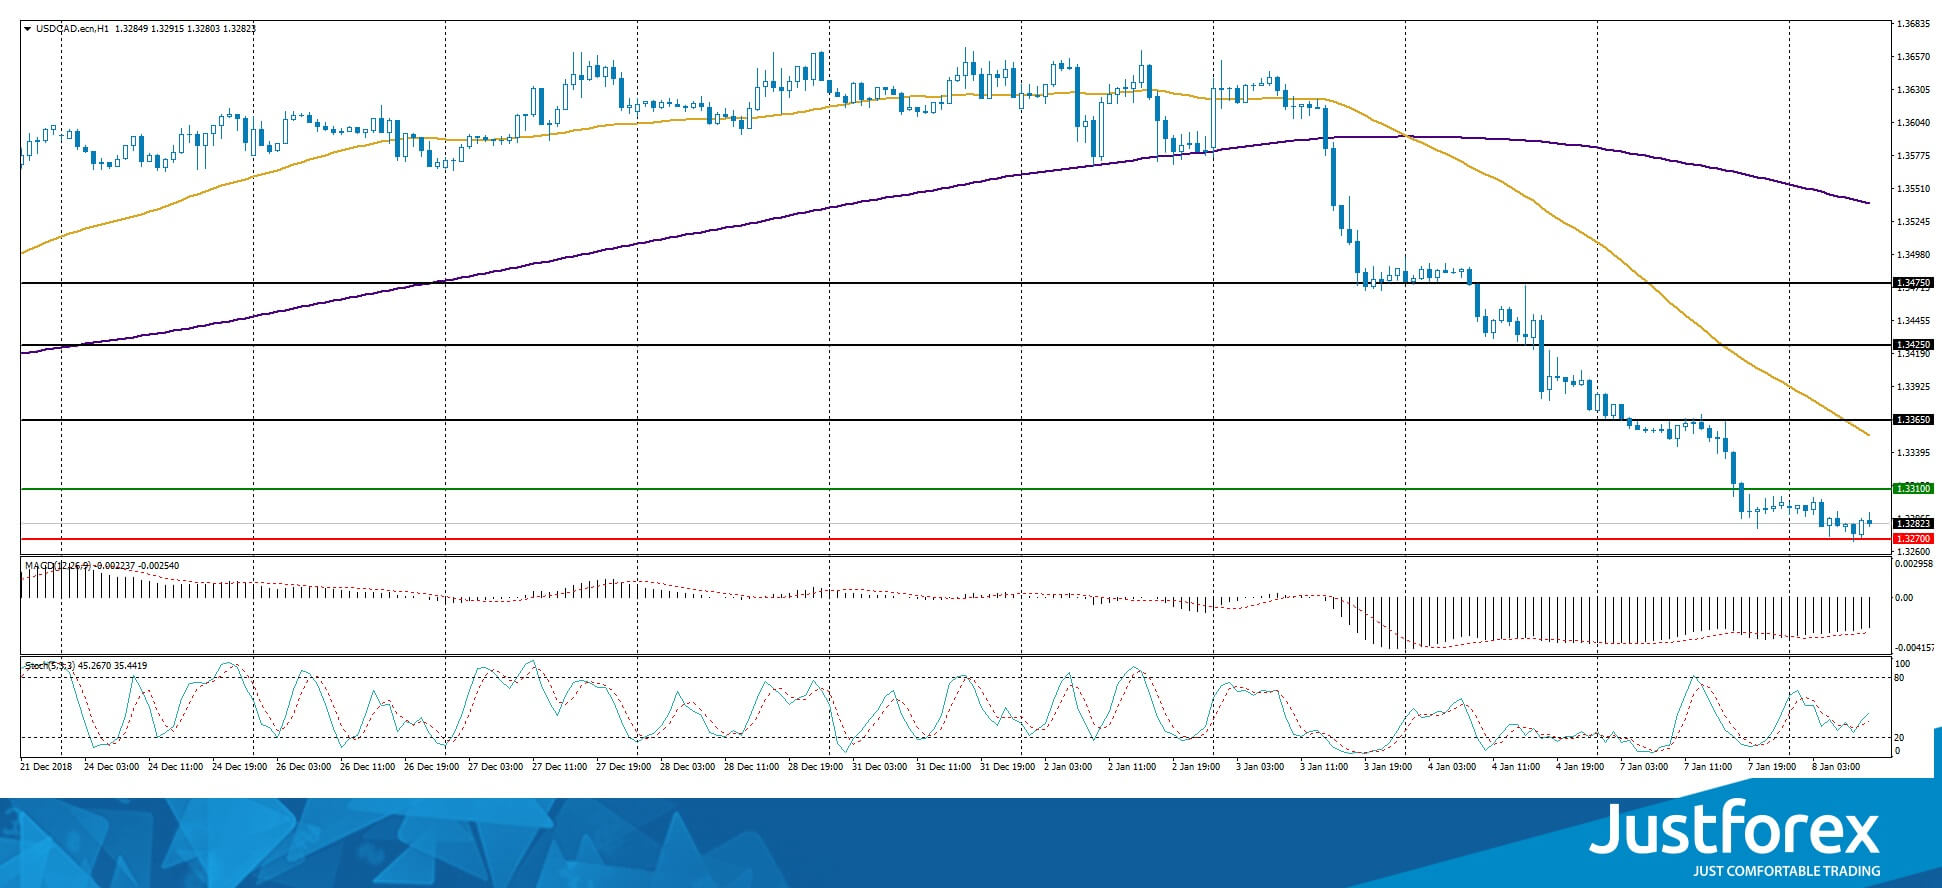
The price fixed below 50 MA and 200 MA which shows the power of the sellers.
The MACD histogram is in the negative zone but above the signal line which gives a weak signal to sell USD/CAD.
The Stochastic Oscillator is around the %K line is above the %D line, which indicates a bullish sentiment.
Trading recommendations
Support levels: 1.32700, 1.32400
Resistance levels: 1.33100, 1.33650, 1.34250
If the price fixes below 1.32700 expect further descend toward 1.32400-1.32200.
Alternatively the quote can correct toward 1.33400-1.33600.
The USD/JPY currency pair
Technical indicators of the currency pair:
Prev Open: 108.507
Open: 108.700
% chg. over the last day: +0.11
Day's range: 108.512 – 109.087
52 wk range: 104.56 – 114.56
The USD/JPY quotes keep recovering after a long fall. The save haven currency is testing 109.000. 108.300 is acting as the key support. The downward trend can return soon. The US and China started the negotioations which led to the increase of demand for safe assets. Positions should be opened from the key levels.
The Economic News Feed for 08.01.2019 is calm.
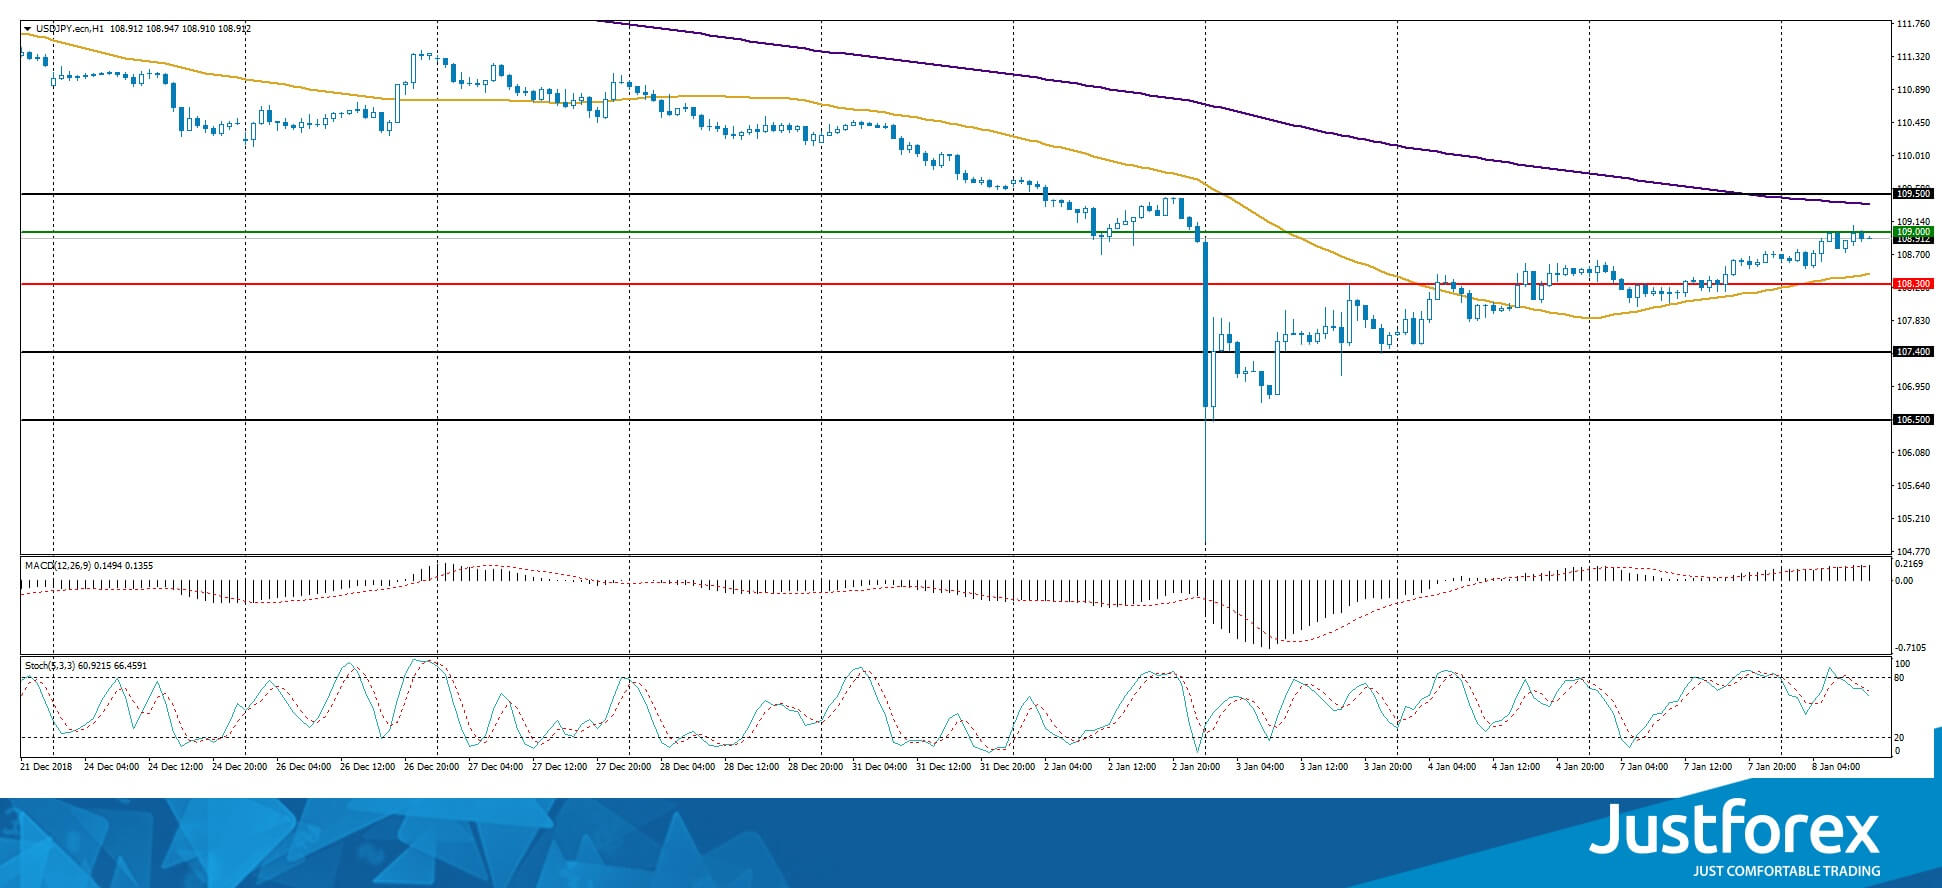
The indicators do not provide precise signals, the price fixed between 50 MA and 200 MA.
The MACD histogram is in the positive zone and above the signal line, which shows the further growth of USD/JPY.
The Stochastic Oscillator is in the neutral zone, the %K line is below the %D line, which points toward a bearish mood.
Trading recommendations
Support levels: 108.300, 107.400, 106.500
Resistance levels: 109.000, 109.500
If the price fixes above the round 109.000 exoect further growth of USD/JPY.
Alternatively the quotes can descend toward 108.000-107.800.
The US Dollar Index Is In The Red
The US dollar weakened against a basket of major currencies after statements by Fed Chairman Jerome Powell. The official said that the US Central Bank would closely monitor the development of the country's economic situation in the new year and adjust monetary policy by economic statistics. The dollar index (#DX) closed yesterday in the negative zone (-0.51%).
Weak economic reports put additional pressure on the US currency. Thus, the US ISM non-manufacturing PMI counted to 57.6 in December, while experts expected 59.6. Also, two-day negotiations between the US and China have started, which has led to an increase in demand for safe assets. Investors hope that countries will be able to resolve the trade conflict and conclude an agreement.
The "black gold" prices are moderately growing. At the moment, futures for the WTI crude oil are testing the mark of $48.60 a barrel. At 23:30 (GMT+2:00), a report on the API weekly crude oil stock will be published.
Market Indicators
- Yesterday, the bullish sentiment was observed in the US stock market: #SPY (+0.79%), #DIA (+0.46%), #QQQ (+1.10%).
- The 10-year US government bonds yield is recovering. Currently, the indicator is at the level of 2.69-2.70%.
The news feed on 08.01.2019:
- Statistics on the trade balance in the US at 15:30 (GMT+2:00);
- JOLTS job openings in the US at 17:00 (GMT+2:00).
WTI Crude Oil Futures Could See Further Gains In Near Term
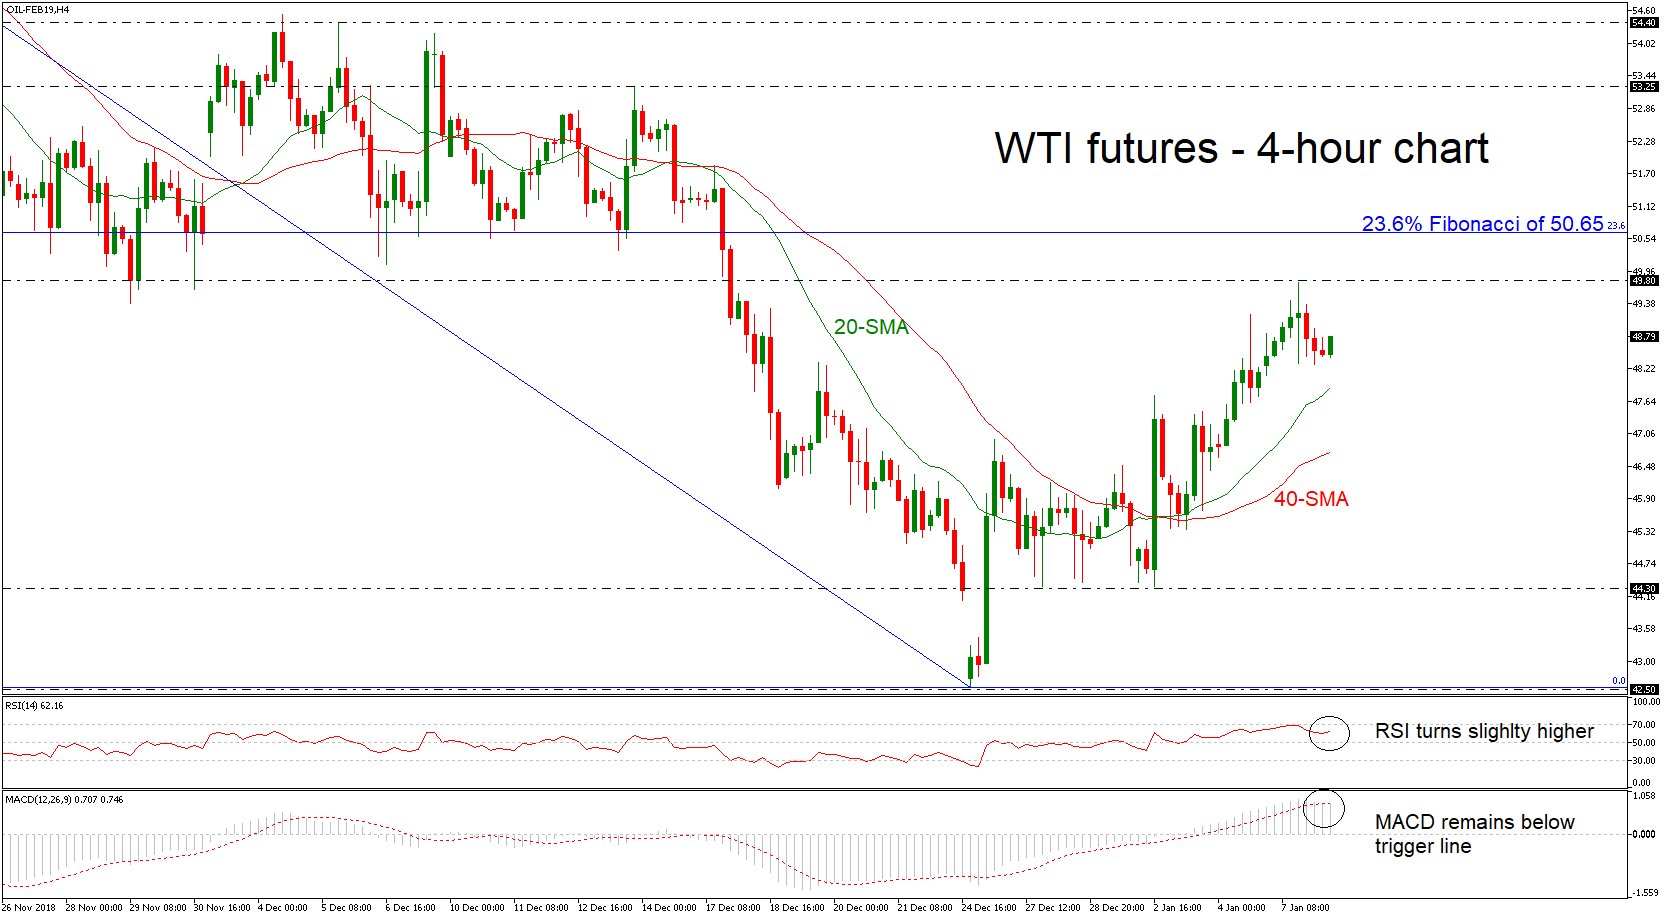
WTI crude oil futures (for February delivery) rebounded on the 18-month low of 42.50 on December 26, driving the price higher towards a three-week high of 49.80 yesterday. The technical indicators suggest that there are still some investors that could hold the market on the downside; the MACD is consolidating below its red signal line, however, the RSI has turned slightly higher above 50 level.
Should the price retreat, the 20- and the 40-simple moving averages (SMAs) at 47.88 and 46.73 correspondingly could be the next immediate levels to watch. Below that, the area around 44.30, which halted downside pressures several times at the end of the previous month could be another potential barrier.
On the other side, if the oil continues the current upside move it could find nearby resistance at the 49.80. Further up, the price could rest around the 23.6% Fibonacci retracement level of the downleg from 76.90 to 42.50, near 50.65. A decisive close above the latter could push oil prices until the 53.25 barrier.
To summarize, oil futures currently stand in a bullish correction mode in the very short term, while looking at the bigger picture the market continues to hold in bearish tendency.
Trade Optimism Not Very Helpful, US-Sino Trade Talks Conclude Today
- Stocks gain little on trade news as more clarity needed
- Antipodeans weaken, dollar strengthens
- Trump addresses nation on Tuesday to discuss border
- EU and British officials said to be discussing Brexit delay
Trade hopes rise as US-Sino negotiations conclude
Trade headlines will top market interest on Tuesday as Chinese and US officials conclude their two-day meeting in Beijing. This is the first face-to-face contact after Trump and Xi Jinping agreed at the G20 summit on December 1 to a ceasefire on new tariffs until March 1 and investors are hopeful that the two sides could be in a rush to reach common ground as negative economic consequences have started to emerge, especially in China.
Optimism heightened even further on Monday after the Chinese Vice Premier, Liu He made a surprise appearance at the vice-ministerial level trade talks, a potential sign that Beijing is willing to strike a deal with the US. In the same day, the US Commerce Secretary, Wilbur Ross, stated that both governments could reach an agreement that “we can live with” encouraging markets even more that the outcome of the negotiations will be positive.
In the aftermath, the Dow Jones and S&P 500 closed with moderate gains on Monday, while on Tuesday stocks in Asia traded mixed, with Japanese equities moving in positive territory and Chinese ones in the negative despite China releasing more liquidity on Friday. This indicates that investors are not totally convinced that trade negotiations could make rapid progress, probably asking for more clues in advance of stepping up buying orders.
Moreover, the notion that the Fed may not deliver two rate hikes in the new year seems to be supporting investor sentiment during the past few months, though a lot of uncertainty remains and hence volatility is expected to continue to trouble markets until the Fed gives a clear rate guidance. FOMC meeting minutes due for release on Wednesday are next in line to impact market rate projections. Recall that the US services sector grew at a slower pace in December according to the ISM non-manufacturing survey on Monday, though it did not deteriorate as much as the manufacturing industry did.
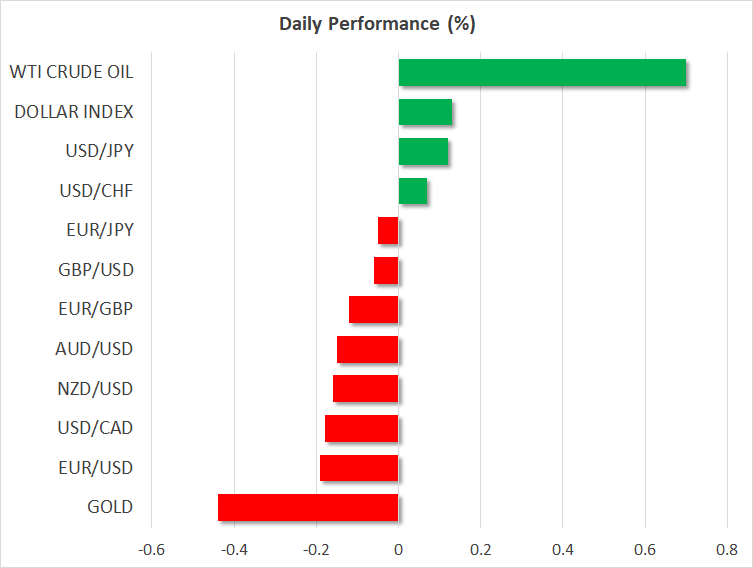
Dollar rebounds after three days of drops, antipodeans weaken despite trade news
In FX markets, the dollar was on the recovery on Tuesday against six major currencies, with dollar/yen crawling up to 109 after almost a week. The antipodeans, though, which had a respectful rally the previous two days, reversed to the downside despite optimistic trade headlines. The kiwi declined by 0.25% while the fall in the aussie was double that percentage probably due to missing concrete proof of progress in the trade talks. Weaker-than-expected trade stats out of Australia probably weighed on sentiment as well. The data showed that the Australian trade surplus narrowed for the second consecutive month in November, while October’s number was revised downwards.
Besides trade, investors will be also watching political developments in the US as fears over a government shutdown persisted for the 17th day on Monday, with public services operating partially as many federal workers could miss their paycheck this week. President Trump and Democrats did little to resolve their budget differences mainly due to Democrats’ strong opposition on the funding of the border wall. Specifically, the US President is asking for $5.6 billion, while Democrats are only willing to accept $1.3 billion for border security but nothing for a wall.
The debate is expected to continue later in the day, with Trump’s TV address at 9 p.m. on Tuesday (0200 GMT Wednesday ) eagerly awaited.
Brexit keeps pressuring buying interest in Europe; Eurozone economic sentiment index pending
Turning to Europe, market confidence remained weak as the Brexit issue kept investors cautious, with the pound and the euro paring yesterday’s gains against the greenback. While questions remain about whether May will manage to achieve more concessions from the EU, the Daily Telegraph reported that EU and British Officials are discussing the possibility of postponing the exit date amid concerns that the British Parliament will not approve it by March 29. According to the BBC, the Brexit vote in Parliament is expected to take place on January 15.
Monetary policy is another puzzle in Europe. The BoE is not willing to raise interest rates until it gets more clarity on Brexit, while the ECB, which terminated its asset purchase program in December, has promised that a rate hike would only come after the summer of 2019. Yet markets are not certain if the latter will stay on course as policymakers failed to drive core inflation towards the 2.0% price target in 2018. Earlier today, data showed that German industrial output posted its biggest decline in two years in November, while later in the day the focus will shift to the Economic sentiment index due at 1000 GMT. Yesterday the Sentix investor confidence index for the month of January indicated that pessimism among investors increased but by less than analysts predicted.
US Markets Move Higher As Trade Talks Advance
Yesterday was a great day for Wall Street as investors cheered ongoing talks between the United States and China. Indicating the seriousness of the discussion, Xi Jinping’s senior economic official paid a visit to the negotiators. Liu He, who is the Vice Premier of the People’s Republic of China, was not scheduled to take part in the preliminary talks. Investors believe that there is a likelihood that the talks will yield results this time after failing to do so a year ago.
The price of crude oil edged higher as Saudi Arabia and other OPEC countries moved to slash production. Indeed, the price of oil has managed to move significantly higher this year. Investors believe that a deal between US and China will help increase the demand of oil. Increased demand and lower production are good catalysts to push the price higher.
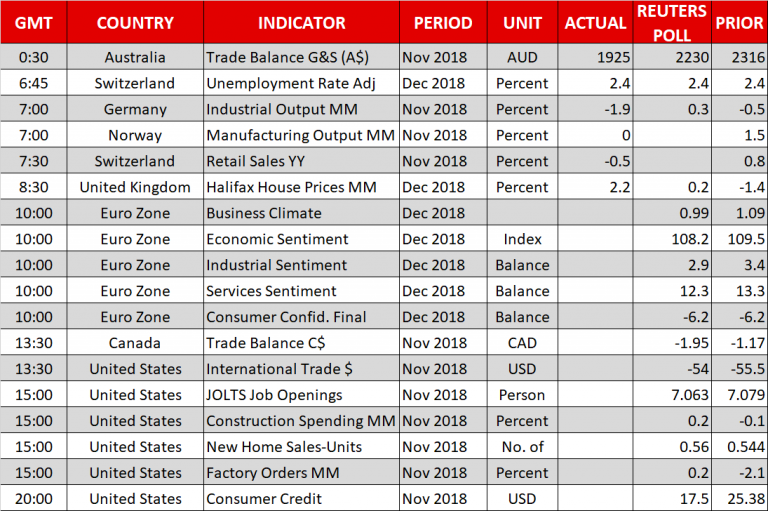
The market will likely see low volatility today as no major economic releases are expected. Data from Switzerland will reveal the employment numbers. The country’s unemployment rate is expected to remain at 2.4%. In the European Union, surveys of business optimism will be released. The business and consumer survey for December is expected to be at 108.2, which will be lower than previous data. The consumer confidence is expected to remain at minus 6.2 while the industrial sentiment is expected to drop to 1.2.
EUR/USD
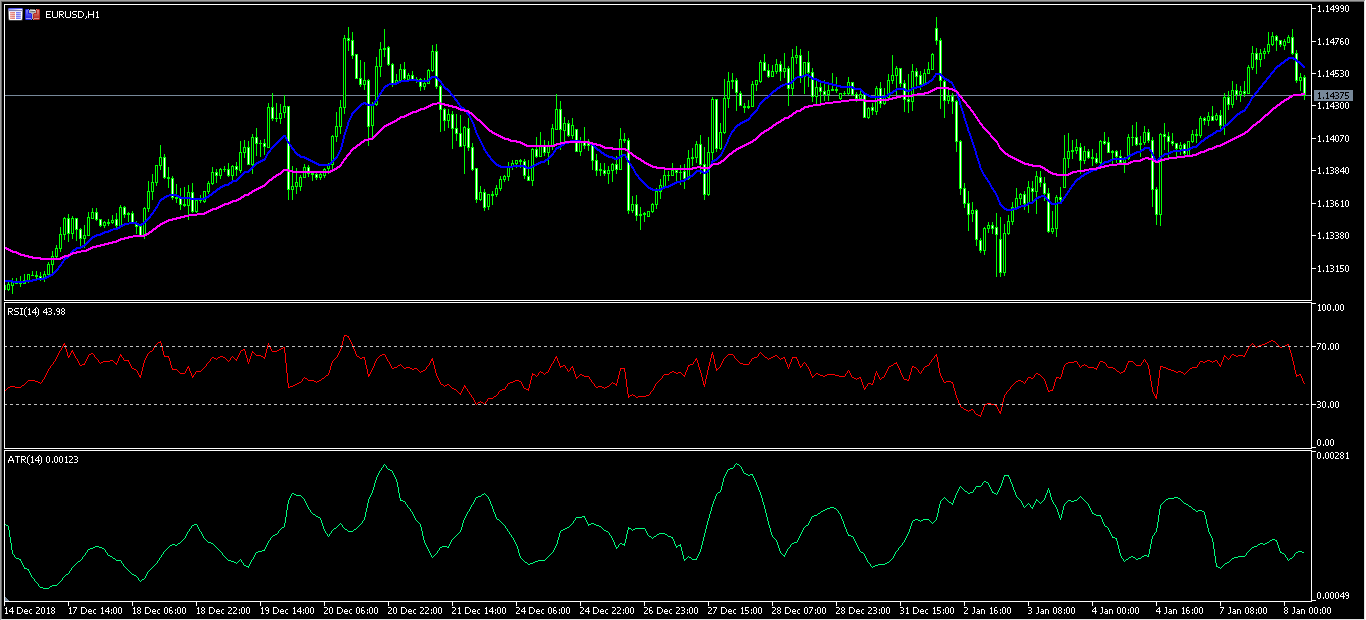
The EUR/USD pair dropped sharply during the Asian session. The pair fell from a high of 1.1484 to a low of 1.1435. On the hourly chart, the pair’s price was below the 14-day Exponential Moving Average and along the three-week average. The RSI has moved from an overbought level of 70 to the current 43 while the Average True Range indicator has remained at a neutral level. More declines will likely see the pair test the important level of 1.1400.
USD/CAD
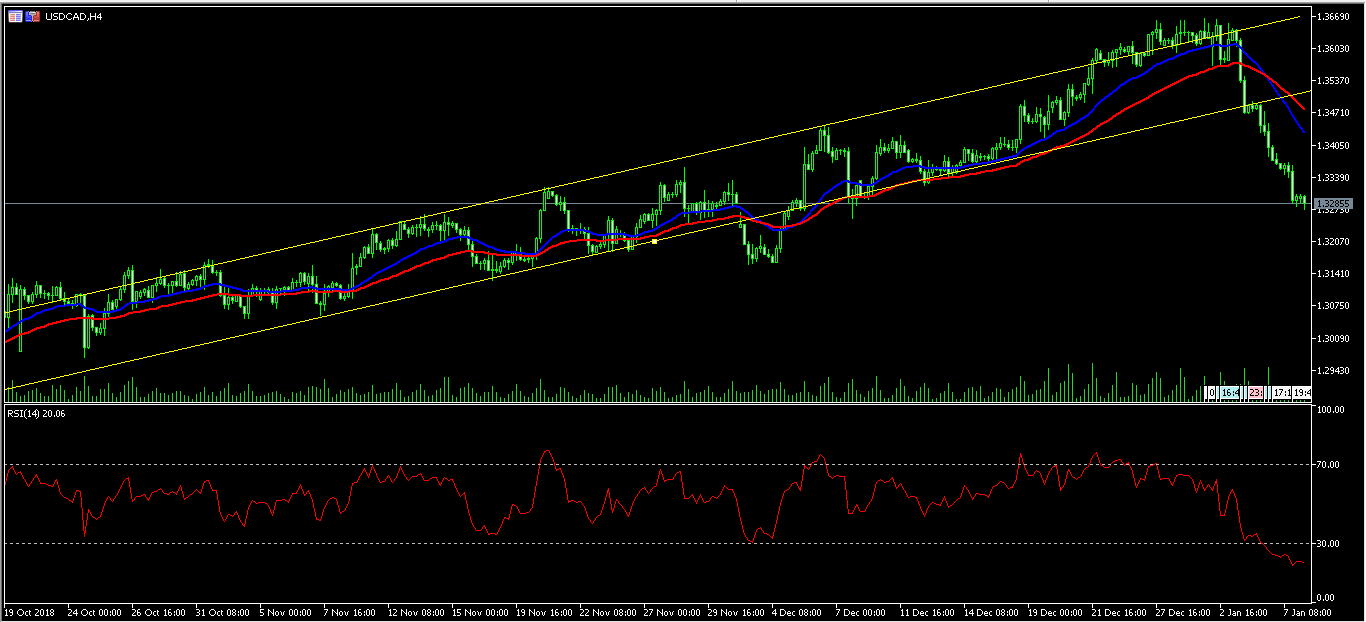
The USD/CAD pair continued the deep descent started last week. The pair has moved to a low of 1.3285, which is the lowest level since early December. On the four-hour chart, the pair’s price is below the 14-day and 28-day EMA while the RSI has moved deep into the oversold level. Investors will now watch closely the BOC interest rates decision scheduled for tomorrow. More declines will likely see the pair move to a low of 1.3200.
GBP/USD
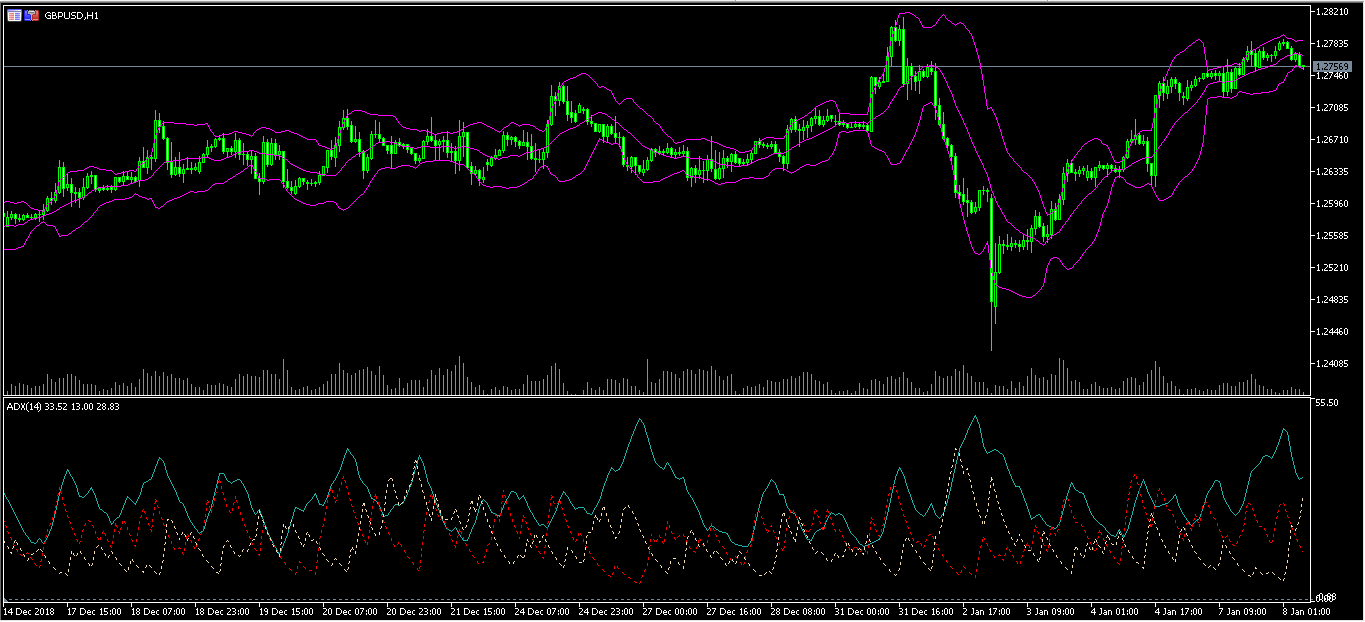
The GBP/USD pair declined slightly during the Asian session to a low of 1.2752. On the hourly chart, the pair has been on an upward trend this year, rising from a low of 1.2423 to a high of 1.2790. The Average Directional Index has moved from a high of 47 to the current 33 while the Bollinger Bands have narrowed around the current price. The upward trend could continue as the current decline is in a low volume market.
GBP/USD Outlook: Bulls Struggle At 55SMA With Little Help From Upbeat Housing Data
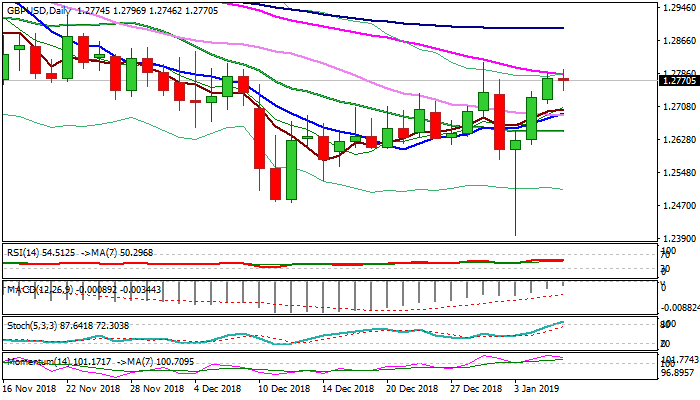
Cable is regaining traction after consolidation in Asian session and probing through 55SMA / 50% of 1.3174/1.2397 bear-leg (1.2783/86), where three-day rally faced strong headwinds on Monday.
Pound moved higher after markets digested newspapers report about extending the formal exit process, with upbeat UK housing data (Dec HPI y/y 1.3% vs 0.4% f/c and m/m 2.2% vs 0.5% f/c) adding to positive tone.
Bullishly aligned daily techs are supportive, but the pair struggles at 55SMA on volatile market ahead of next week’s vote on Brexit plan.
Bullish scenario on sustained break above 55SMA would open way for extension of recovery rally after last week’s flash crash towards key barriers at 1.2880 zone (daily cloud base / Fibo 61.8% of 1.3174/1.2397).
Conversely, the pair may hold in extended consolidation on repeated rejection at 55SMA, with rising 10SMA / top of rising thick hourly cloud at 1.2700 zone, required to hold and maintain bullish bias.
Return and close below 10SMA would weaken near-term structure, while extension below 1.2645 (20SMA / Fibo 38.2% of 1.2397/1.2796 recovery leg) would generate negative signal.
Res: 1.2783, 1.2814, 1.2850, 1.2880
Sup: 1.2746, 1.2716, 1.2693, 1.2645
EUR/USD Outlook: Bulls Are Taking A Breather After Another Failure At 100SMA
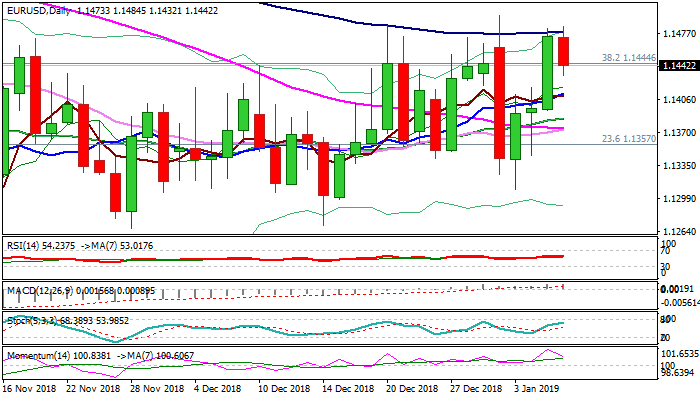
Bulls are taking a breather after strong three-day recovery rally managed to close above pivotal Fibo barrier at 1.1444 (38.2% of 1.1815/1.1215) but was again failed to clearly break above 100SMA (1.1478).
Early Monday’s action is holding in red as the price eased to broken 1.1444 Fibo level, now acting as initial support, which guards pivotal supports at 1.1417/13 (Fibo 38.2% of 1.1309/1.1484 / daily 10SMA).
Current action could be seen as positioning ahead of fresh attempt at key 100 SMA / daily cloud top barriers (1.1478/1.1515).
Overall bullish daily techs and weaker dollar on concerns that the Fed would end its rate hike phase, due to signals of slowdown in the US economy growth, support the scenario.
Weak German / French data, released earlier this morning added to negative near-term tone, but focus is on Fed minutes of Dec meeting (due on Wednesday) and US CPI data (Friday) which are expected to give more hints about US central bank’s action in 2019.
Res: 1.1478, 1.1496, 1.1515, 1.1550
Sup: 1.1432, 1.1413, 1.1385, 1.1363
EUR/USD Will Pass 50.00% Fibo
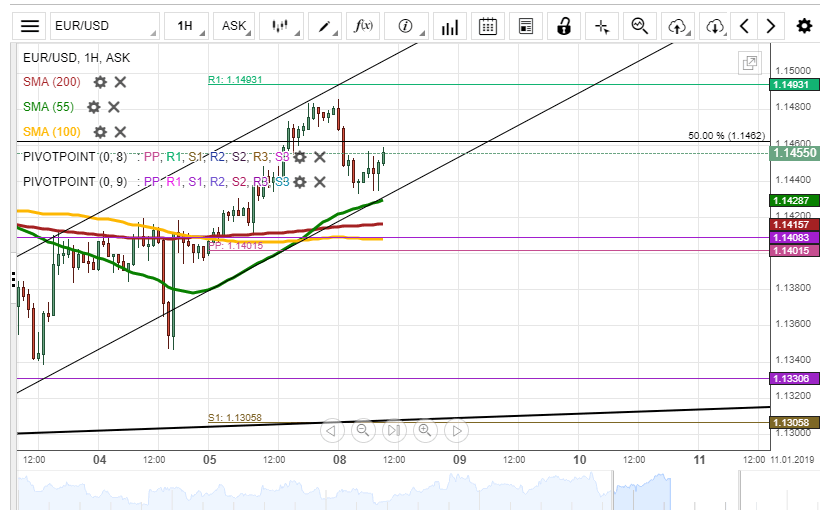
During Tuesday morning hours, the European Single currency depreciated by 51 pips or 0.45% to trade below the 50.00% Fibonacci retracement level at the 1.1440 mark.
In regards to the near-term future, the rate will surge upwards to meet the weekly R1 at the 1.1493 mark. Besides, the 55-hour simple moving average may support the surge for the rest of the trading session.
However, the weekly R1 could retrace the EUR/USD to push the rate to stay at the 1.1480 level during the day.
GBP/USD Waits For A Break-Out
During Tuesday morning hours, the British Pound was trading near the upper boundary of the dominant pattern line at the 1.2762 mark.
The GBP/USD waits for a break-out which might occur during the trading session. In addition, the British Pond could break the upper boundary of the descending dominant pattern line at the 1.2800 mark to trade near the 82.20% Fibonacci retracement level.
On the other hand, the rate might get retraced by the dominant pattern line at the 1.2800 mark to push the rate to trade at the 1.2700 level during the day.