Sample Category Title
USDJPY Returns Above Rising Trend Line And SMAs, Bullish Outlook Holds
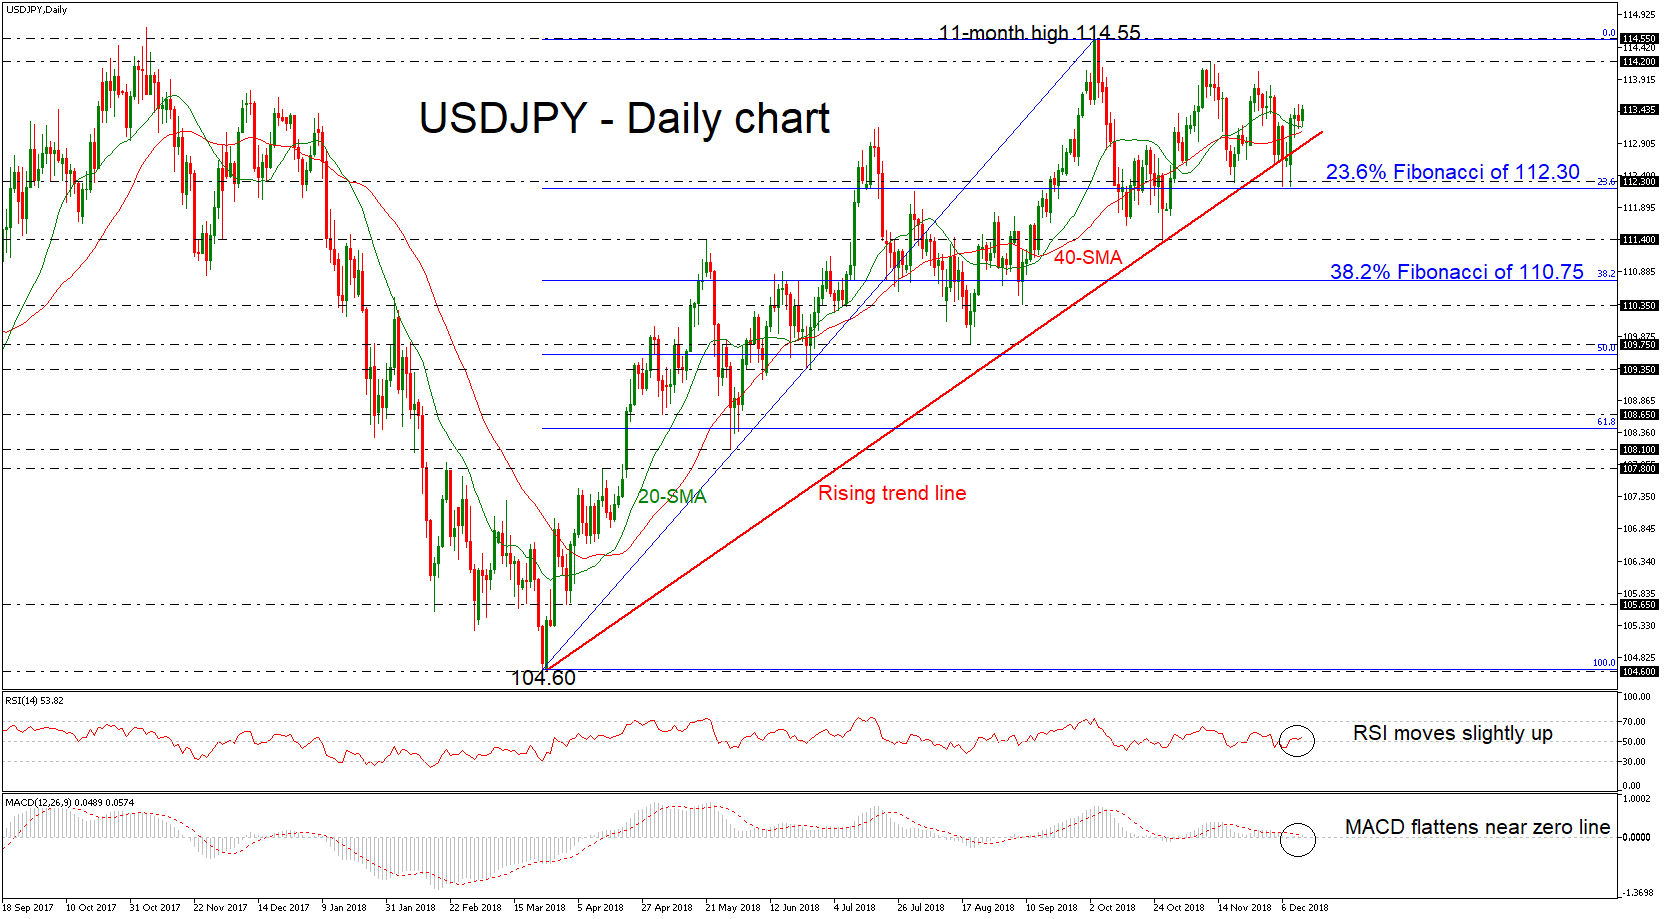
USDJPY has been facing buying interest after the rebound on the 23.6% Fibonacci retracement level of the upleg from 104.60 to 114.55, around the 112.30 support. The pair remains above the long-term ascending trend line, however, the technical indicators are moving with weak momentum. The RSI is pointing marginally up in the bullish zone, while the MACD oscillator is flattening near the trigger and zero lines in the short-term.
As the price advances above the 20- and 40-simple moving averages (SMAs), the expectation is an extension of the upward tendency towards the 114.20 resistance, registered on November 12. If this is also broken, resistance could come from the eleven-month high of 114.55, while even higher the 115.50 high, reached on March 2017 could be the next level for investors to look for.
On the other side, should negative momentum come into play and the price slides below the rising trend line as well as below the 23.6% Fibonacci, the bears could retest the 111.40 support level, taken from the low on October 26. Moving lower, the 38.2% Fibonacci of 110.75 could be a stop for the bears before slipping until the 110.35 area.
To sum up, in the longer-term view, USDJPY retains a bullish outlook over the last nine months. A daily close below the ascending trend line could signal a shift of the outlook to a more neutral one in the near term.
GBP/JPY Daily Outlook
Daily Pivots: (S1) 141.84; (P) 142.64; (R1) 143.83; More...
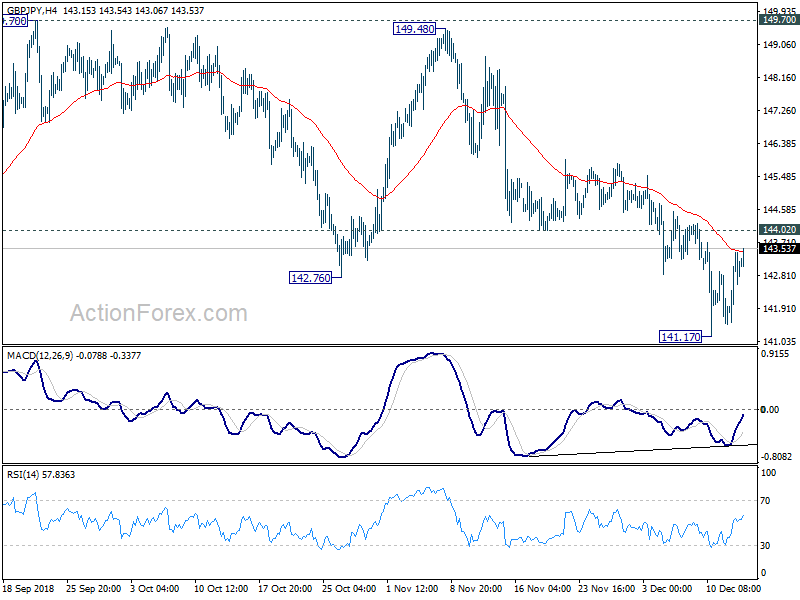
GBP/JPY's consolidation from 141.17 is still in progress and intraday bias remains neutral. As long as 144.02 support turned resistance holds, another decline remains mildly in favor. Below 141.17 will target 139.29/47 key support zone. However, considering bullish convergence condition in 4 hour MACD, decisive break of 144.02 will suggest near term reversal. Stronger rally should then be seen to 55 day EMA (now at 145.24) and above.
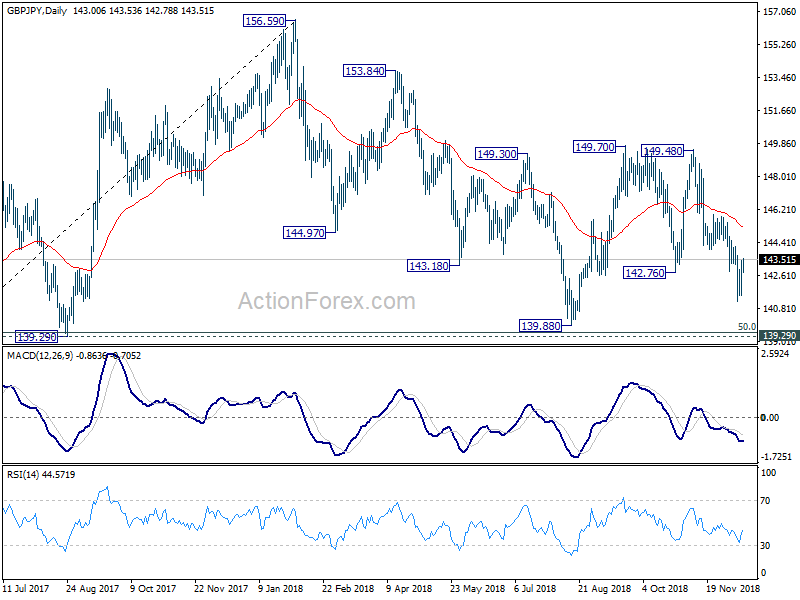
In the bigger picture, as long as 139.29 cluster support (50% retracement of 122.36 to 156.59 at 139.47) holds, up trend from 122.36 (2016 low) could still extend beyond 156.69 high. However, decisive break of 139.29/47 will suggest that such up trend is completed and turn outlook bearish. In that case, next target is 61.8% retracement at 135.43.
EUR/JPY Daily Outlook
Daily Pivots: (S1) 128.42; (P) 128.64; (R1) 129.01; More....
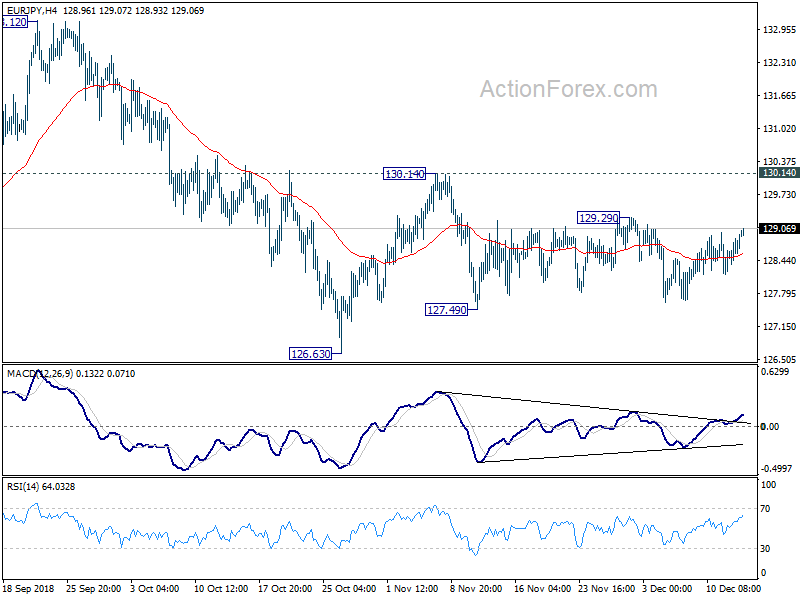
EUR/JPY continues to recovery today but it's staying in range of 127.49/129.29. Intraday bias remains neutral first. On the downside, break of 127.49 will target 126.63 support first. Break there will then resume the whole decline from 133.12 to 124.08/89 support zone. And, even in case of stronger recovery, outlook will stay bearish as long as 130.14 resistance holds.
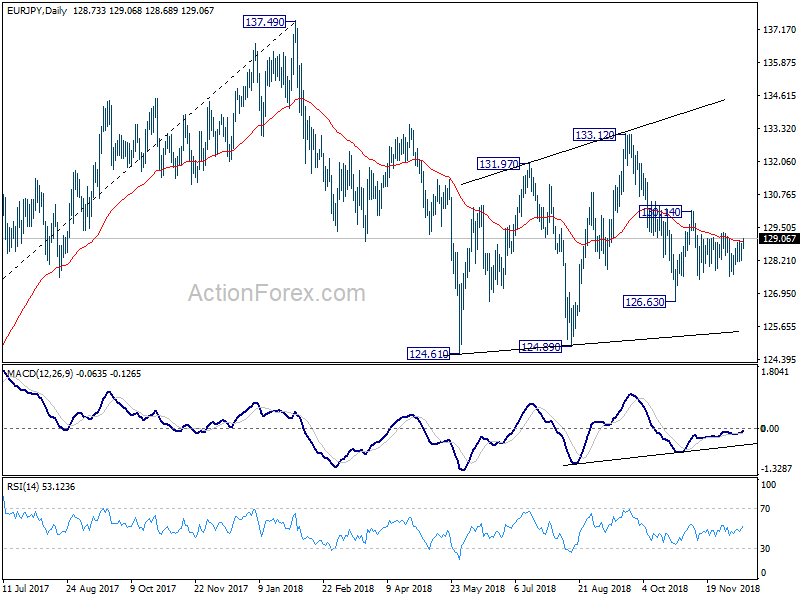
In the bigger picture, as long as 124.08 key resistance turn supported holds, larger up trend from 109.03 (2016 low) could still resume. Firm break of 137.49 structural resistance will target 141.04/149.76 resistance zone next. However, decisive break of 124.08 will argue that such rise from 109.03 has completed and turn outlook bearish. In that case, deeper fall would be seen to 61.8% retracement of 109.03 to 137.49 at 119.90.
EUR/GBP Daily Outlook
Daily Pivots: (S1) 0.8959; (P) 0.9014; (R1) 0.9060; More...
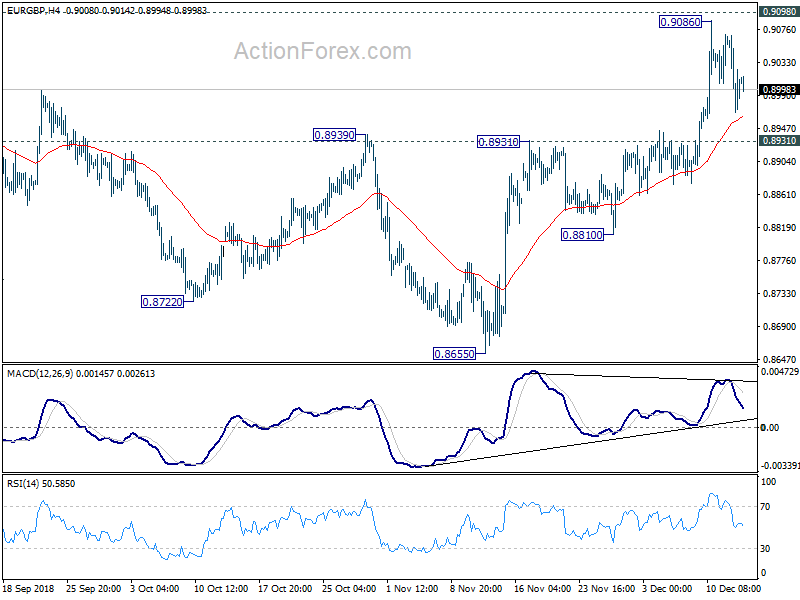
Intraday bias in EUR/GBP remains neutral for consolidation below 0.9086. Further rise is expected as long as 0.8931 resistance turned support holds. On the upside, decisive break of 0.9098 resistance will extend the rise from 0.8655 to 0.9304 key resistance next. However, considering bearish divergence condition in 4 hour MACD, firm break of 0.8931 will indicate near term reversal and target 0.8810 support and below.
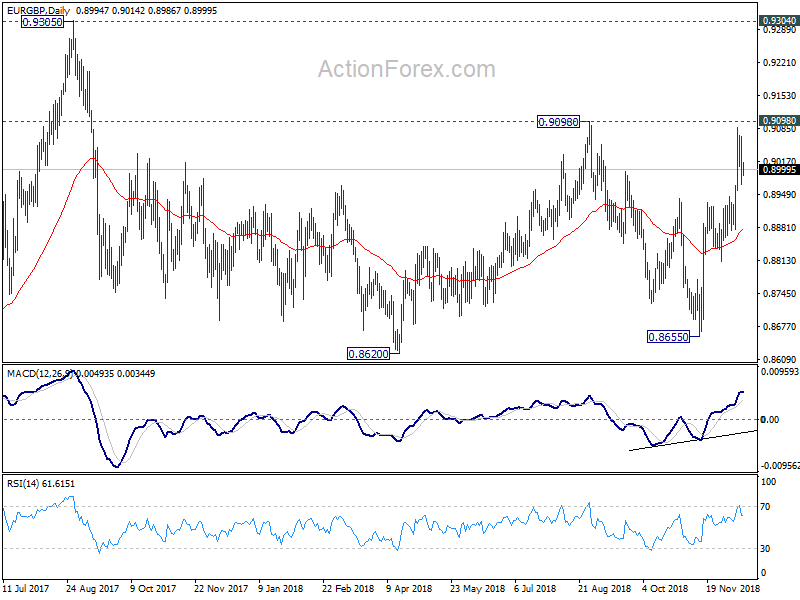
In the bigger picture, EUR/GBP is seen as staying in long term range pattern started at 0.9304 (2016 high). Sustained break of 0.8939 resistance will confirm that it's in a medium term rising leg for 0.9098 and above. And for now, in case of another fall, downside will likely be contained by 0.8620/55 support zone to bring rebound.
EUR/AUD Daily Outlook
Daily Pivots: (S1) 1.5692; (P) 1.5728; (R1) 1.5783; More....
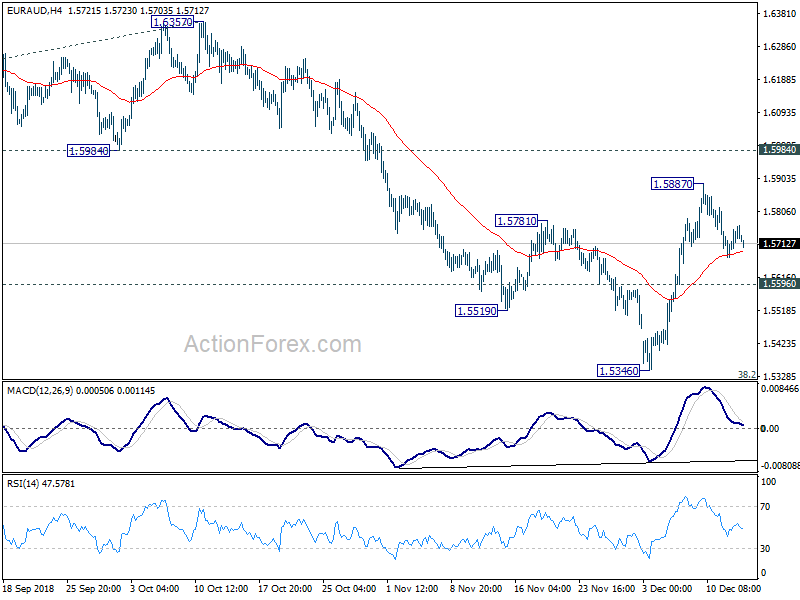
EUR/AUD's consolidation from 1.5887 is still in progress and intraday bias remains neutral. Downside of retreat should be contained by 1.5596 support to bring rise resumption. On the upside, above 1.5887 will resume the rise from 1.5346 to 1.5984 resistance first. Decisive break there will pave the way to retest 1.6357 high. Nevertheless, break of 1.5596 will indicate completion of the rebound and turn bias back to the downside for retesting 1.5346 low.
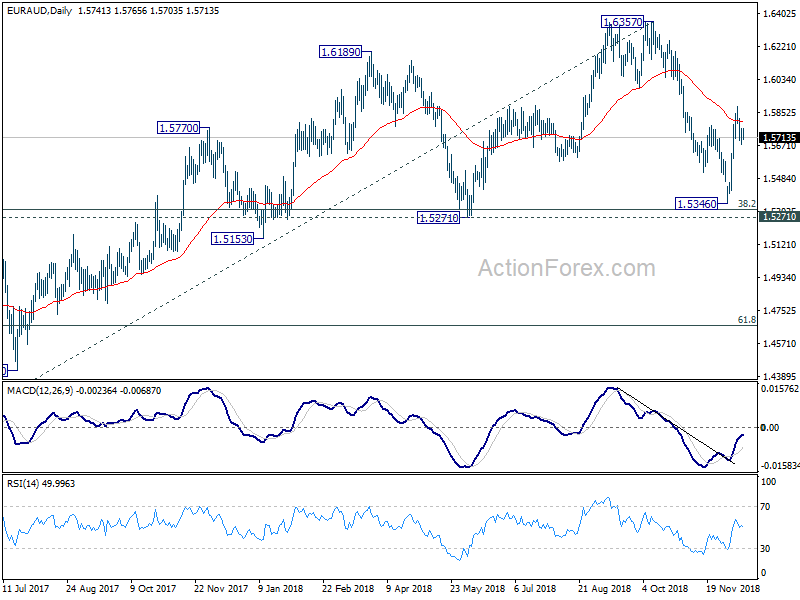
In the bigger picture, no change in the view that 1.6357 is a medium term top. But the strong rebound ahead of 1.5271 cluster support (38.2% retracement of 1.3624 to 1.6357 at 1.5313) suggests price actions from 1.6357 are developing into sideway consolidation, rather than a deep correction. The range of 1.5271/6357 is likely set for the consolidation. And we don't expect a break of the range any time soon. But decisive break of 1.6357 will resume the larger up trend from 1.3624 (2017 low) to 1.6587 (2015 high).
Forex Technical Analysis: EUR/USD, USD/JPY, GBP/USD
EUR/USD
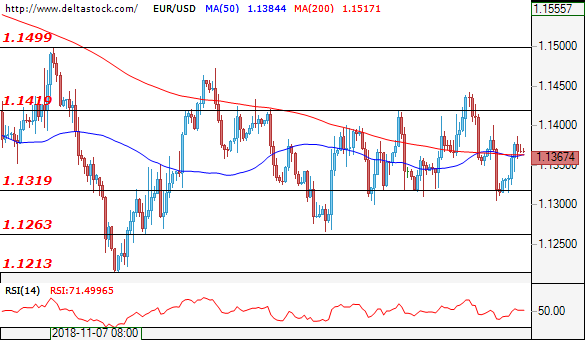
Current level - 1.1367
A new test of the 1.1300-1.1320 level is possible for the pair. The first resistance is at 1.1400 followed by 1.1450.
| Resistance | Support | ||
| intraday | intraweek | intraday | intraweek |
| 1.1350 | 1.1450 | 1.1300 | 1.1210 |
| 1.1400 | 1.1500 | 1.1260 | 1.0850 |
USD/JPY
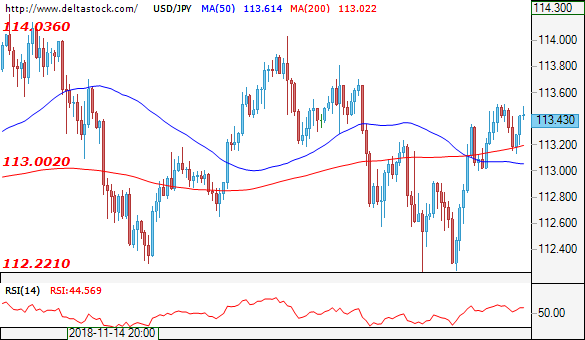
Current level - 113.43
We can say the breakthrough of 113.00 was successful. The first resistance for the move upwards is the 113.80 zone. Historically strong resistance is 114.50 and for rallies further we'll have to see a successfully break of that level otherwise a failed test can bring the pair to 112.00.
| Resistance | Support | ||
| intraday | intraweek | intraday | intraweek |
| 113.65 | 114.50 | 113.00 | 112.20 |
| 114.00 | 116.20 | 112.50 | 111.60 |
GBP/USD
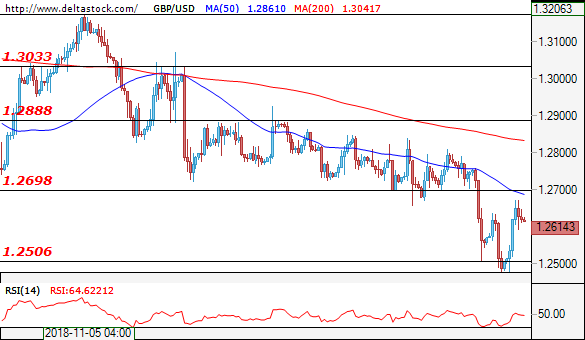
Current level - 1.2614
The break of 1.2700 extended the downtrend and the pair is about to test the next major support at 1.2360. First resistance is 1.2700.
| Resistance | Support | ||
| intraday | intraweek | intraday | intraweek |
| 1.2600 | 1.2880 | 1.2500 | 1.2360 |
| 1.2690 | 1.3030 | 1.2460 | 1.2140 |
EUR/USD Daily Outlook
Daily Pivots: (S1) 1.1327; (P) 1.1357; (R1) 1.1399; More.....
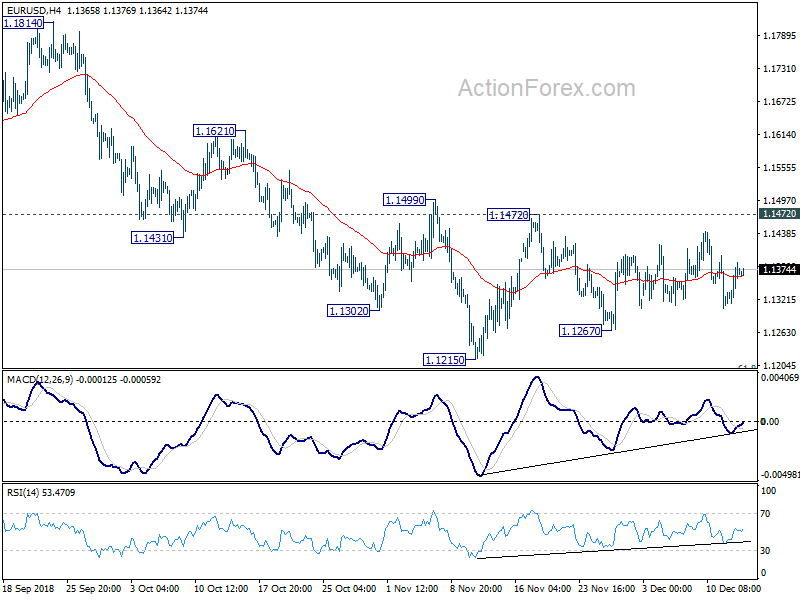
EUR/USD is staying in consolidation in range of 1.1267/1472. Intraday bias remains neutral for the moment. On the downside, break of 1.1267 will target 1.1215 low first. Firm break there will resume larger down trend from 1.2555 for 1.1186 fibonacci level next. However, considering bullish convergence condition in daily MACD, firm break of 1.1472 will be suggest medium term bottoming and turn outlook bullish for 1.1814 resistance instead.
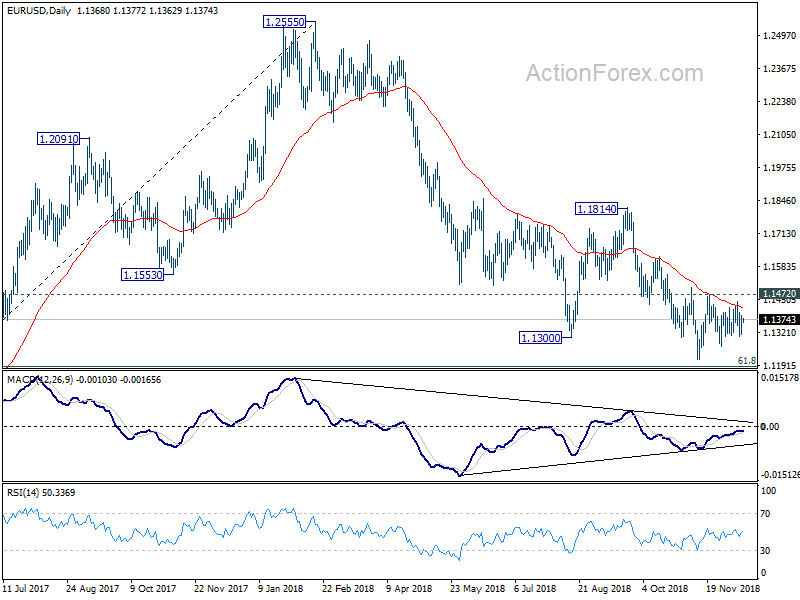
In the bigger picture, as long as 1.1814 resistance holds, down trend down trend from 1.2555 medium term top is still in progress and should target 61.8% retracement of 1.0339 (2017 low) to 1.2555 at 1.1186 next. Sustained break there will pave the way to retest 1.0339. However, break of 1.1814 will confirm completion of such down trend and turn medium term outlook bullish.
GBP/USD Daily Outlook
Daily Pivots: (S1) 1.2512; (P) 1.2592; (R1) 1.2708; More...
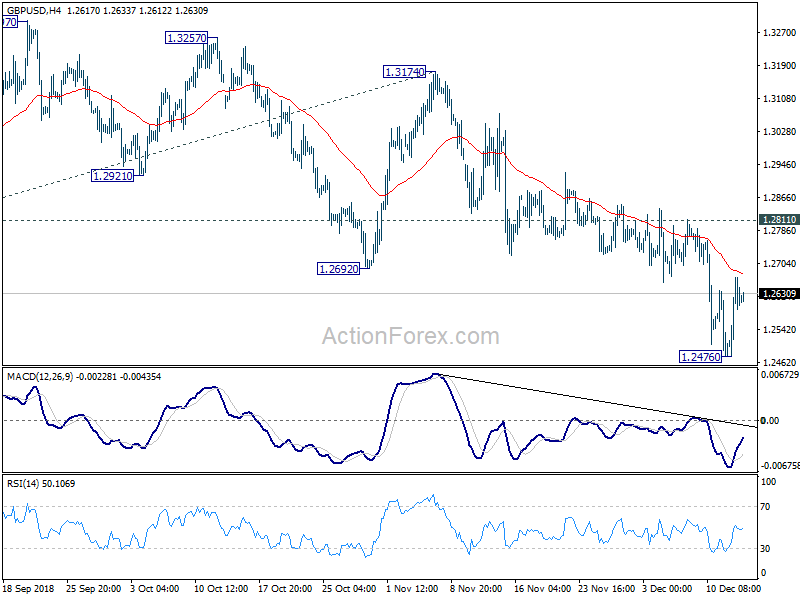
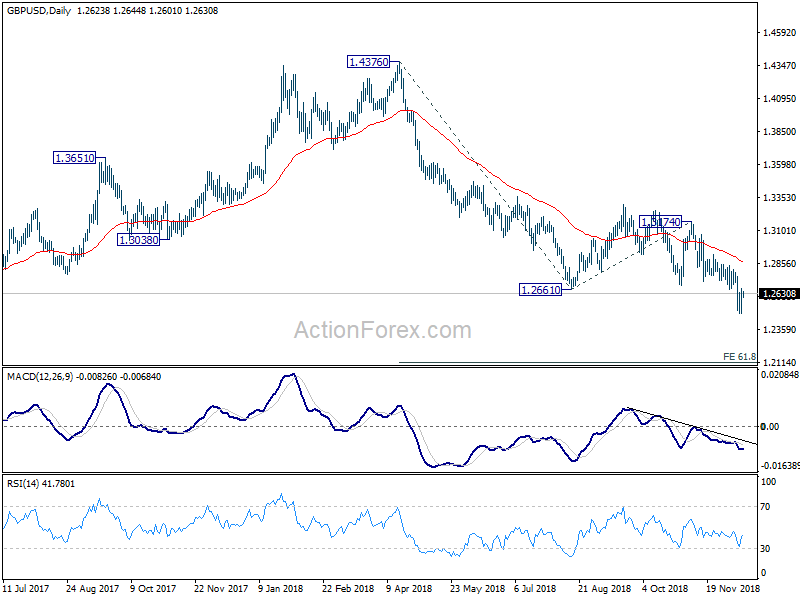
Intraday bias in GBP/USD remains neutral for consolidation above 1.2476. Upside should be limited by 1.2811 resistance to bring fall resumption. On the downside, break of 1.2476 will extend larger down trend from 1.4376 to 61.8% projection of 1.4376 to 1.2661 from 1.3174 at 1.2114. However, firm break of 1.2811 will be an early signal of trend reversal and turn focus back to 1.3174 resistance.
In the bigger picture, whole medium term rebound from 1.1946 (2016 low) should have completed at 1.4376 already, after rejection from 55 month EMA. The structure and momentum of the fall from 1.4376 argues that it's resuming long term down trend from 2.1161 (2007 high). And this will now remain the preferred case as long as 1.3174 structural resistance holds. GBP/USD should now target a test on 1.1946 first. Decisive break there will confirm our bearish view.
ETHUSD Indicators Attempting To Recover
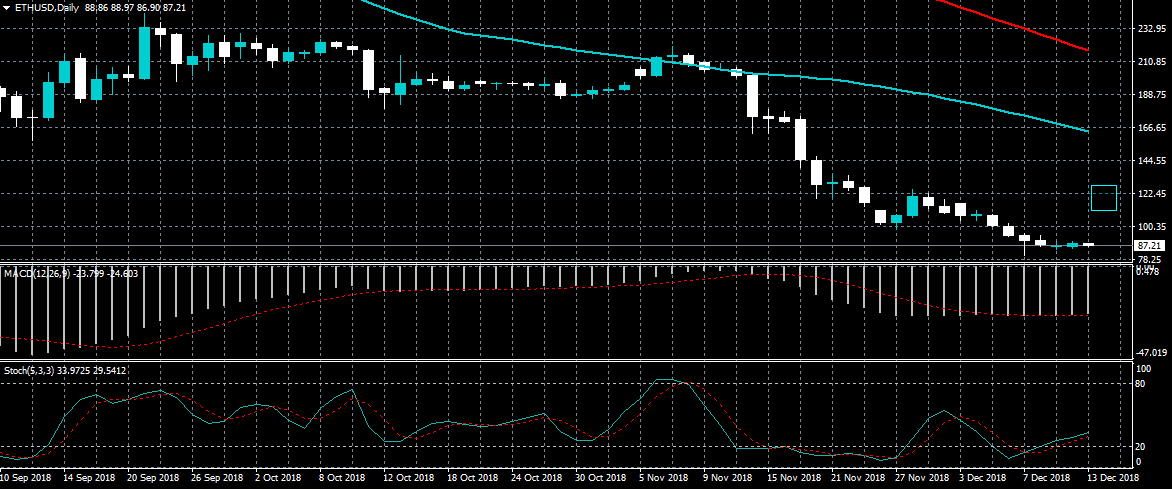
Ethereum remains under downside pressure on Thursday, with the ETHUSD pair still struggling to move away from worst trading levels of 2018 so far. The MACD and Stochastic indicators are attempting to move away from extremely oversold conditions on the daily time frame, although bullish momentum remains weak. If the ETHUSD pair can establish a price floor, buyers may attempt to rally price towards the $122.00 resistance level.
If the ETHUSD pair moves above the $100.00 level, buying may attempt a recovery towards the $115.00 and $122.00 resistance levels.
A decline below the $80.00 support level will likely accelerate ETHUSD selling towards the $75.00 and $70.00 levels.
EURUSD Neutral Bias Ahead Of ECB Meeting
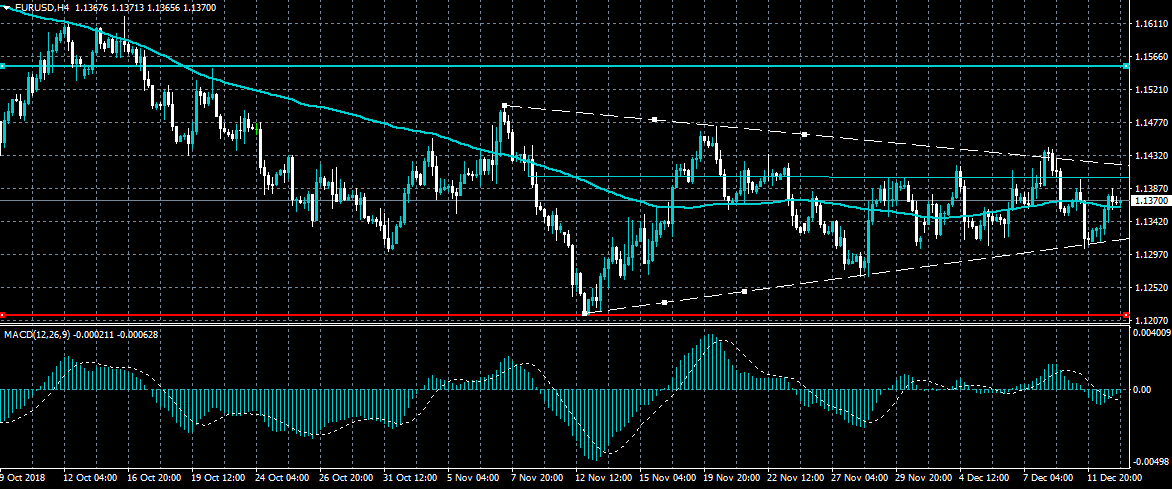
The euro currency is trading at the mid-point of its trading range against the US dollar after sellers failed to break below key trendline support. The EURUSD currently has a neutral bias heading into today’s ECB policy meeting, with the pair stuck in range bound mode. Overall, a definitive technical breakout from the well-defined triangle pattern is needed before a short-term trend can be established.
The EURUSD pair is only bearish while trading below the 1.1315 level, key technical support is found at the 1.1267 and 1.1216 levels.
If the EURUSD pair moves above the 1.1430 level, buyers may test the 1.1500 and 1.1550 resistance levels.