Sample Category Title
GBP/USD Analysis: Aims To Reach 1.2675 Level
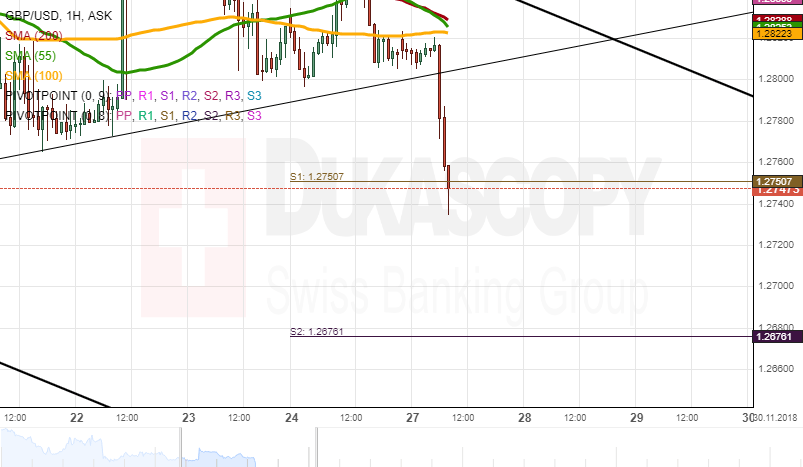
As the various simple moving averages approached the currency exchange rate, the GBP/USD plummeted down below the support line of a medium scale ascending pattern. The event resulted in a sharp decline on Tuesday morning.
During the decline the pair passed the support of the weekly S1 at the 1.2750 mark. Due to that reason the rate is expected to reach for the next support level during today's trading session. Namely, the 1.2676 level will be targeted. At that level the second weekly support is located.
On the other hand, any sharp decline is usually followed by a retracement upwards or a consolidation period. In addition, note the background Brexit fundamentals, which creates sharp moves in the rate.
USD/JPY Analysis: Is Expected To Trade Sideways
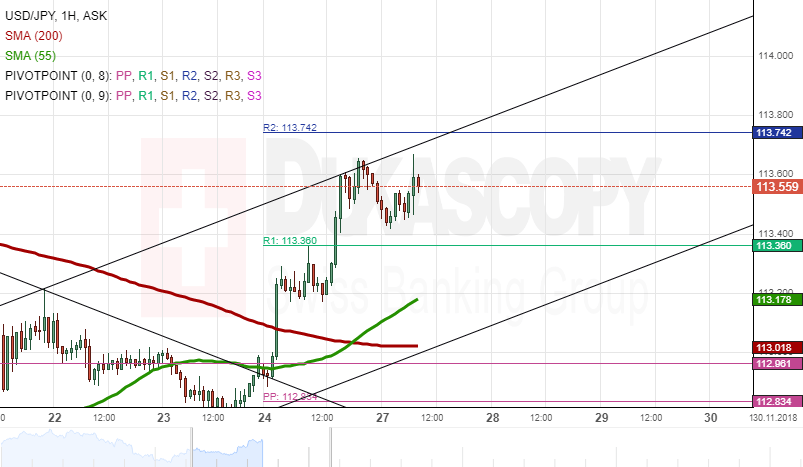
The USD/JPY broke the resistance of the weekly R1 at 113.36 during a second attempt. After the breaking of the resistance the rate surged during the next two hours until it reached the upper trend line of a medium term ascending pattern. The rate's surge was forced into a retracement by the trend line.
In general, the exchange rate is expected to continue to trade sideways between the weekly R1 at 113.36 and the weekly R2 at 113.74 until it does not face the resistance line of the ascending pattern.
Meanwhile, note that the 55-hour SMA should catch up to the rate. When that occurs, the surge is expected to resume, as additional support will signal a surge.
Gold Analysis: Declines To 1,220.00
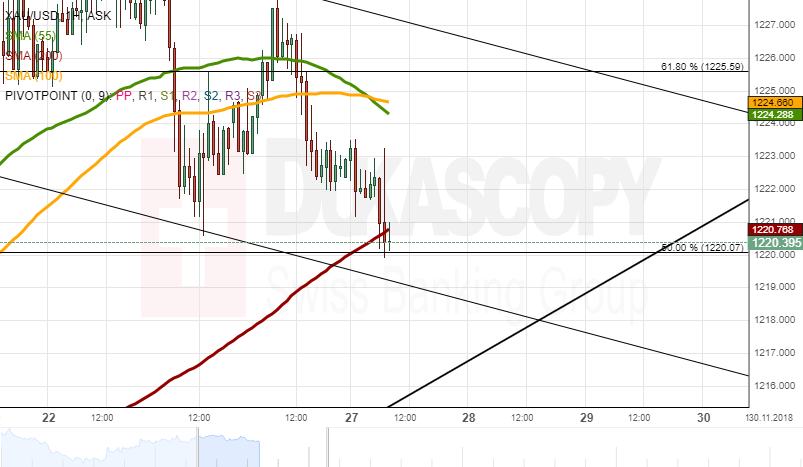
The previously discovered descending channel pattern has been fully confirmed. Gold price has declined after encountering the patterns resistance line and declined down to the 1,220.00 level.
The commodity price has reached the support of the 50.00% Fibonacci retracement level at 1,220.00. It is expected that the metal will eventually pass the support of the Fibo, as it is expected to reach the lower trend line of the channel down pattern.
Although, there is not much to gain there, as the lower trend line of the pattern is located at the lowest at the 1,217.00 level.
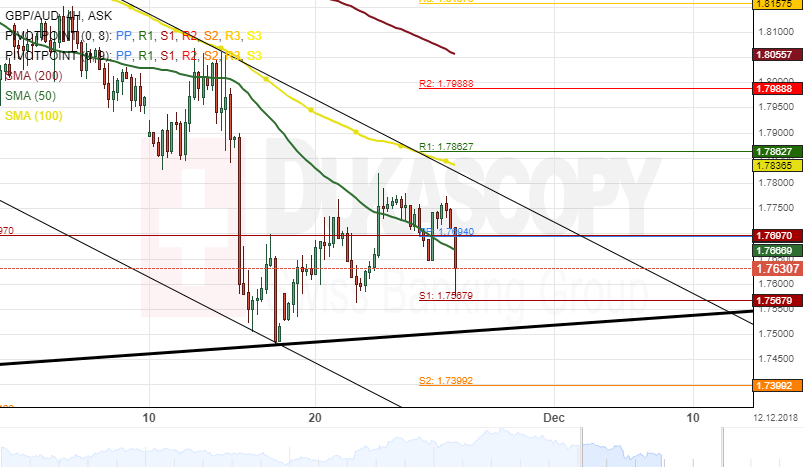
GBP/AUD 4H Chart: Decline Continues
The Pound Sterling has been depreciating against the Australian Dollar since the currency pair reversed from a swing high of 1.8777 on October 11.
The exchange rate breached a support cluster formed by the combination of the weekly, the monthly, and the 50-hour simple moving average at 1.7697 during the morning hours of Tuesday's session.
From a theoretical point of view, it is likely that the currency exchange rate continues its downward movement with this session.
If this decline continues, a potential breakout through the lower boundary of a dominant ascending channel is likely to occur during the following trading sessions.
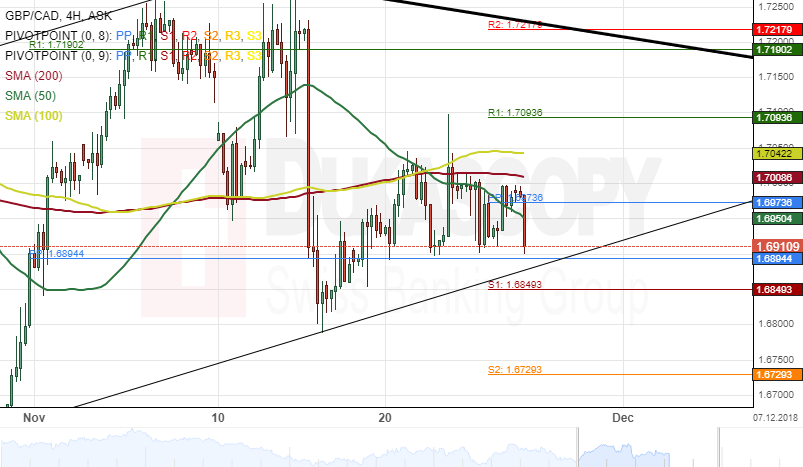
GBP/CAD 4H Chart: Bearish Sentiment Today
The British Pound has been appreciating in a short-term ascending channel pattern against the Canadian Dollar. The short-term pattern was formed on October 31.
The currency pair breached the weekly PP and the 50-hour simple moving average at 1.6973 during the Asian session on Tuesday. Most likely, the exchange rate will continue to depreciate within this session.
Given that the three moving averages are above the price level, bearish momentum could drive the GBP/CAD currency exchange rate to break the short-term ascending channel during the following trading days.
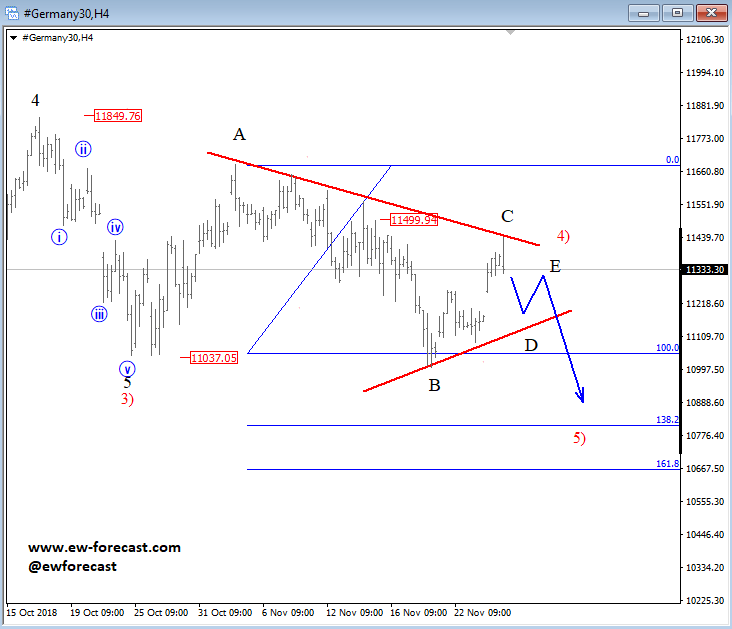
Interesting Pattern On German DAX Taking Place, More Weakness Ahead
We are observing a slow, and choppy price development taking place on German DAX since mid of October. It looks to be a symmetrical triangle pattern in play, which is contracting and now unfolding leg C. Leg C can look for resistance and reversal into the following leg D at the upper triangle line. That said, a triangle in this case is a bearish continuation pattern, meaning once fully developed a new leg towards new lows may follow. We expect to see wave 5) develop, which can take price towards the 10888/10670 region in upcoming sessions.
German DAX, 4h
Markets Flat As Trump Repeats Chinese Tariff Threat
Trump dampens the mood ahead of G20 meeting
It's been an encouraging start to the week in financial markets but we got a stark reminder of the challenges that lie ahead late on Monday, as Trump weighed in on trade and Brexit.
Trump's comments late in the day on Chinese tariffs don't offer much reason for optimism ahead of his meeting with Xi Jinping on the sidelines of the G20 meeting later this week. These may just be bold statements ahead of the meeting in the hope of pressuring China into a deal but they're certainly not empty threats. Trump hasn't been deterred so far and while the final tariffs may cause more harm to the consumer at home, I think he'll view this as a short-term price worth paying.
The tariffs are seemingly taking their toll on China already, with growth having slipped in the previous quarter and many forecasting that export performance will suffer also, despite the initial boost we've seen in the data. Front running of orders ahead of the tariffs being imposed has flattered the data so far but as time goes on, they are likely to take their toll, although the weaker yuan is going to help ease the pain.
Brexit agreement a threat to UK/US deal
Trump also weighed in on Brexit, much to the despair of Theresa May. At a time when the PM is trying to sell her Brexit deal to the UK, Trump conveniently stressed that he believed it was a good deal for the EU that could jeopardise trade with the US. This is a real blow for May given that a trade deal with the US is a key aim for the newly independent United Kingdom. Of course, we should always take these comments with a pinch of salt but that won't stop her opponents using it against her.
May now has two weeks to sell this deal to the country and, more importantly, the MPs who will vote on it. I think she's really going to struggle to get is passed at the first time of asking on the 11th December which likely means more turbulence for the currency, which is already coming under pressure as traders become less confident that no deal can and will be avoided. The backstop is a major issue and could be a deal breaker for too many MPs.
Oil slipping again as we await API report
Oil is continuing to look soft ahead of the OPEC+ meeting next week. The API inventory number later on could pile further misery on Brent and WTI if another significant build is reported, although I do once again find myself questioning whether the sell-off is a little overdone under the circumstances. The market seems to be pricing in either no output cut or only a small one, which may leave oil prices prone to a short squeeze. reiterate
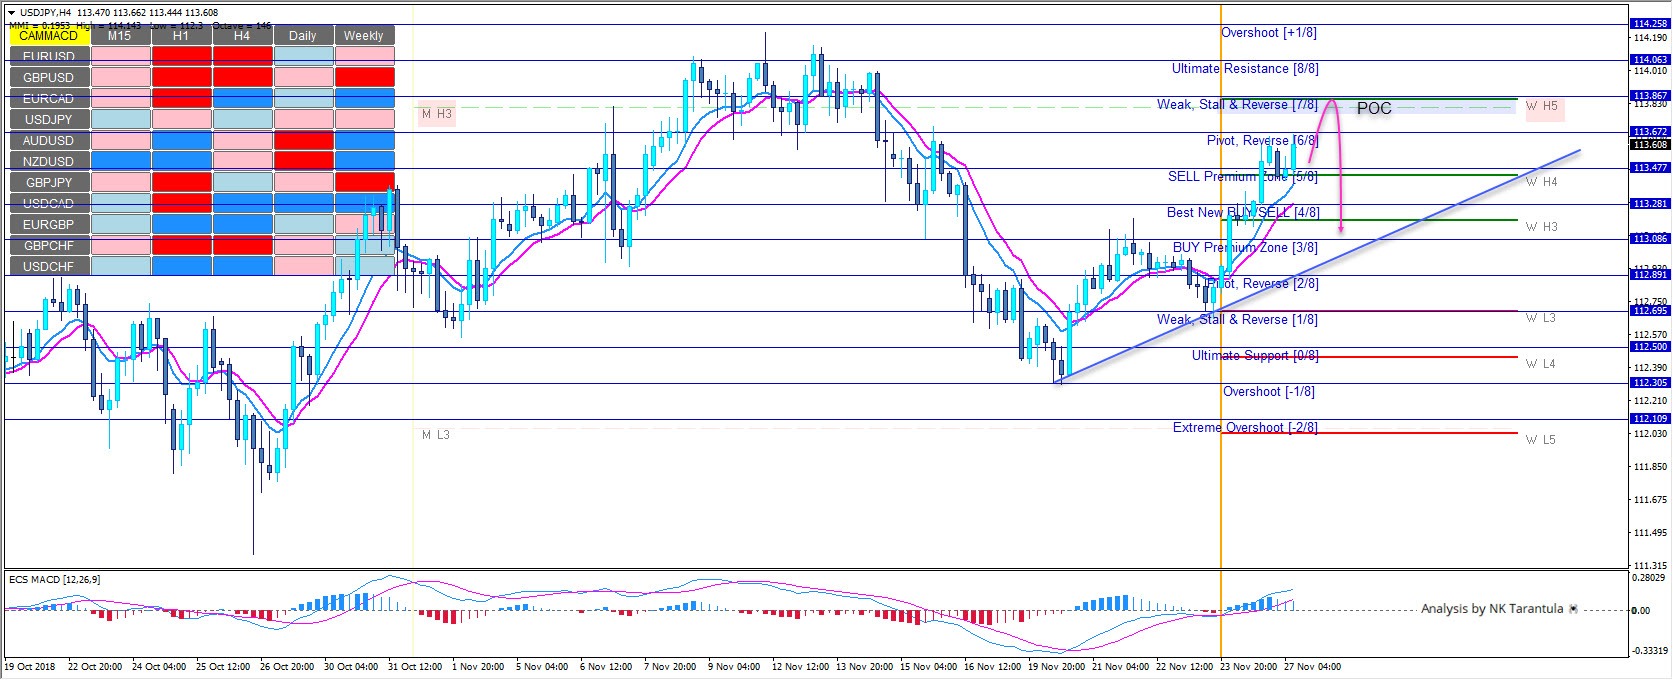
USD/JPY Strong Risk On Mode But Pay Attention To 113.85-95
M H3, W H5 camarilla levels along with 7/8 MM and historical sellers formed a nice confluence in the 113-85-95 zone. A reversal pattern should follow after initial rejection from the POC zone if the bears wanted to gain control. A rejection from the zone should target 113.10 as a retest. Watch for counter trend opportunities in the POC zone. A spike and h4 close above 114.25 will completely negate the bearish scenario.
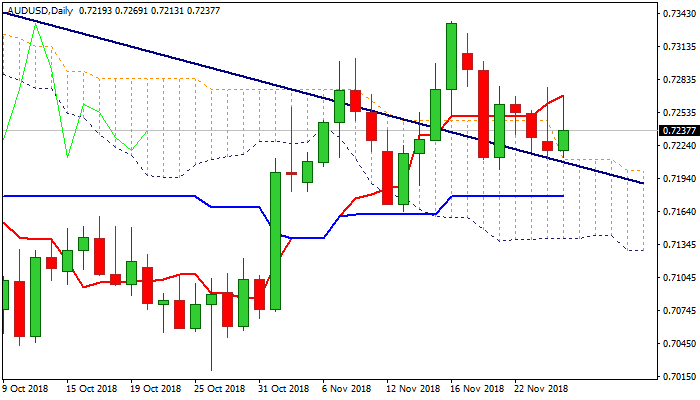
AUDUSD Outlook: Double Upside Rejection And Fears Of Tariff Hike Weigh On Australian Dollar
Bounce in to 0.7269 early European trading was short-lived and the pair returned to familiar levels, holding just above top of thick daily cloud (0.7211). Repeated strong upside rejection adds fears of extension of bear-leg from 0.7335, as the US dollar was boosted by recent comments from President Trump on proceeding with tariff hikes on imports from China. Daily techs are mixed and so far lack firmer direction signal. Negative signal could be expected on repeated close below rising 20SMA (0.7230), which needs confirmation on break below nearby pivots at 0.7215 (Fibo 38.2% of 0.7020/0.7335) and 0.7202 (21 Nov trough. Conversely, lift and close above Mon/Tue spikes at 0.7276/69 would neutralize downside threats and shift focus higher.
Res: 0.7254, 0.7269, 0.7276, 0.7300
Sup: 0.7230, 0.7215, 0.7202, 0.7183
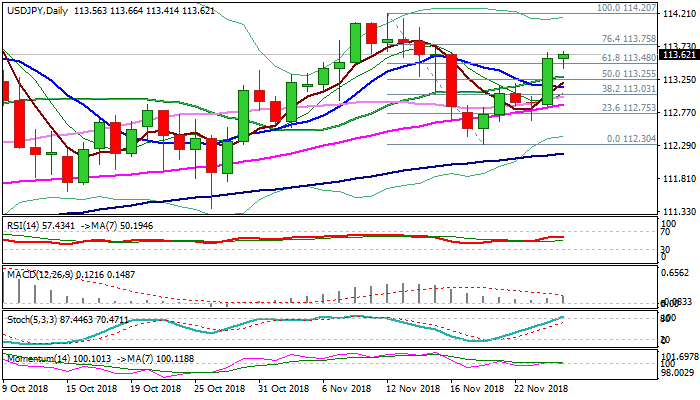
USDJPY Outlook: Bulls May Consolidate Before Continuing, Fed /G20 In Focus For Fresh Signals
The pair remains bid on Tuesday and probes above Monday’s high at 113.65, as the latest comments from President Trump about implementing plan for tariff hike on imports from China boosted demand for safe-haven dollar.
Long bullish candle, left on Monday’s 0.6% advance, underpins, with bullish signal generated on Monday’s close above 113.48 pivot (Fibo 61.8% of 114.20/112.30 bear-leg) and daily MA’s in bullish configuration.
On the other side, neutral momentum studies and overbought slow stochastic on daily chart warn that bulls may run out of steam.
Dip-buying (ideally above 113.24 (20SMA / top of thick 4-hr cloud) remains favored, as bulls eye target at 114.20 (12 Nov high), but traders also await Fed’s minutes as well as the outcome of Trump/Xi meeting for further signals.
Res: 113.75, 114.00, 114.20, 114.54
Sup: 113.41, 113.24, 113.14, 113.01