

Sample Category Title
EURCHF Turns Bearish Again in Short-Term; Outlook Remains Negative
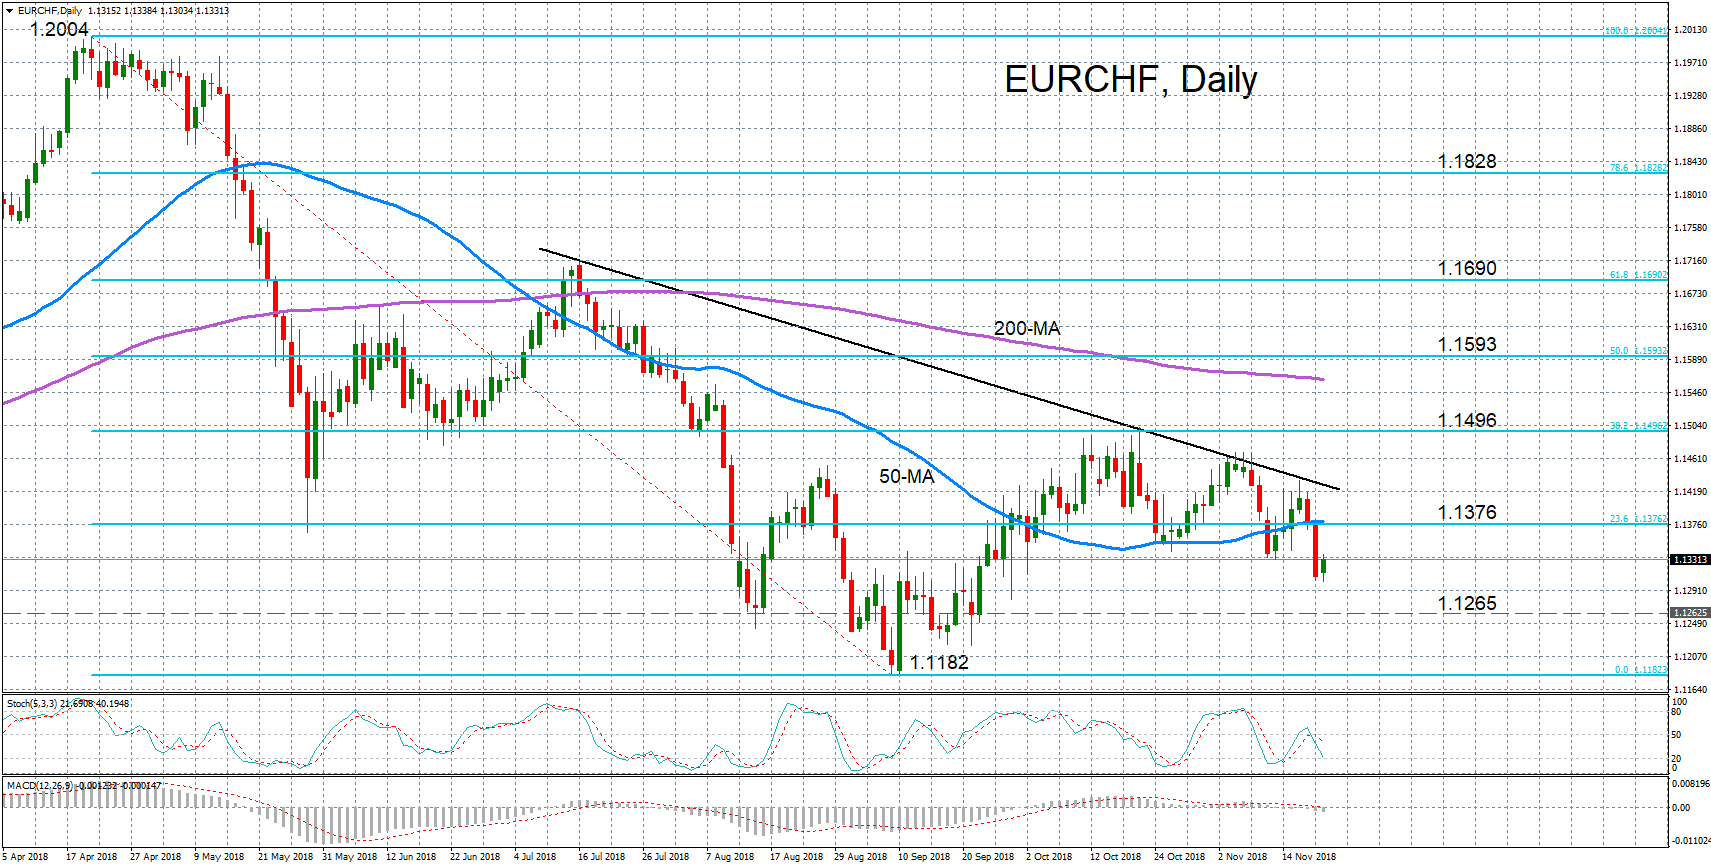
EURCHF has slipped back below its 50-day moving average (MA), touching a two-month low of 1.1303 earlier today. The near-term bias is looking bearish again with the MACD histogram returning to negative territory and falling below its signal line, while the stochastics are declining sharply.
Further declines would likely drive the pair towards the nearest support around 1.1265 – a previous congestion zone. Failure to hold above this support would risk a breach of September’s 13-month low of 1.1182. If broken, this would bring into focus the psychological 1.11 handle.
To the upside, immediate resistance could be met at the 23.6% Fibonacci retracement of the downleg from 1.2004 to 1.1182, at 1.1376. This is also where the 50-day MA is converging, suggesting the area could prove a difficult barrier to overcome. Higher up, further resistance could come from the descending trend line, which has been capping advances since July.
A break above the descending trendline would shift the short-term bearish picture to a more positive one and place EURCHF in a stronger position to re-challenge 38.2% Fibonacci at just below the 1.15 level. The 38.2% Fibonacci halted the pair’s rebound back in October. A successful attempt to cross above it could mark the start of a more bullish picture in the medium term.
European Commission: Italy’s 2019 budget a serious case of non-compliance, Excessive Deficit Procedure warranted
The European Commission confirms in a statement today the "existence of a particularly serious case of non-compliance" with EU's recommendation in Italy's Draft Budget Plan. The Commission has "carried out a new assessment of the prima facie lack of compliance with the debt criterion The new assessment was necessary because "Italy's fiscal plans for 2019 represent a material change in the relevant factors analysed by the Commission last May."
The Commission also noted that (i) the fact that macroeconomic conditions, despite recently intensified downside risks, cannot be argued to explain Italy's large gaps to compliance with the debt reduction benchmark, given nominal GDP growth above 2% since 2016; (ii) the fact that the government plans imply a marked backtracking on past growth-enhancing structural reforms, in particular the past pension reforms; and above all (iii) the identified risk of significant deviation from the recommended adjustment path towards the medium-term budgetary objective in 2018 and the particularly serious non-compliance for 2019 with the recommendation addressed to Italy by the Council on 13 July 2018, based on both the government plans and the Commission 2018 autumn forecast.
European Commission's statement here.
European Commission Vice President Valdis Dombrovskis confirmed debt criterion should be considered as not complied and a "debt-based Excessive Deficit Procedure is thus warranted" for Italy. He emphasized that "Euro area countries are in the same team and should be playing by the same rules." And, "these rules are there to protect us. They provide certainty, stability and mutual trust."
Economics commissioner Pierre Moscovici tweeted that "Today is not yet the opening of an EDP. First the Member States must give their views within two weeks, then the @EU_Commission will have to prepare the procedure, including a new recommendation for Italy to correct its deficit and debt trajectory." Also, "Our door remains open to dialogue with Italy. As we move closer to opening an Excessive Deficit Procedure, it is even more essential that the Italian authorities engage constructively with the @EU_Commission."
Growth Concerns Weigh On Stocks
Euro optimism subdued on Italy budget progress
Losing ground since last Wednesday, European equities are giving signs of recovery in early trading session. Spurred by the expectations of a budget revision from Italian populist coalition, the European equities market is turning into green after having tumbled for five straight days since last week.
Indeed, despite favoring a confrontational tone and threatening to block Brussels seven-year budget plan and implementing tit-for-tat tactics, Italian Deputy PM Matteo Salvini appears opened for discussion to make revisions on the Italian budget plan, a move that might not obtain the full support and engagement of his administration.
Accordingly, despite a slight recovery of Italian bonds, with BTP-Bund 10y spreads given at 3.15% and deflating from yesterday 3.27% high, the European Commission reports on all member states’ 2019 budget (and particularly Italy) will be scrutinized with careful attention, as Brussels could implement sanctions, a move that would be counterproductive for both the single currency and EU equities.
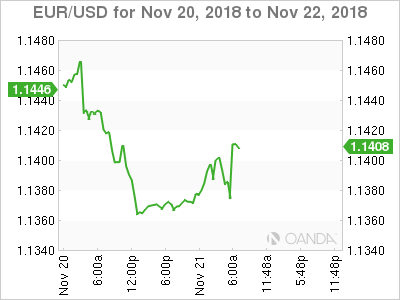
For now, EUR/USD is coming back to neutral following yesterday drop. Currently trading at 1.1410, we would rather consider a bearish move for the pair. Heading along 1.1350 short-term.
Growth concerns weigh on stocks
Following yesterday meeting between Chinese and Philippines Presidents in Manilla, which concluded on an oil and gas offshore deal in the South China Sea in a way of further rapprochement, Asian equities have been facing further difficulties. Key headlines relating to yesterday crude oil prices drop and worries over growth outlook in EM countries pushed energy and industrials sectors to the downside. However, the bounce in Consumer Discretionary, Health Care and Tech stocks allowed Chinese shares to bounce back into positive territories. On the same trend, major US market indexes have been declining across the board, losing gains from 2018 amid further drop in tech sector, as investors remain concerned over disappointing 3Q financial reports.
Indeed, since the beginning of the year, the blue chips Dow Jones Industrial Average is looking at a performance of -1.03%, while both the S&P 500 and the tech stock index NASDAQ remain at -1.19% and +0.08% respectively. On the other side, Asian indexes remain largely behind, with year-to-date performances ranging from -5.50% (Nikkei 225) to up to -20% (China mainland Shenzhen CSI 300).
Accordingly, we expect EM markets to bounce back into positive territory as soon as US markets will be maintaining positive gains.
Equity Bleeding Has Temporarily Stopped
Wednesday November 21: Five things the markets are talking about
Yesterday, major U.S indices extended their losses into a second-day as the relentless selling in technology and high beta names continued to wreak havoc.
However, the bleeding seems to have temporarily stopped in this morning’s Euro session as equities rally along with U.S futures, reducing some of this week’s losses, while Asian bourses traded mixed. The tech sector and auto companies are currently leading the equity advance.
Elsewhere, U.S Treasuries have edged a tad lower and the ‘big’ dollar has slipped, while the EUR (€1.1395) is pushing higher on market reports that the Italian government may be open to budget revisions. Even Italian bonds have found some traction, which is narrowing the BTP/Bund spread.
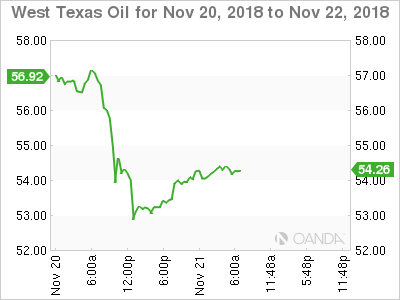
WTI oil has halted its slide near $54 a barrel as the market weighs inventory reports that showed U.S crude inventories falling last week against doubts over OPEC’s plans to cut output next month.
On tap: U.S core durable goods orders to be released at 08:30 am EDT. It’s a shortened trading week because of the U.S Thanksgiving holiday.
1. Stocks mixed results
There was a broad rebound in Asian equities after strong early declines on the back of yesterday’s declines in the U.S, coupled with the yen (¥112.94) turning lower, allowed Japanese stocks to pare much of their drop by day’s end. The Nikkei fell -0.35% on daylong weakness in energy and electronics stocks. The broader Topix fell -0.6% and trades atop of bear market territory.
Down-under, Aussie shares closed at their lowest level in 21-months on global growth worries. The S&P/ASX 200 index clawed back some of its earlier losses, but still closed -0.51% lower. The benchmark fell -0.4% on Tuesday. In S. Korea, the Kospi retreated -0.4%.
In China and Hong Kong, stocks bucked the regional sell-off as policy support gathers pace. The Shanghai Composite Index gained +0.2% and Hong Kong’s Hang Seng Index added +0.5%, as both benchmark gauges reversed intraday losses of at least -1%.
Note: Investors brought stocks after President Xi Jinping said support for China’s private companies was “unwavering” and financial regulators vowed to widen funding channels for smaller firms to defuse the risk linked to shares pledged as collateral for loans.
In Europe, regional indices trade higher across the board following a mixed Asian session and positive U.S futures. Market focus is on Italy with the FTSE MIB outperforming ahead of the E.U Commission’s opinion on the 2019 draft budget plans.
U.S stocks are set to open in the ‘black’ (+0.5%).
Indices: Stoxx600 +0.5% at 352.7, FTSE +0.7% at 6996, DAX +0.6% at 11128, CAC-40 +0.5% at 4947, IBEX-35 +0.7% at 8931, FTSE MIB +0.6% at 18623, SMI 0% at 8769, S&P 500 Futures +0.5%
2. Oil pares some losses, but outlook weak, gold steady
Oil prices have bounced by more than +1% overnight, paring some of yesterday’s -6% plunge, supported by a report of an unexpected decline in U.S commercial crude inventories and record Indian crude imports.
Nevertheless, markets remain on edge, with the IEA warning of “unprecedented uncertainty in oil markets due to a difficult economic environment and political risk.”
Brent crude oil futures are at +$63.39 per barrel, up +86c per barrel, or +1.4% from Tuesday’s close. U.S West Texas Intermediate (WTI) crude futures are up +90c, or +1.7%, at +$54.33 a barrel.
Supporting prices was API data late Tuesday showed that U.S commercial crude inventories last week fell unexpectedly by -1.5M barrels, to +439.2M, in the week to Nov. 16.
Record crude imports by India of almost +5M bpd is also giving ammo to crude ‘bulls.’
Concerned about an emerging production overhang, OPEC is expected to push for cuts at its December 6 meeting – expectations for a supply cut are in the region of -1M to -1.4M bpd.
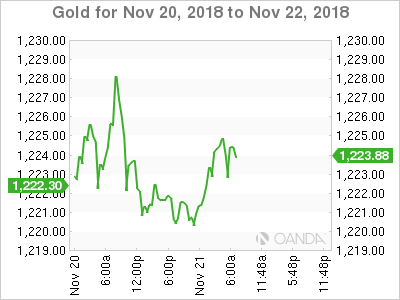
Ahead of the U.S open, gold prices have inched up a tad this morning in subdued trading ahead of U.S Thanksgiving, supported by weakness in dollar and equities. Spot gold is up +0.2% at +$1,224.02 per ounce, while U.S gold futures has also rallied +0.2% to +$1,223.9 per ounce.
3. Bond traders are starting to doubt the Fed again
The Fed has indicated that it plans to hike short-term interest rates three times next year, however, bond traders are increasingly sceptical that it will.
The recent market turmoil has chipped away at traders and investors’ confidence that the Fed can keep increasing rates at the pace it has signalled.
Fed-funds futures yesterday showed the market is pricing in a +10% chance of the Fed raising rates at least three times next year – that’s down from +21% a week ago and +28% a month ago.
While the Fed is expected to raise rates in December, many are now pricing in the Fed easing its foot off the gas peddle.
Market expectations of a Fed rate increase in December stands at +72.3% vs. +78.4% on Oct. 19.
Elsewhere, German Bund yields trade slightly higher, indicating ease in risk aversion, but sentiment remains shaky ahead of the E.C opinion on Italy’s budget plans. The 10-year Bund yield is trading at +0.36%, up +1.4 bps.
4. Dollar higher, but for how long?
USD remains on soft footing on position adjustments in this holiday shortened trading week. Rate differentials are supporting the greenback on deeper pullbacks, however, given some weaker U.S data of late, there is growing expectations that the Fed could take its foot off the gas peddle to some extent in 2019
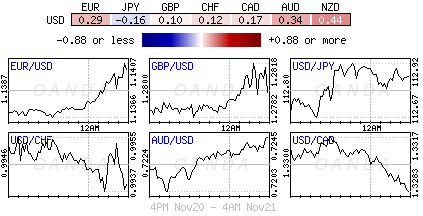
EUR/USD (€1.1386) is a tad higher as Italy seems open to compromise on the budget. Previously, Italy had been adamant that fundamentals of budget would not change. Market now waiting for the E.C report.
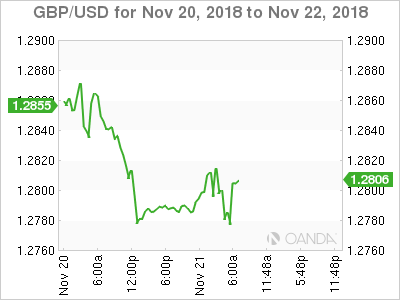
GBP/USD (£1.2779) was initially holding above the £1.28 level, as a leadership challenge threat seemed to wane for the time being with the Dec Parliament vote on Brexit text vote now being eyed as a referendum to her leadership.
Note: PM Theresa May is said to be examining a last-minute plan to scrap the Irish backstop in a bid to win over the Conservative Brexiteers and bring the DUP back onside.
5. UK borrowing lowest in 13-years
Data this morning showed that the U.K. government borrowing in first seven months of the fiscal year was the lowest in 13 years, despite a big rise in government spending in October.
The Office for National Statistics said the U.K government borrowed £26.7B in the seven-months through October, the lowest borrowing for the same period since 2005.
Borrowing in October, though, was the highest for three-years at £8.8B, a reflection of higher government spending on interest payments on its debts and spending on goods and services.
Today’s data would suggest that Treasury chief Philip Hammond will probably meet his budget goals for the full-fiscal year through March.
EUR/USD – Euro Gains Ground, Investors Await U.S Durable Goods Orders
EUR/USD has posted small gains in the Wednesday session, after considerable losses on Tuesday. In the European session, the pair is trading at 1.1411, up 0.37% on the day. In economic news, there are no eurozone releases. There are a host of key events in the United States. Durable goods orders are expected to improve to 0.4%, while core durable goods orders are forecast to post a sharp drop of 2.2%. The U.S. will also release unemployment claims and UoM consumer sentiment. On Thursday, the ECB releases the minutes of its policy meeting in October and the eurozone publishes consumer confidence.
The Italian budget continues to be a bone of contention between Rome and Brussels, and the ball is now in the court of the EU, in particular, the European Commission, which is in charge of EU regulations. The Commission is expected to issue a report on Wednesday that Italy’s draft 2019 budget is in breach of EU deficit and debt rules. Italy’s debt stands at a staggering 132% of GDP, and the EU is concerned that the high-spending budget could cause another debt crisis in the eurozone. The EU could impose severe financial sanctions on Italy, with fines of up to 0.2% of the country’s GDP. Senior Italian officials have vowed not to bend on the budget, but may have to reach a compromise with Brussels.
The ECB remains on track to wind up its stimulus package at the end of the year, but the economic slowdown gripping the eurozone could mean a change in monetary policy. German data is often viewed as a bellwether for the eurozone, and a rare decline in German GDP in the third quarter is an alarm bell that the euorozone economy has hit some headwinds. On Tuesday, ABN-Amro, one of the largest banks in the Netherlands, said that it does not expect the ECB to raise interest rates before March 2020.
GBPUSD Price Action Remains Weak
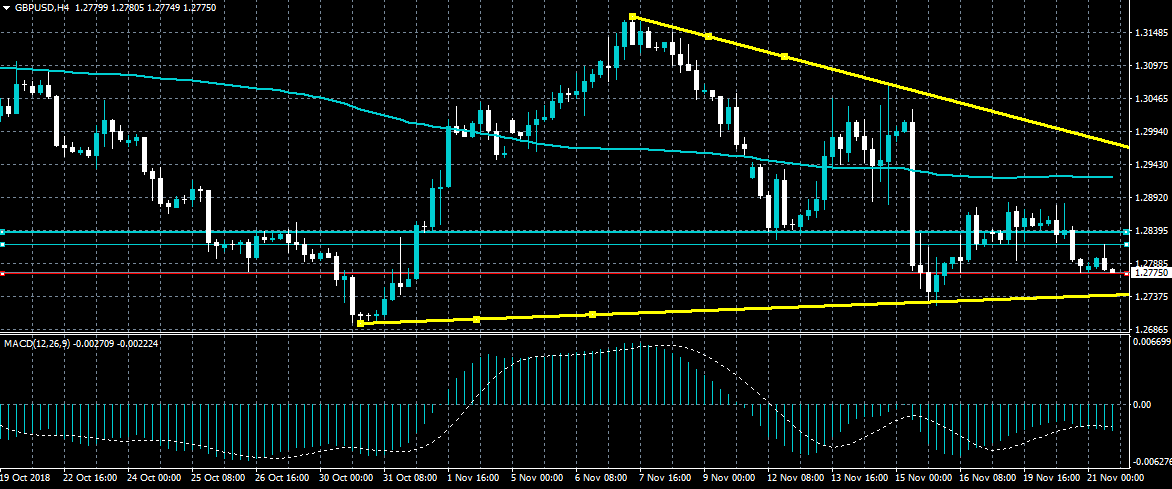
The British pound has once again started to trade below the 1.2800 level against the US dollar, after meeting strong selling interest from the 1.2819 level during the European trading session. Price-action surrounding the GBPUSD remains weak, as Brexit concerns keep any upside rallies in the pair relatively contained. Traders now await key US macroeconomic data and a scheduled speech from Bank of England Governor Mark Carney.
The GBPUSD pair is only intraday bearish while trading below the 1.2790 level, key technical support remains at the 1.2732 and 1.2695 levels.
If the GBPUSD pair continues to trade above the 1.2790 level, key intraday resistance is now found at the 1.2819 and 1.2839 levels.
USDJPY Upside Correction Underway
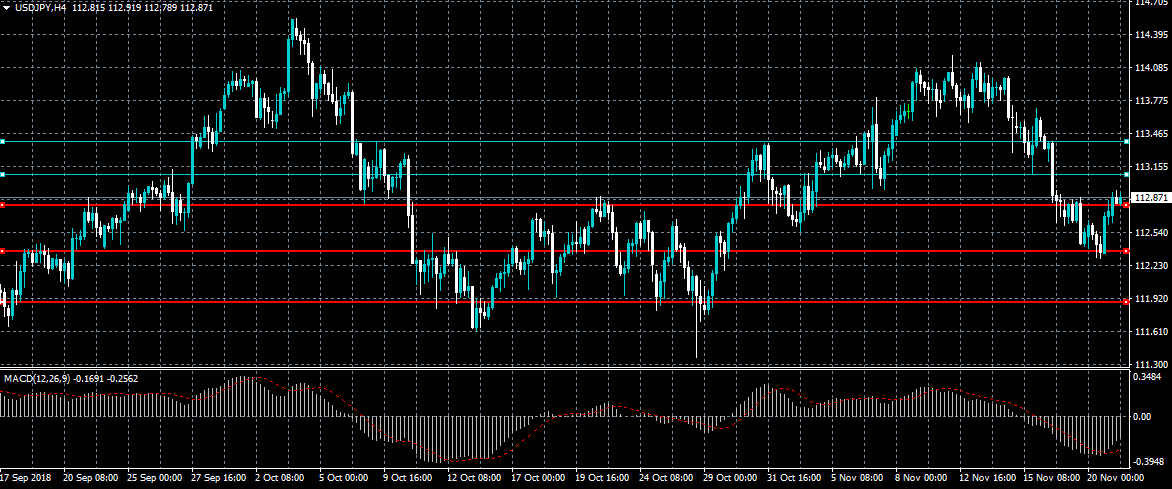
The US dollar is starting to correct higher against the Japanese yen currency after sellers failed to push the price below the 112.00 support level. In the short-term, the upside technical correction in the USDJPY pair may extend towards the 113.10 resistance level. Overall, the direction of the USDJPY pair is likely to influenced by US equity markets and US Durable Goods Orders data later today.
The USDJPY pair is only bearish while trading below the 112.79 level, key technical support is found at the 112.30 and 111.92 levels.
If the USDJPY pair continues to trade above the 112.79 level, buyers may test the 113.10 and 113.40 resistance levels.
ECB Minutes Eyed As Eurozone Growth Remains Sluggish, But Euro Perks Up
The European Central Bank will publish the account of its October 25 monetary policy meeting on Thursday at 12:30 GMT. With the Eurozone economy stuck in the doldrums, investors will be watching for any hint of misgivings by Governing Council members about the bank’s policy normalization plans. In the meantime, though, the euro has managed to find some reprieve from a weaker US dollar to recover around the $1.14 handle.
As a rebound in Eurozone growth momentum becomes ever more elusive, the ECB has so far stayed on course and plans to pull the plug on its asset purchase program at the end of December and begin raising interest rates sometime in Q4 2019. ECB chief, Mario Draghi, insists that the overall risks to the growth outlook are “broadly balanced” despite the sluggish performance during the year.
However, there are some signs that policymakers are becoming a little more receptive to the long stretch of negative economic releases out of the Eurozone. Speaking in Frankfurt earlier this month, Draghi said that if the inflation outlook worsens, this would “be reflected in an adjustment in the expected path of future interest rates”.
The latest growth indicators suggest there is no end yet to the Eurozone’s slow patch. Third quarter GDP growth was dismal, at just 0.2% quarter-on-quarter, and the bloc’s powerhouse, Germany fared even worse, with the economy contracting by 0.2%. However, there is some cautious optimism about the final three months of 2018 and for 2019. The flash estimates of IHS Markit’s closely-watched PMIs are expected to show the growth deceleration stabilizing in November, while most economists in a recent Reuters poll are predicting a rebound in growth in the final three months of the year.
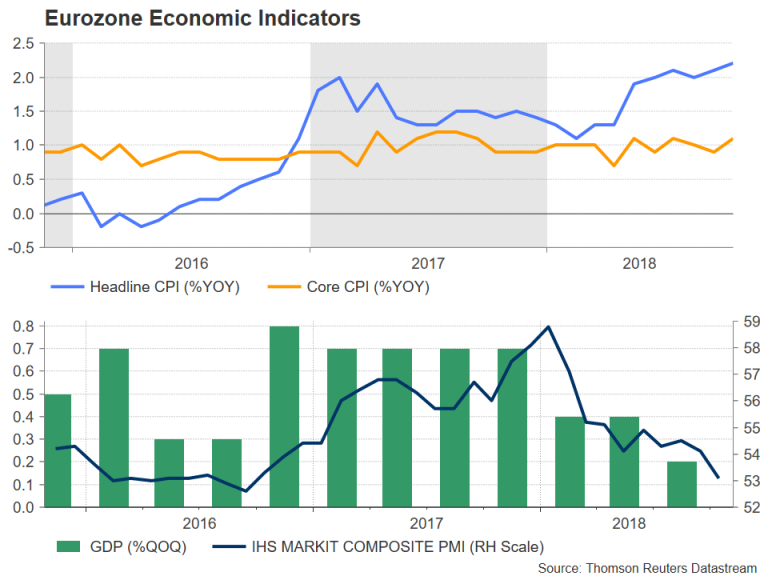
In further support of the ECB’s outlook, inflation data haven’t been as disappointing as those for growth. Headline inflation in the euro area is running slightly above 2% and underlying inflation ticked higher in October. The ECB is also encouraged by falling unemployment and sustained wage increases in the Eurozone.
But even if growth picks up a gear or two and underlying inflationary pressures continue to gather pace, there are still several risks hanging over the region’s economy, which will likely prevail through 2019. US trade protectionism and a slowing Chinese economy are the major external headwinds for the Eurozone economy, given its export-reliant nature. Closer to home, the clash between the Italian government and the European Commission over Italy’s budget deficit targets and the potential for this to blow into a full-blown crisis could dampen business sentiment across the bloc for months to come.
The gloomier growth outlook and heightened investor angst from the above risks have already started to be reflected in interest rate futures markets. Traders are barely fully pricing a rate hike of 10 basis points in the ECB’s deposit rate before the end of 2019, highlighting the growing doubts about how soon the ECB would be in a position to start raising rates.
Thursday’s minutes should provide some insight as to whether policymakers remain firmly committed to their current timeline or are becoming more cautious about their projected rate hike path. Any dovish inclination in the minutes could see euro/dollar breaking below immediate support at the 23.6% Fibonacci retracement of the downleg from 1.1815 to 1.1213 at 1.1355. Not too far below lies the 50-period moving average around 1.1340, which if breached, would shift the near-term bias for the pair back to a bearish one and accelerate the declines towards November’s 16½-month low of 1.1213.
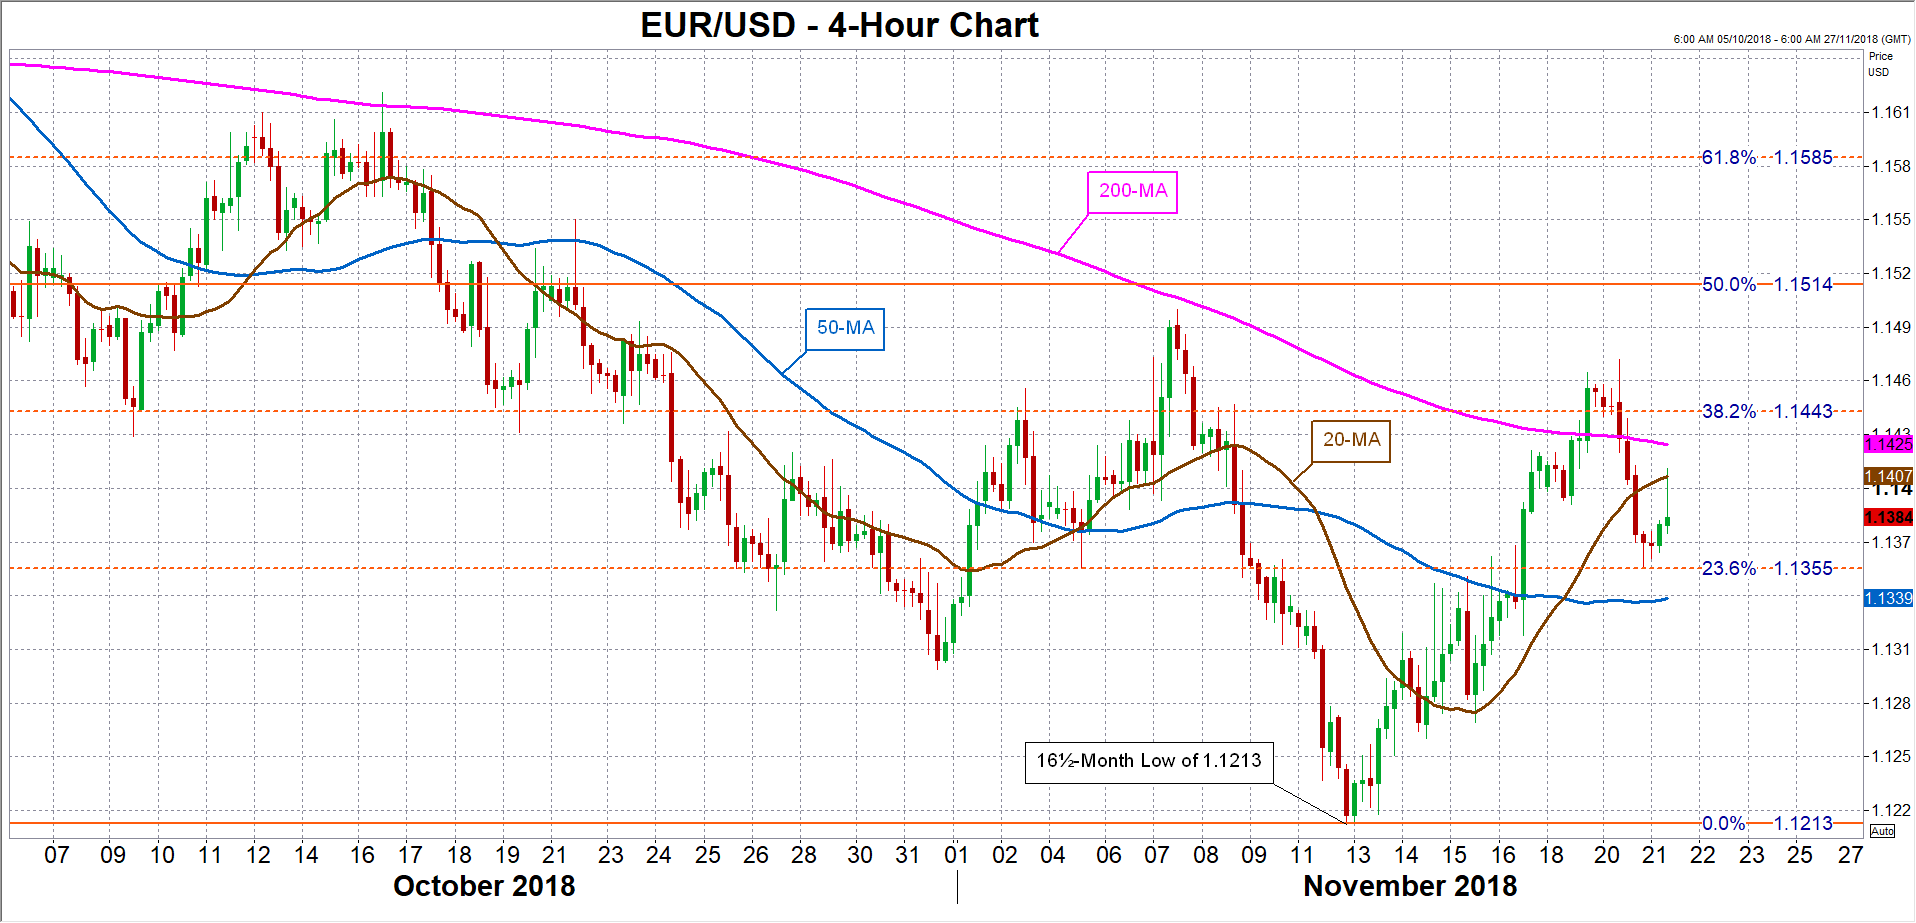
On the other hand, any suggestion in the October meeting account that only a dramatic deterioration of the outlook would steer the ECB off its current course could help the euro resume its recent uptrend versus the greenback. Euro/dollar could climb back towards this week’s two-week high of 1.1472. But first, it would have to overcome immediate resistance at the 20-period moving average just above the psychological 1.14 mark, followed by the 38.2% Fibonacci at 1.1443. Clearing these hurdles would bring into view the 50% Fibonacci of 1.1514. A break above the 50% Fibonacci would strengthen the pair’s upside momentum.
AUDNZD Around 7-Month Lows, Bearish In The Medium Term
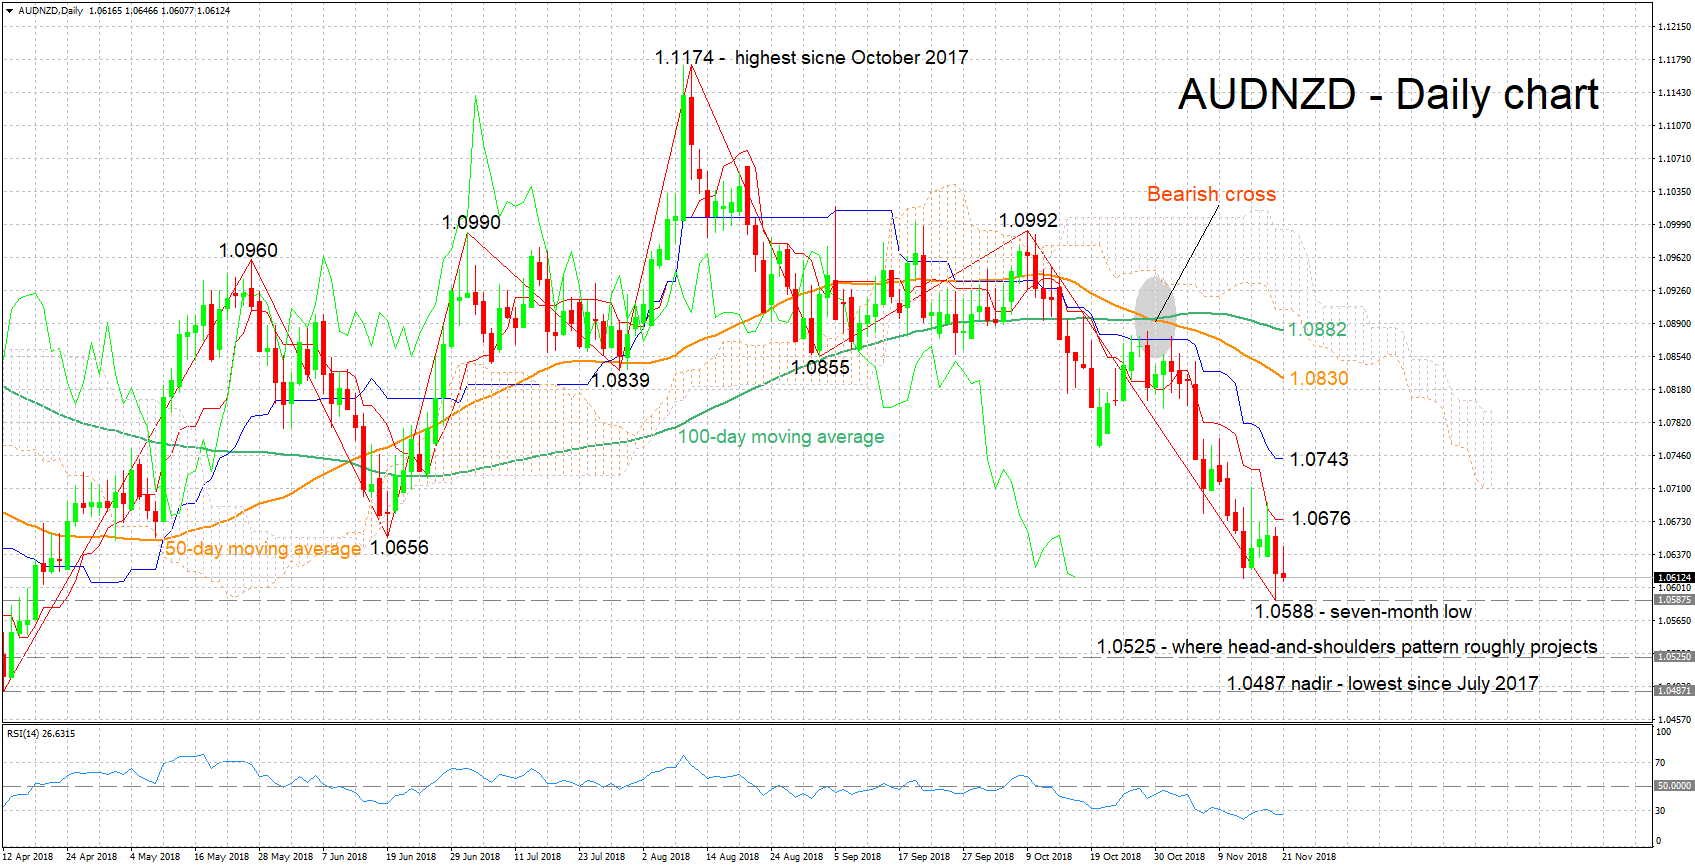
AUDNZD declined considerably from early October’s peak of 1.0992 to eventually hit a seven-month low of 1.0588 on Tuesday. It is currently trading not far above the aforementioned trough.
Attesting to the bearish short-term bias are the negatively aligned Tenkan- and Kijun-sen lines. Notice though that the two appear to have halted their declines, which may be an early sign of weakening negative momentum. Lending credence to this view is the RSI which is moving sideways in bearish territory. Additionally, notice that the indicator has entered oversold levels, suggesting that the selloff may be overextended. Thus, a rebound in the near-term is not to be ruled out.
Initial support to further losses could occur around yesterday’s bottom of 1.0588. Below, the pair’s declines may stall around 1.0525, which is where the head-and-shoulders pattern completed in October roughly projects to. Even lower, the 1.0487 nadir, AUDNZD’s lowest since July 2017, would be eyed.
On the upside, resistance could come around the current level of the Tenkan-sen at 1.0676; the area around this also includes the June bottom of 1.0656. Further above, the Kijun-sen at 1.0743 would come within scope, while even higher, the attention would turn to the 50-day moving average line at 1.0830 – a couple of bottoms from previous months at 1.0839 and 1.0855 are also part of the area around this point.
In terms of the medium-term picture, it is looking negative: the pair is in a downtrend, with trading activity taking place below the 50- and 100-day moving average lines, as well as below the Ichimoku cloud.
Overall, both the short- and medium-term outlooks look bearish at the moment. However, there are signs of easing negative momentum as well as of overstretched losses in the near term.
The Analytical Overview Of The Main Currency Pairs
The EUR/USD currency pair
Technical indicators of the currency pair:
Prev Open: 1.14520
Open: 1.13648
% chg. over the last day: -0.71
Day's range: 1.13571 – 1.14017
52 wk range: 1.1299 – 1.2557
EUR/USD started to descend. The demand for the risky assets is weakened. Yesterday the EUR/USD quotes fell by more than 85 points, updating the local minimums. At the moment EUR is testing 1.14000 level, which became a mirror resistance. The key support is 1.13650. We expect important economic reports from the US. Positions should be opened from the key levels.
The News Feed for 2018.11.21
Core Durable Goods Orders (US) – 15:30 (GMT+2:00);
Secondary Real Estate Reports (US) – 17:00 (GMT+2:00).
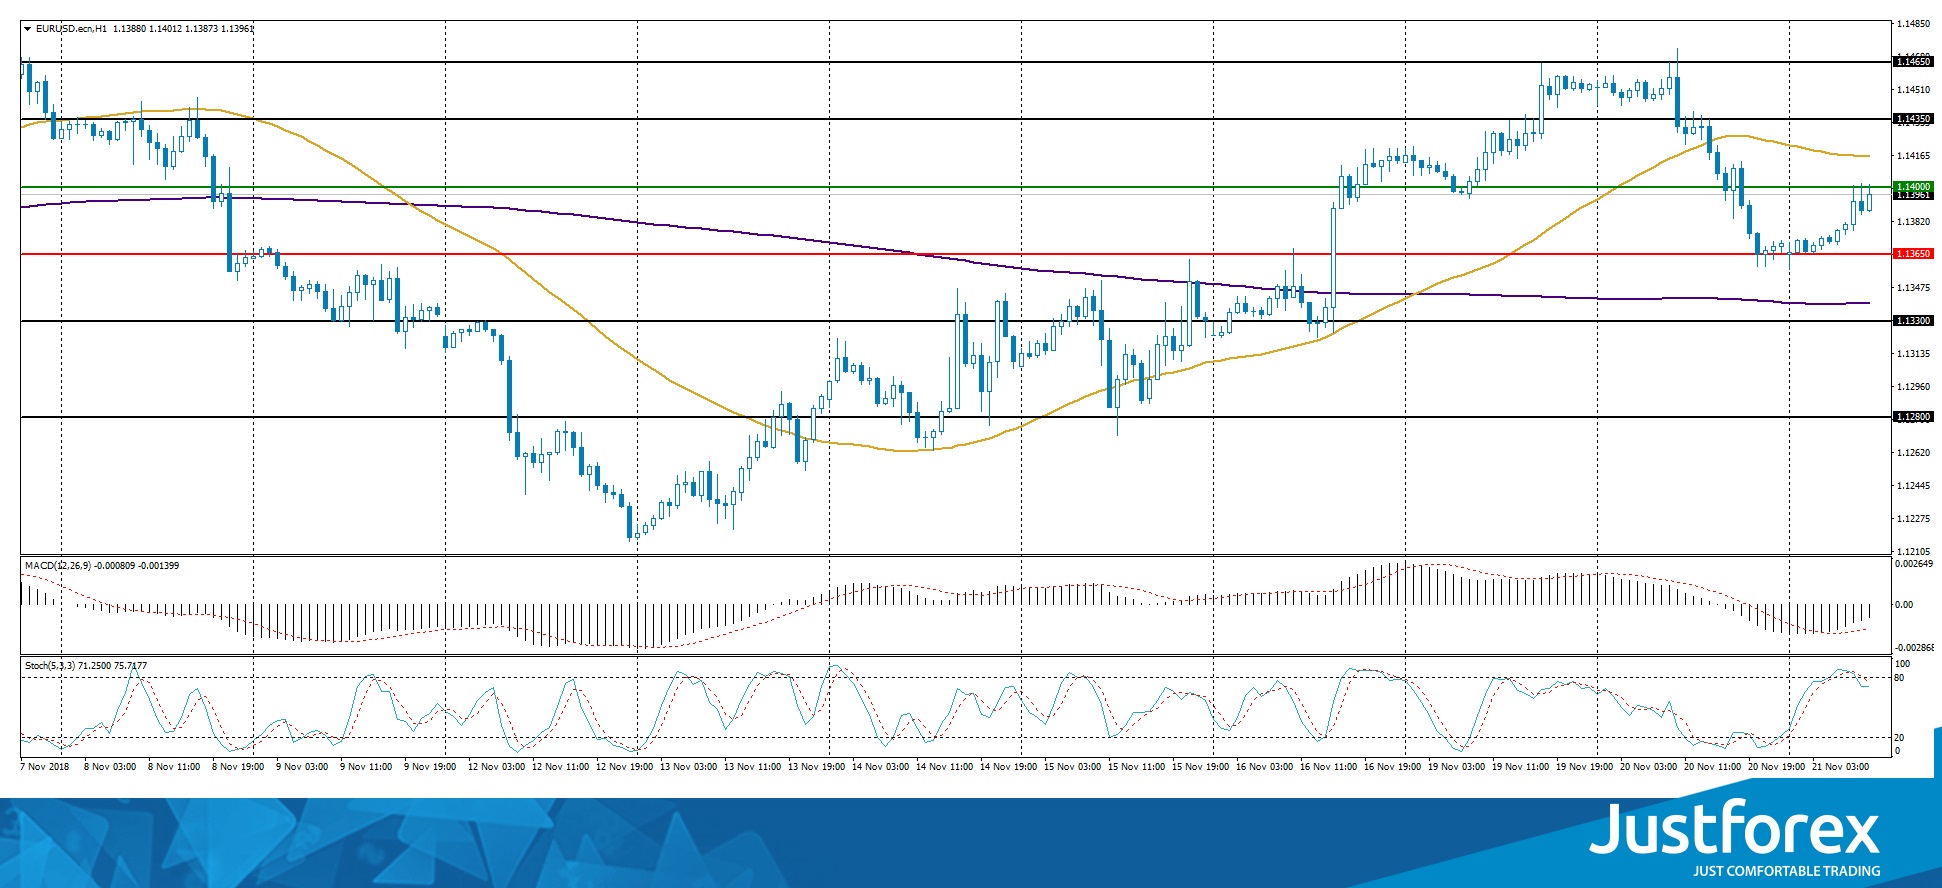
The indicators point toward the power of the buyers, the price fixed above 50 MA and 200 MA.
The MACD histogram is in the positive zone but below the signal line, which give a weak signal towards the purchase of EUR/USD.
The Stochastic Oscillator is in the neutral zone, the %K line is above the %D line, which indicates a bullish sentiment.
Trading recommendations
Support levels: 1.14350, 1.14000, 1.13650
Resistance levels: 1.14750, 1.15000
If the price fixes above 1.14750, expect further growth. Potentially towards 1.15000-1.15200.
Alternatively, the movement will correct toward 1.14200-1.14000.
The GBP/USD currency pair
Technical indicators of the currency pair:
Prev Open: 1.28440
Open: 1.28470
% chg. over the last day: +0.16
Day's range: 1.28330 – 1.28808
52 wk range: 1.2662 – 1.4378
GBP/USD keeps trading in flat. There is no single trend here. The support and resistance levels are 1.28250 and 1.28850. Financial market participants wait for new data regarding Brexit. Positions should be opened from the key levels.
You should keep an eye on the statements by the Head of the Bank of England.
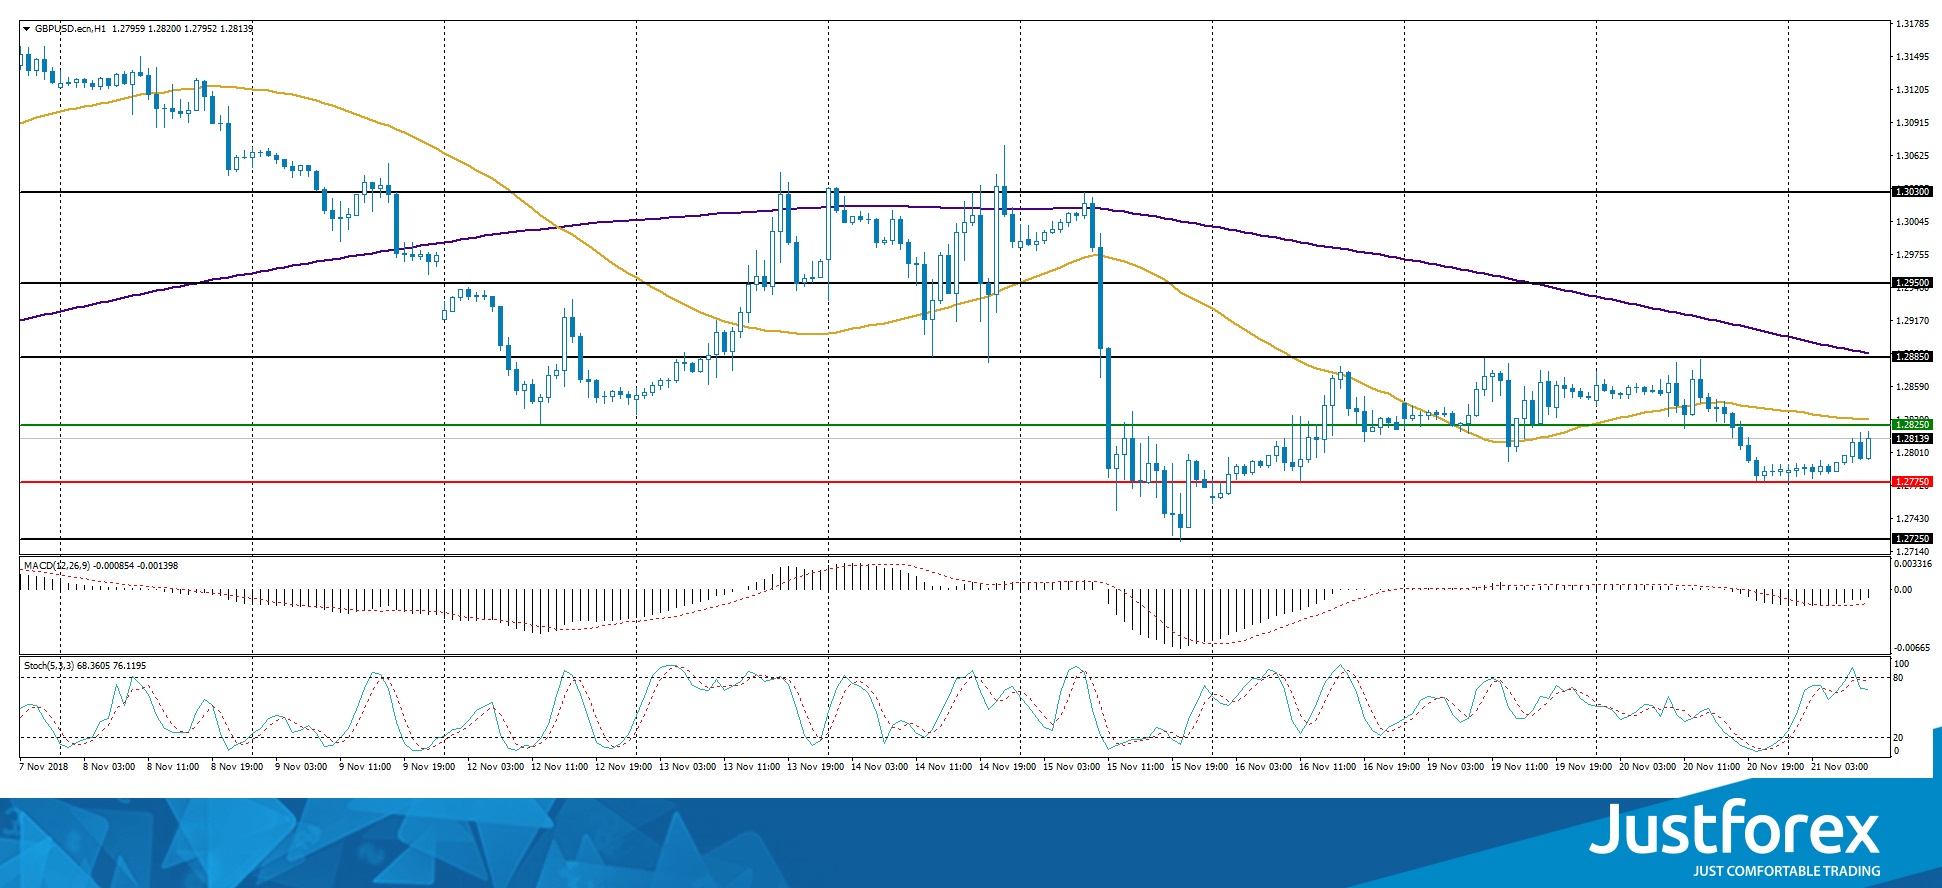
The price is below 50 MA and 200 MA, which indicates the power of the sellers.
The MACD histogram is in the red, but above the signal line, which gives a weak signal towards the sale of GBP/USD.
The Stochastic Oscillator is in around the overbought zone, the %K line started to cross the %D line. There are no signals at the moment.
Trading recommendations
Support levels: 1.28250, 1.27750, 1.27250
Resistance levels: 1.28250, 1.28850, 1.29500
If the price fixes below the support 1.27750, expect further descend of the quotes toward 1.27250-1.27000.
Alternatively, the quotes can grow towards the round 1.28700-1.29000..
The USD/CAD currency pair
Technical indicators of the currency pair:
Prev Open: 1.31693
Open: 1.32920
% chg. over the last day: +1.02
Day's range: 1.32809 – 1.33174
52 wk range: 1.2248 – 1.3387
CAD also weakened against USD yesterday. The USD/CAD quotes grew by 150 points and almost reached the annual maximums. It happened due to the fall of the quotes on oil, wince WTI futures lost 5.5% of their value. At the moment the currency pair is consolidating around 1.32800-1.33150. Positions should be opened from the key levels.
At 15:30(GMT+2) Canada will publish a Wholesale Sales Report.
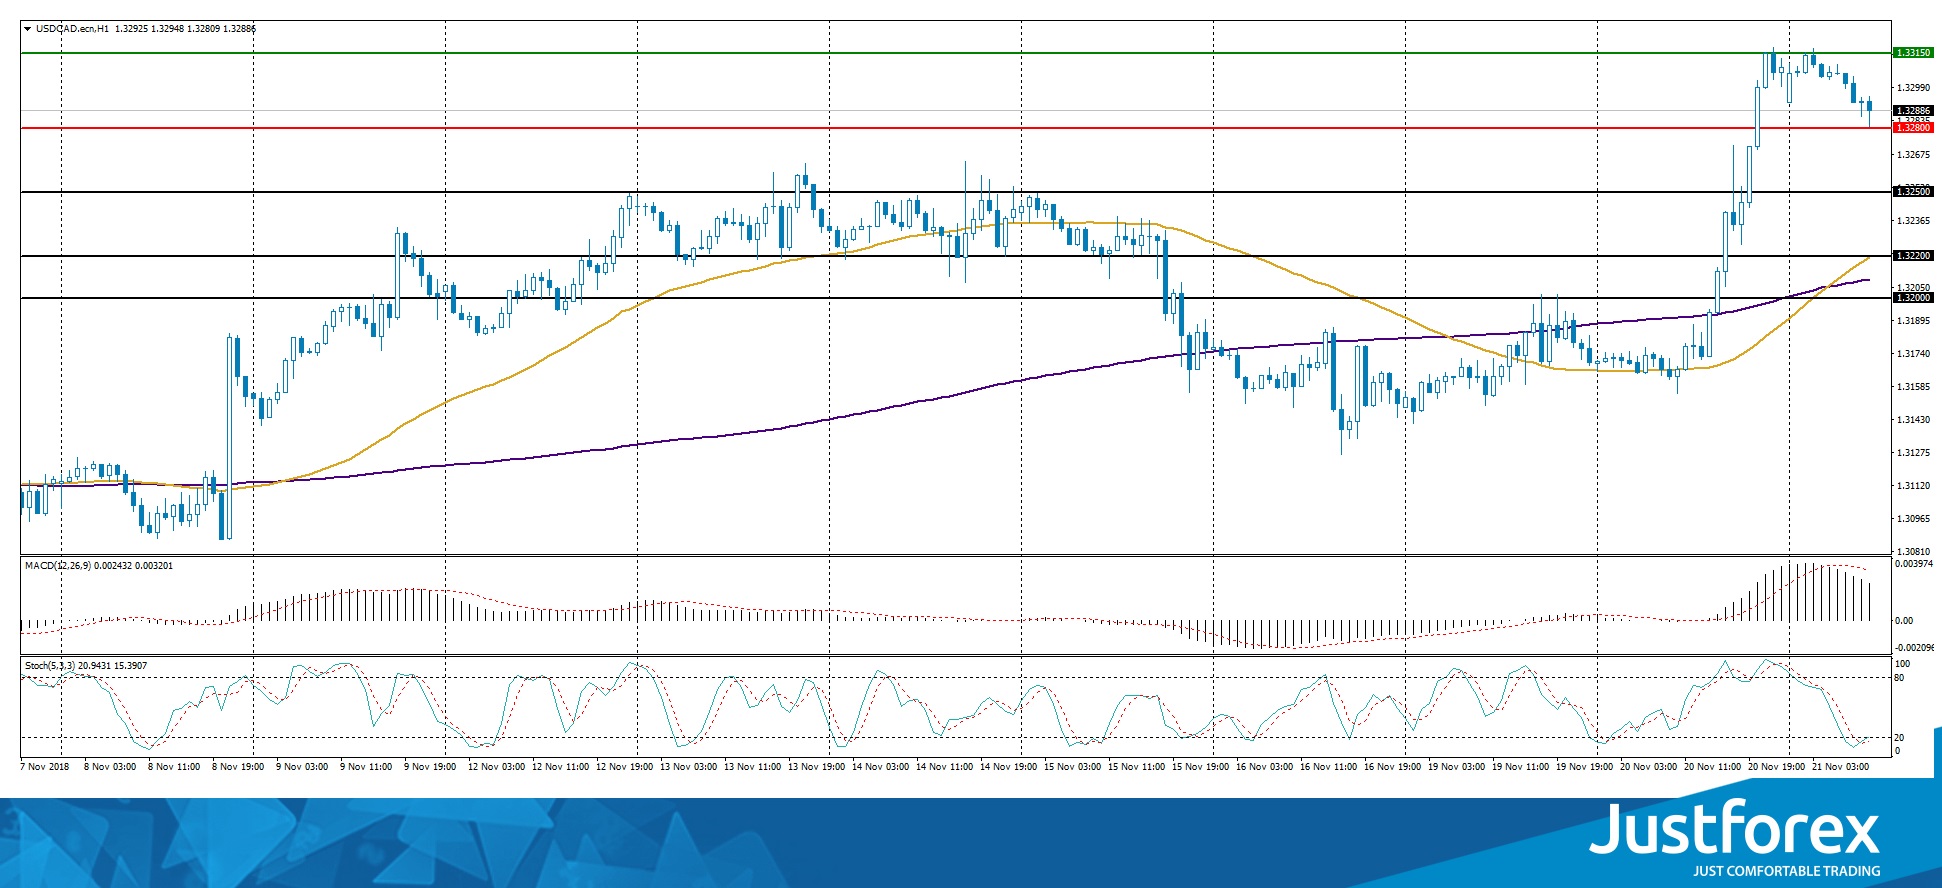
The price fixed above 50 MA and 200 MA, which indicates a bullish mood.
The MACD histogram is in the greed but below the signal line, which provides a weak signal towards a purchase of USD/CAD.
The Stochastic Oscillator is in the oversold zone, the %K line crosses the %D line. There are no signals at the moment.
Trading recommendations
Support levels: 1.32800, 1.32500, 1.32200
Resistance levels: 1.33150, 1.33500, 1.33850
If the price fixes above the resistance level 1.33150, consider buying USD/CAD. The movement will tend toward the round 1.33500-1.33800.
Alternatively, the currency pair can correct to 1.32500-1.32300.
The USD/JPY currency pair
Technical indicators of the currency pair:
Prev Open: 112.517
Open: 112.744
% chg. over the last day: +0.13
Day's range: 112.644 – 112.938
52 wk range: 104.56 – 114.74
The USD/JPY quotes started to grow. At the moment the safe haven currency is testing the resistance level of 112.900. 112.650 is the mirror support. The investors expect important economic reports from the US. We recommend you keep an eye on the trends regarding the US Treasury bonds. Positions should be opened from the key levels.
The news feed is calm for today.
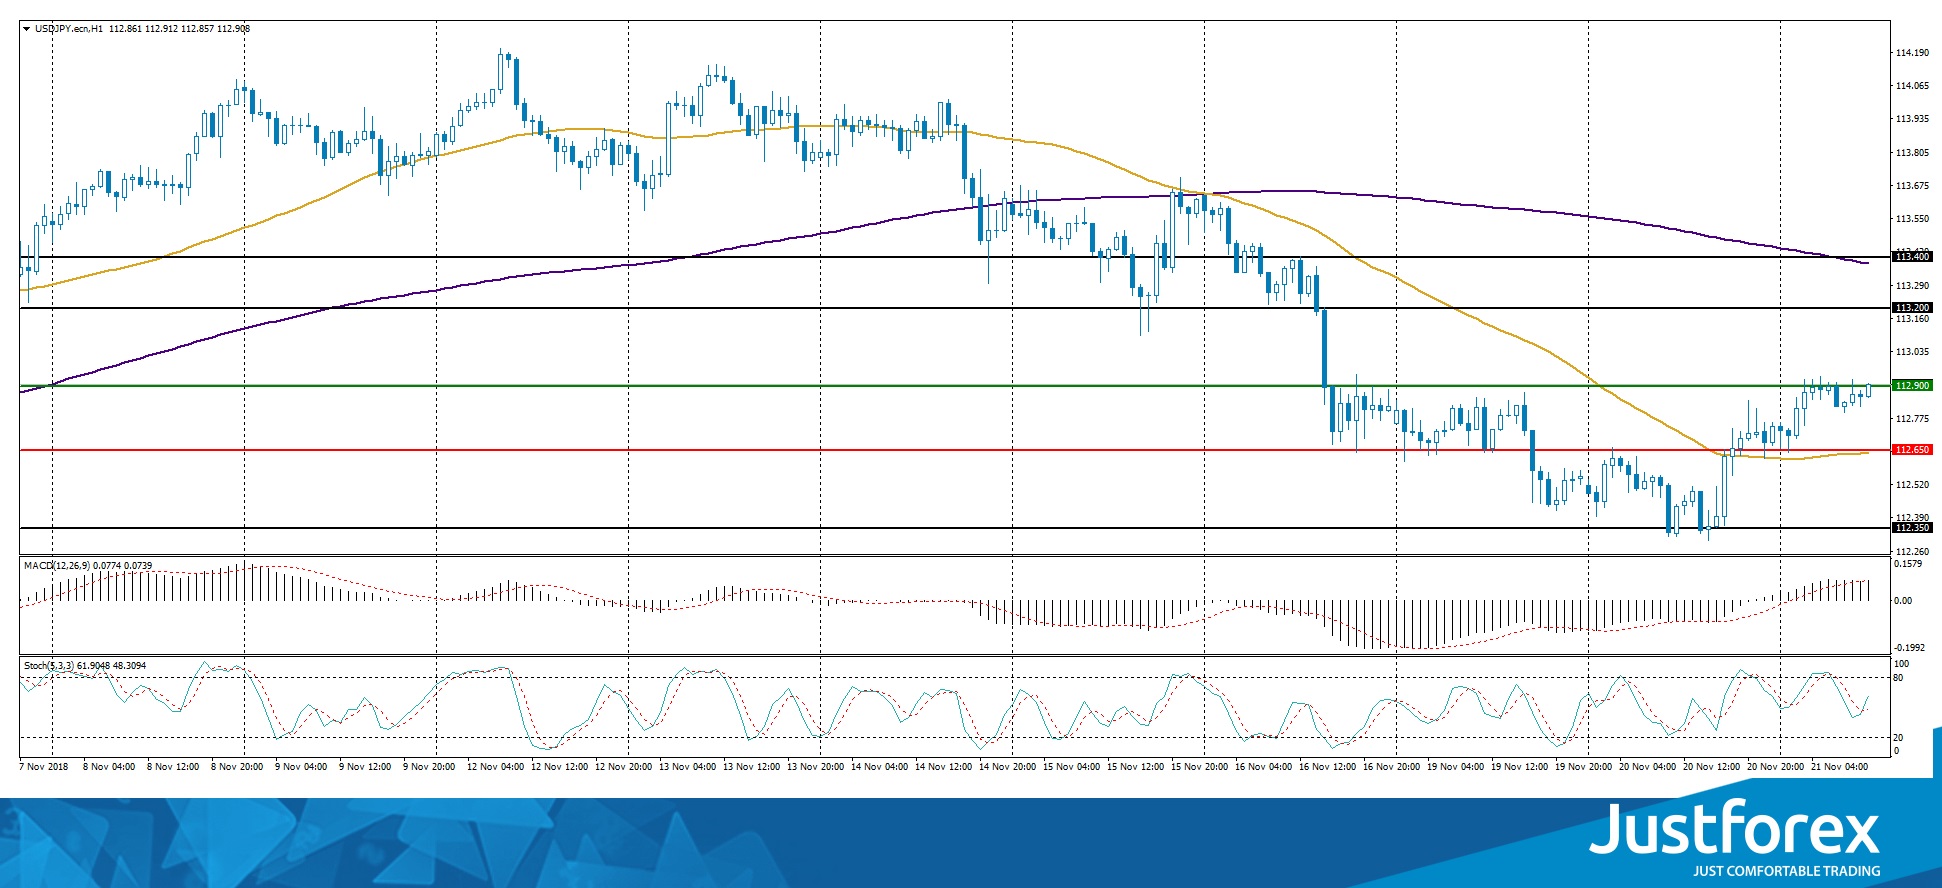
The price is between 50 MA and 200 MA, indicators do not provide signals.
The MACD histogram is in the positive zone and keeps rising, which give a strong signal towards the purchase of USD/JPY.
The Stochastic Oscillator is in the neutral zone, the %K line crosses the %D line. There are no signals.
Trading recommendations
Support levels: 112.650, 112.350
Resistance levels: 112.900, 113.200, 113.400
If the price fixes above the resistance 112.900, expect a further growth of the quotes. The movement will tend toward 113.200-113.400.
Alternatively, USD/JPY can fall towards 112.500-112.350.