Sample Category Title
GBPUSD Lower After UK Inflation Data
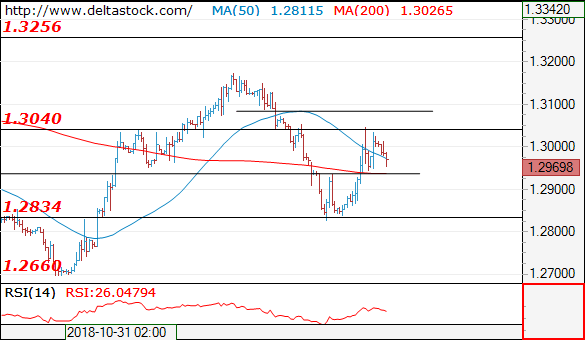
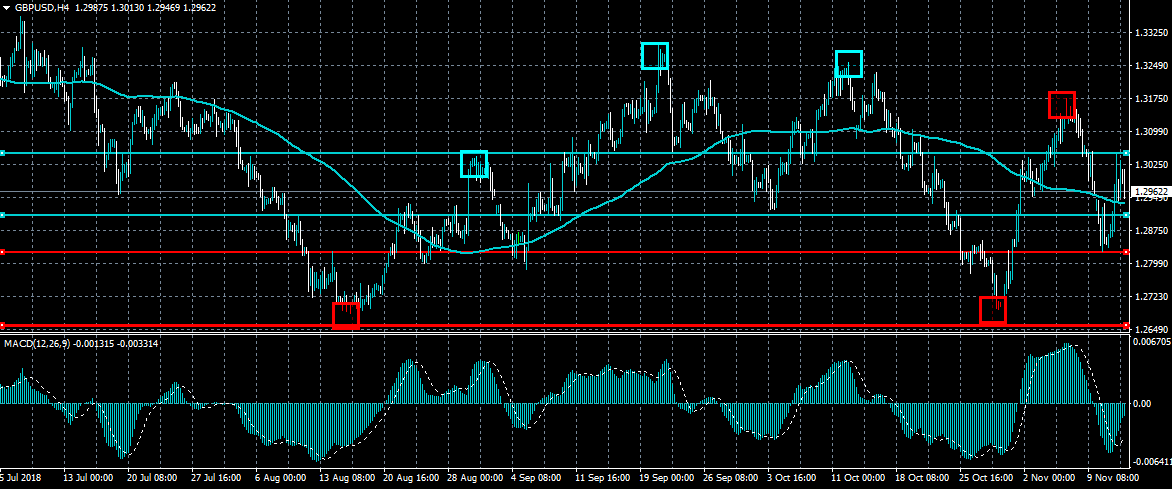
The British pound is moving lower against the US dollar, following the release of worse than monthly CPI inflation data from the United Kingdom economy. If price trades below the 1.2900 support level the intraday trend for the GBPUSD pair will turn bearish and sellers will likely target the current weekly low. It is also worth noting that price may be forming a complex head and shoulders pattern across the lower time frames.
The GBPUSD pair is only intraday bullish while trading above the 1.2900 level, key technical resistance is now found at the 1.3000 and 1.3090 levels.
If the GBPUSD pair trades below the 1.2900 level, key support is found at the 1.2866 and 1.2836 levels.
Aussie Turns Focus On Employment Report To Pick Up Momentum
October's employment report for Australia is likely to attract investors' attention on Thursday at 0030 GMT as the Australian dollar gained some ground in the previous couple of weeks. Stronger figures in employment may provide some further relief to the currency, while seasonally adjusted wage price index rose 2.3% year-on-year in the third quarter, above the 2.1% for the previous quarter and matching market expectations. The quarter-on-quarter rate stayed unchanged at 0.6%. Also, key indicators out of China earlier in the day was in focus for aussie traders.
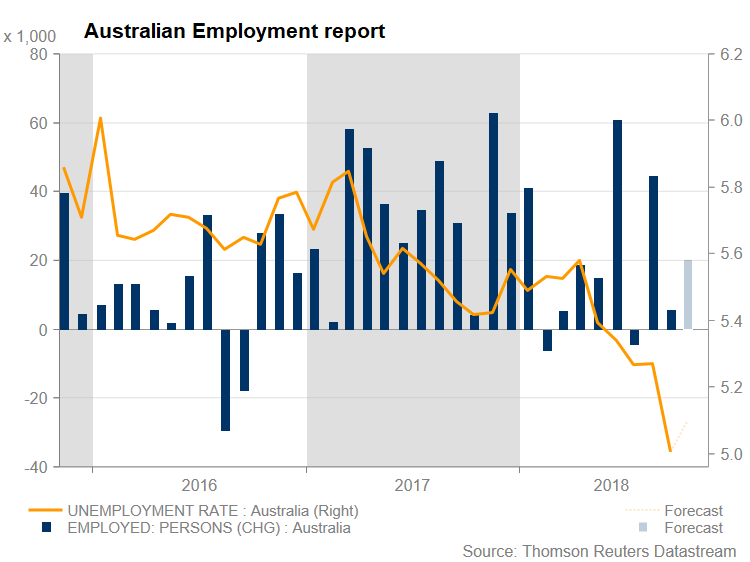
The unemployment rate is forecasted to tick up to 5.1% in October from 5.0% in the preceding month, which was the lowest jobless rate since April 2012. The rise is due to an anticipated increase in the participation rate to 65.5% from 65.4%. The net change in employment is expected to show that the economy gained 20,300 jobs, more than September's 5,600. Stronger than expected figures on Thursday may provide a boost to the aussie, which is trading well above its recent 33-month lows levels versus the greenback.
At the latest statement of the Reserve Bank of Australia (RBA) monetary policy decision, Governor Philip Lowe mentioned that the Australian economy is performing well as GDP growth is holding above 3% and kept the cash rate at 1.50%, where it's been since August 2016. Also, consumer price inflation ticked lower to 1.9% year-on-year in the third quarter of 2018 from 2.1% previously. The latest figure was in line with market expectations, mainly due to a marked slowdown in the cost of housing.
Inflation is expected to pick up over the next couple of years, with the advance likely to be gradual. It is predicted to inch up to 2.25% in 2019 and even higher in the following year. Stronger growth and labour market conditions can be expected to generate a gradual lift in wages growth and inflation over time. The low levels of interest rates are supporting the Australian economy. Further progress in reducing unemployment and having inflation near the target is expected, although this progress is likely to be gradual.
However, despite the recent upside rally in the aussie, having a look at the outlook for the US economy and US Federal Reserve policy, it is expected to decline during the next year. The Fed is predicted to post another hike in December and three hikes in 2019.
So, from the technical point of view, aussie/dollar edged higher to six-week peak in the prior week as easing trade tensions, relief from the US midterms and an upbeat RBA lifted the currency. But the pair could be at risk of a bearish retracement if the employment report disappoints.
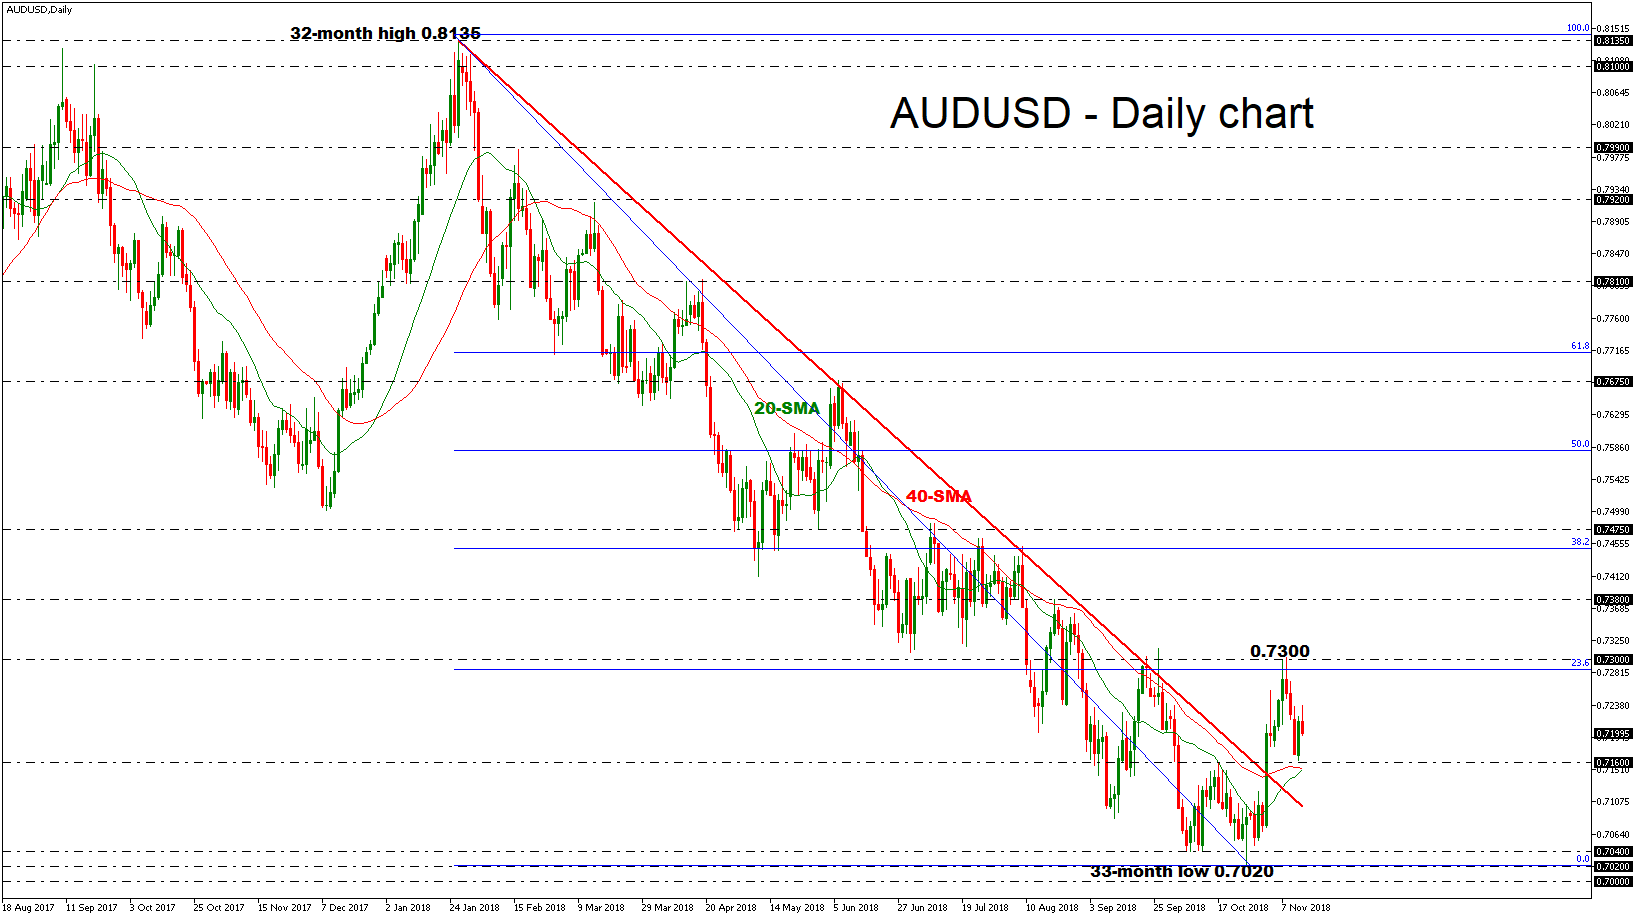
Currently, the pair holds above the 20- and 40-simple moving averages in the daily timeframe, which are ready to create a bullish crossover, indicating further buying interest. Upbeat numbers on employment are likely to propel the price higher towards the 0.7300 handle, which stands near the 23.6% Fibonacci retracement level of the downleg from 0.8135 to 0.7020. More bullish movement would drive the pair towards the 0.7380 resistance.
On the downside, in case of disappointing figures or rising trade risks, price action is likely to challenge again the 0.7040 support level, after dropping below 0.7160. A drop below 0.7040 could send prices until the 33-month low of 0.7020.
Pound Wavers On Brexit Milestone
Pound wavers on Brexit milestone
A Brexit deal is on the table, but will it pass this afternoon’s Cabinet meeting? The cable is currently trading sideways, meaning traders don’t know: we expect GBP/USD to head along 1.2840.
Under the proposed deal, the UK would remain within European Union rules for the environment, state aid, employment law and competition. Is that really Brexit? Well, at least the UK would not pay EU member contributions anymore. So, it is highly likely that Brexiteers will oppose this particular deal, which would turn out GBP-negative. If the deal manages to pass, a special European Council meeting would take place on 25 November to ratify. For now, we assume that the UK (along with Northern Ireland) will remain in the common market and that the end-November 2020 deadline should be the next deadline to look after March 2019, when the UK will leave the EU – with or without a deal.
Italy dampens Euro
Despite warnings from the European Commission, Italy’s government is sticking to its proposed budget – which sports a deficit of 2.40% of GDP, i.e. USD 50-80 billion. If the coalition sticks to its promises of a minimum income for the poor, a flat tax rate of 15-20% and a pension reform, Italian treasury yields will keep rising and the budget simply will not add up. For now, investors remain cautious, as 10-year BTP-Bund spreads remains their highest in 5 years, at 3.53%. The situation is also pushing EUR/USD downward, heading toward 1.1250.
We assume the single currency is not immune to another shock. There is a high likelihood that the EU won’t implement sanctions short-term, as this would fuel anti-EU passions and add additional pressure on the single currency. However, the Italian government might back down on its full plan. The European Central Bank’s reaction is unclear, but supporting Italy would be counter to its monetary normalization path.
EURUSD Analysis: Trades Between SMAs
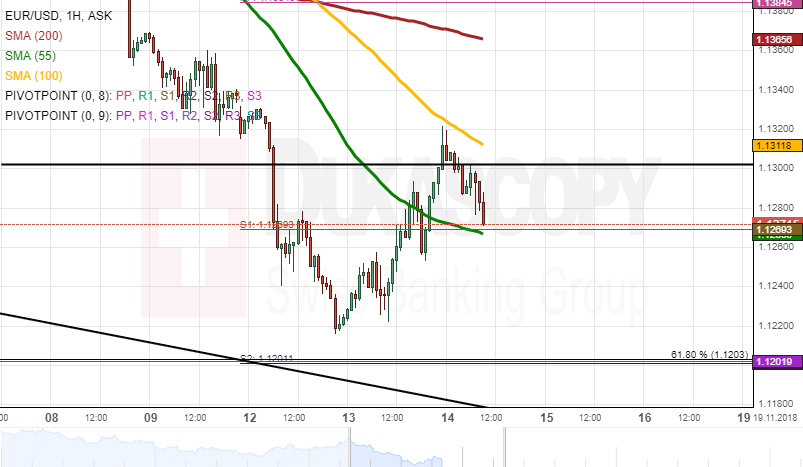
During the previous trading session, the European Single Currency recovered itself to end the trading session at the 1.1304 mark. During Wednesday's morning hours, the currency exchange rate was located near the horizontal pattern line at 1.1290.
In regards to the near-term future, most likely, the currency exchange rate will move downside towards the weekly S2 at 1.1201 due to the resistances of the horizontal pattern line at 1.3000 and the 100-hour SMA at the 1.1317 mark.
On the other side, the supports of the 55-hour SMA at 1.1269 and the weekly S1 at 1.1269 could push the currency pair to trade in the horizontal pattern at the 1.1350 level.
GBPUSD Analysis: Supported By 100-Hour SMA
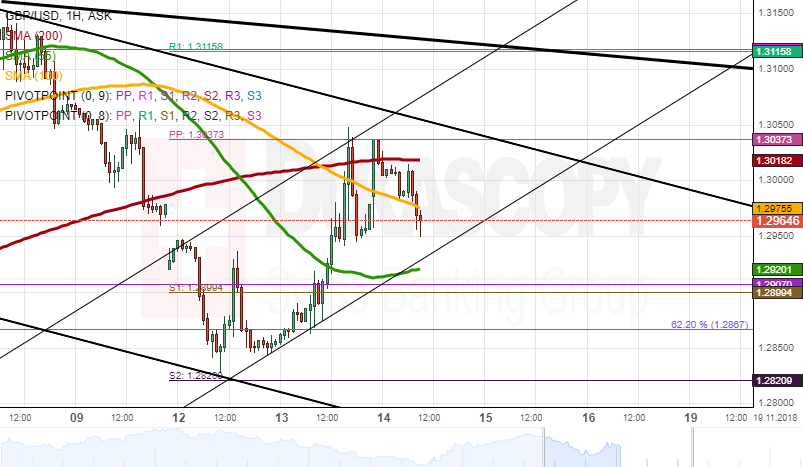
During Tuesday's trading session, the currency rate broke the resistances of the 100-hour and the 200-hour SMAs to end the day at 1.3000. During Wednesday's morning hours, the British pound was located between the 100-hour and the 200-hour SMAs to trade at the 1.2987 mark.
In regards to the near-term future, most likely, the British Pound will move sideways to stay at the 1.2950 level due to the resistances of the weekly pivot point at 1.3037 and the 200-hour simple moving average at the 1.3018 mark.
On the other side, the rate might break the resistances to trade at the 1.3050 level due to the support of the 100-hour simple moving average during today's UK CPI data release at 9:30 GMT.
USDJPY Analysis: Trades At 113.80 Level
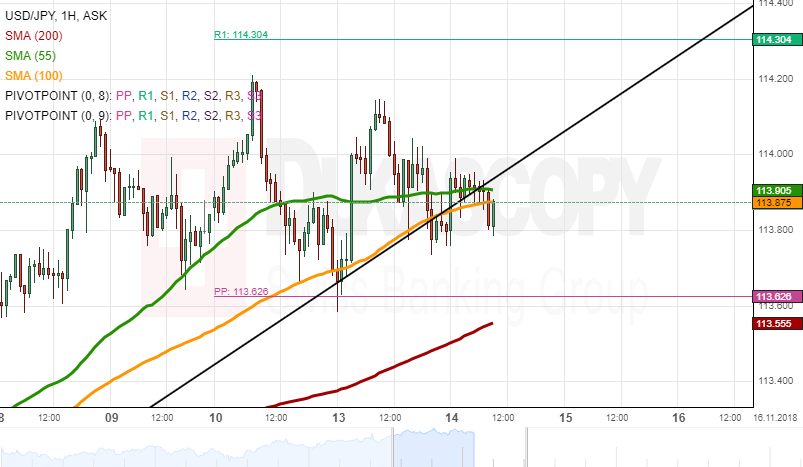
During Tuesday's trading session, the currency exchange rate passed through the supports of the 55-hour and the 100-hour SMAs to end the trading session near the bottom boundary of the ascending medium pattern line at the 113.75 mark. On Wednesday morning, the US Dollar was located at the 113.87 mark.
In regards to the near-term future, most likely, the US Dollar trade sideways at the 114.00 mark. The 100-hour SMA should support the rate during the trading session.
On the other side, the US Dollar might depreciate against the Japanese Yen during today's US CPI data release at 13:30 GMT to push the rate to trade below the 100-hour simple moving average at the 113.60 level.
XAUUSD Analysis: Resisted By 55-Hour SMA
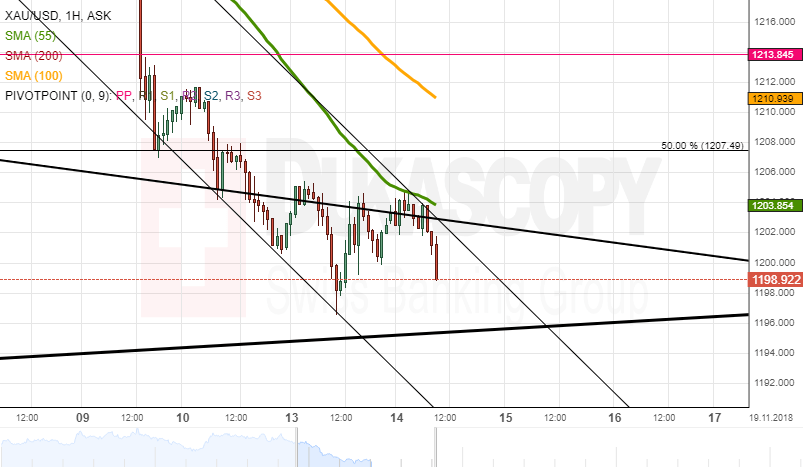
During Tuesday's trading session, the yellow metal was trading downside to end the trading session at the 1,202.45 mark. On Wednesday morning, the gold was resisted by the 55-hour simple moving average to trade at the 1,203.41 mark.
In regards to the near-term future, the gold will move sideways to trade between the 50.00% Fibonacci retracement level at the 1,207.49 mark and the bottom boundary of the ascending large pattern line at the 1,195.00 mark.
However, the yellow metal could depreciate against the US Dollar during today's US CPI data release at 13:30 GMT to push the gold the trade near the monthly pivot point at the 1,213.84 mark.
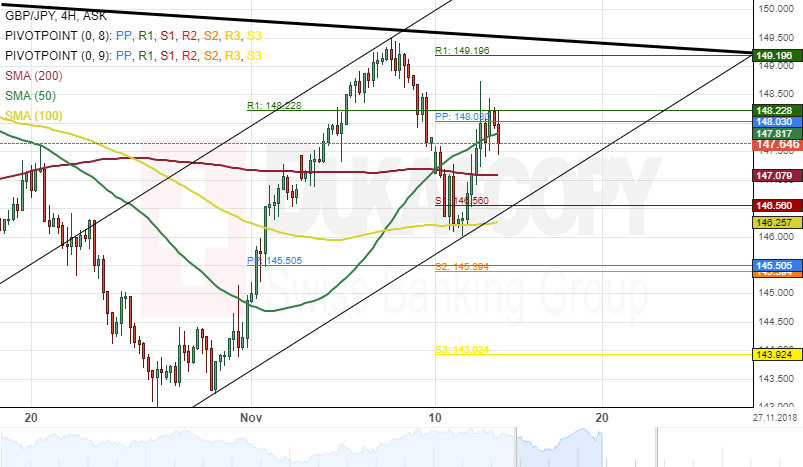
GBP/JPY 4H Chart: Remains Near Resistance Cluster
The British Pound has been appreciating against the Japanese Yen after the currency pair reversed from the lower boundary of an ascending channel at 143.00 on October 31.
The exchange rate is trading near a resistance cluster formed by the combination of the weekly and the monthly pivot points at 148.22 during the morning hours of Wednesday trading session.
If this resistance cluster as mentioned above holds, the currency exchange rate could aim at the bottom boundary of the uptrend channel at 146.50 within this session.
On the other hand, if the pair passes the resistance line, the next target for the rate will be near the upper boundary of a dominant descending channel at 149.19 during the following trading sessions.
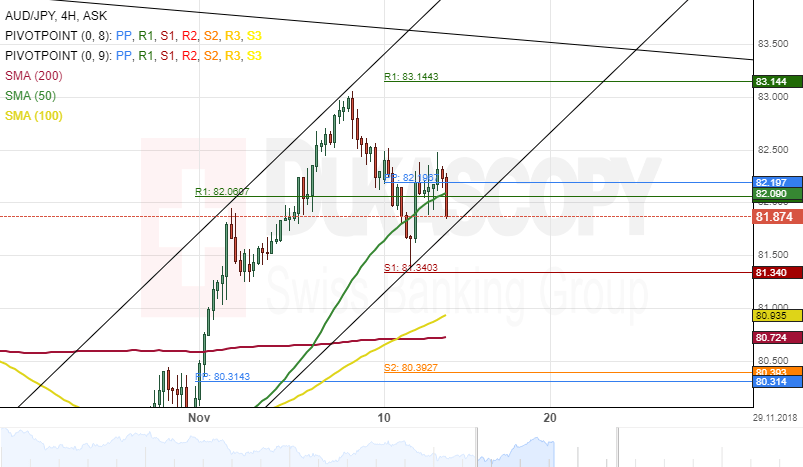
AUD/JPY 4H Chart: Breaches Resistance Cluster
The Australian Dollar has been gaining strength against the Japanese Yen after the currency pair bounced off the bottom border of an ascending channel pattern at 78.50 on October 26.
Currently, the exchange rate is trading above a support cluster formed by the combination of the weekly, the monthly PPs and the 50-hour simple moving average at 82.07.
If this support cluster as mentioned earlier holds, the currency exchange rate will aim at the weekly R1 at 83.14 within this session.
However, the AUD/JPY pair could reverse from the current price level and breaks the ascending channel pattern today.
Forex Technical Analysis: EUR/USD, USD/JPY, GBP/USD
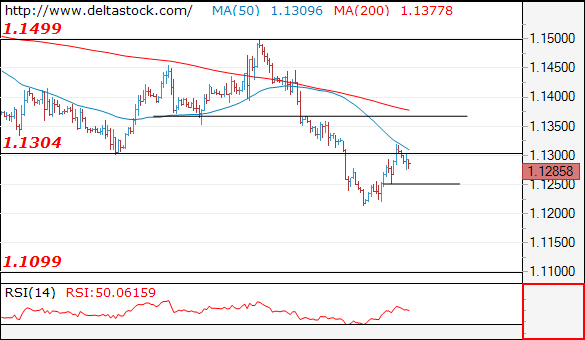
EUR/USD
Current level - 1.1285
The rebound after 1.1213 should be considered corrective, preceding a slide towards 1.1100 area. Crucial on the upside is 1.1360 and trigger is seen at 1.1250.
| Resistance | Support | ||
| intraday | intraweek | intraday | intraweek |
| 1.1300 | 1.1360 | 1.1250 | 1.1100 |
| 1.1360 | 1.1500 | 1.1210 | 1.0850 |
USD/JPY
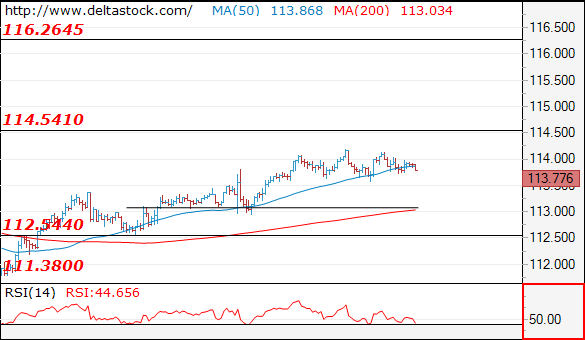
Current level - 113.77
The overall outlook remains positive, for a break through 114.50, en route to 116.20 area. Crucial on the downside is 112.90.
| Resistance | Support | ||
| intraday | intraweek | intraday | intraweek |
| 114.50 | 114.50 | 113.60 | 111.60 |
| 115.50 | 116.20 | 112.90 | 110.40 |
GBP/USD
Current level - 1.2968
Trading is caught in a tight range between 1.2940 and 1.3040 and although there is an intraday risk of a spike to 1.3080, the overall outlook is negative, for a dip to 1.2830.
| Resistance | Support | ||
| intraday | intraweek | intraday | intraweek |
| 1.3040 | 1.3250 | 1.2940 | 1.2660 |
| 1.3080 | 1.3440 | 1.2830 | 1.2570 |