

Sample Category Title
European Indices Rebound Despite Continued Trade Tensions
Notes/Observations
- German inflation confirmed as slowing in June, while France was revised lower
- Trump continues divisive stance at NATO
- President Trump to meet PM May amid Brexit 'turmoil'
Asia:
- Asian stocks boosted by comments from a White House Aide noting the US has held high level talks with China, open to further discussions on trade, which later has been firmly denied by China's Mofcom
- Bank of Korea kept rates on hold but with a dissenter, cuts GDP outlook
Europe:
- Comcast raises offer from SKY once again trumping raised offer from 21st Century Fox.
- PM May Office tweet “12 key principles that we will use in our EU negotiations”
- BOE Q2 Credit Conditions & Bank Liabilities Survey: Lenders expect unchanged availability of loans to businesses in next 3 months Energy -IEA maintains 2018 global demand growth forecast at 1.4Mbpd
Economic Data:
- (NL) Netherlands May Trade Balance: €5.03B v €3.8B prior
- (SG) Singapore May Retail Sales M/M: +0.1% v -0.2% prior; Y/Y: 0.1% v 0.5%e
- *(DE) GERMANY JUNE FINAL CPI M/M: 0.1% V 0.1%E; Y/Y: 2.1% V 2.1%E
- (DE) Germany Jun Final CPI EU Harmonized M/M: 0.1% v 0.1%e; Y/Y: 2.1% v 2.1%e
- *(FR) FRANCE JUNE FINAL CPI M/M: 0.0% V 0.1%E; Y/Y: 2.0% V 2.1%E
- (FR) France June Final CPI EU Harmonized M/M: 0.0% v 0.1%e; Y/Y: 2.3% v 2.4%e, CPI Ex-Tobacco Index: 103.07 v 103.15e
- (CN) China Jun Foreign Direct Investment (FDI) YTD y/y: 0.3% v 1.3% prior
- *(SE) SWEDEN JUNE CPI M/M: 0.2% V 0.3%E; Y/Y: 2.1% V 2.1%E
- (EU) EURO ZONE MAY INDUSTRIAL PRODUCTION M/M: 1.3% V 1.2%E; Y/Y: 2.4% V 2.4%E
Fixed Income Issuance:
- (IE) IRELAND DEBT AGENCY (NTMA) SELLS TOTAL €1.25B VS. €1.25B INDICATED IN 2028 AND 2045 IGB BONDS
- (IT) ITALY DEBT AGENCY (TESORO) SELLS TOTAL €6.5B VS. €4.5-6.5B IN 2021, 2025, 2033 AND 2038 BTP BONDS
SPEAKERS/FIXED INCOME/FX/COMMODITIES/ERRATUM
Equities
- Indices [Stoxx50 +0.1% at 3,429, FTSE +0.6% at 7,636, DAX +0.4% at 12,461, CAC-40 +0.3% at 5,370; IBEX-35 +0.1% at 9,741, FTSE MIB +0.2% at 21,746, SMI +0.4% at 8,720, S&P 500 Futures +0.3%]
- Market Focal Points/Key Themes: European indices opened higher across the board but later reversed to trade mixed as the session wore on; concerns over trade keep risk sentiment muted; energy sector impacted, ongoing discussions regarding Iran sanctions; consumer discretionary remains best performing sector mostly due to airlines; Sky receives better offer from Comcast, with Fox noting new offer by as yet not providing counter; Asos tumbles after missing earnings expectations; earnings expected in upcoming US session include Delta Airlines and Brunello Cucinelli
Equities
- Consumer discretionary: Asos ASC.UK -11.3% (results), Bang & Olufsen BO.DK +2.3% (results), DFS Furniture DFS.UK -5.3% (trading update), Dunelm Group DNLM.UK -0.2% (results), Mears MER.UK +1.9% (rejects proposal), Norwegian Air NAS.NO +7.9% (results), Sky SKY.UK +1.8% (improved offer from Comcast)
- Consumer staples: Suedzucker SZU.DE +1.3% (results)
- Financials: CNP CNP.FR +1.1%(CEO resigns)
- Industrials: BMW BMW.DE +0.8% (monthly sales, stake increase), Fraport FRA.DE +0.3% (traffic), Gerresheimer GXI.DE +8.0% (outlook), Maersk MAERSKB.DK +3.0% (analyst action)
- Healthcare: Onxeo ONXEO.FR 13.0% (study results)
- Materials: Bellzone Mining BZM.UK -25.0%(placement)
- Technology: Computacenter CCC.UK +6.3% (trading update)
Speakers
- (CN) China Commerce Ministry (MOFCOM) US accusation on China's IP theft is 'groundless'; Impact of trade tensions to show in H2 this year
- (KR) South Korea President Moon: No difference between North Korea, South Korea and US on concept of denuclearization
Currencies
- Yuan has its first Death Cross since 2015 devaluation
- Swedish krona pared gains after CPI data and Riksbank minutes
Fixed Income
- Bund Futures trade 7 ticks lower at 162.59 following softer German and French inflation data. Upside targets 163.25 followed by 163.85, while a return lower targets the 159.75 level.
- Gilt futures trade at 123.02 higher by 3 ticks ahead of the White Paper release. Support continues stands at 121.75 then 120.25, with upside resistance at 123.85 then 124.25.
- Thursday's liquidity report showed Wednesday's excess liquidity fell from €1.868T to €1.867T. Use of the marginal lending facility rose from €31M to €56M.
- Corporate issuance saw Honda as the lone issuer in the primary market
Looking Ahead
- 05:30 (ZA) South Africa May Mining Production M/M: No est v -2.0% prior; Y/Y: No est v -4.3% prior
- 06:00 (IE) Ireland Jun CPI M/M: No est v 0.6% prior; Y/Y: No est v 0.4% prior, CPI EU Harmonized M/M: No est v 0.6% prior; Y/Y: No est v 0.7% prior
- 06:00 (IL) Israel Jun Trade Balance: No est v -$2.4B prior
- 07:00 (ZA) South Africa May Manufacturing Production M/M: No est v -0.6% prior; Y/Y: No est v 1.1% prior
- 07:00 (UR) Ukraine Central Bank Interest Rate Decision: Expected to leave Key Rate unchanged at 17.00%
- 08:00 (BR) Brazil May Retail Sales M/M: No est v 1.0% prior; Y/Y: No est v 0.6% prior, Broad Retail Sales M/M: No est v 1.3% prior; Y/Y: No est v 8.6% prior
- 08:00 (IN) Jun CPI Y/Y: 5.3%e v 4.9% prior
- 08:00 (IN) India May Industrial Production Y/Y: 4.5%e v 4.9% prior
- 08:05 (UK) Baltic Dry Bulk Index
- 08:30 (US) Jun CPI M/M: 0.2%e v 0.2% prior; Y/Y: 2.9%e v 2.8% prior, CPI Ex Food and Energy M/M: 0.2%e v 0.2% prior; Y/Y: 2.3%e v 2.2% prior, CPI Index NSA: 252.092e v 251.588 prior, CPI Core Index SA: 257.361e v 256.889 prior
- 08:30 (US) Initial Jobless Claims: 225Ke v 231K prior; Continuing Claims: 1.730Ke v 1.739M prior
- 08:30 (US) Weekly USDA Net Export Sales
- 08:30 (US) Jun Real Avg Weekly Earnings Y/Y: No est v 0.3% prior; Real Avg Hourly Earning Y/Y: No est v 0.0% prior
- 08:30 (CA) Canada May New Housing Price Index M/M: 0.1%e v 0.0% prior; Y/Y: 1.0%e v 1.6% prior
- 08:30 (CA) Canada Jun Teranet/National Bank HPI M/M: No est v 1.0% prior; Y/Y: No est v 4.5% prior
- 09:00 (MX) Mexico May Industrial Production SA M/M: 0.6%e v -0.4% prior; Y/Y: 0.8%e v 3.8% prior, Manufacturing Production NSA Y/Y: No est v 5.6% prior
- 09:00 (RU) Russia Gold and Forex Reserve w/e July 6th: No est v $ prior
- 09:00 (RU) Russia May Trade Balance: No est v $15.3B prior
- 10:30 (US) Weekly EIA Natural Gas Inventories
- 12:00 (US) USDA World Agricultural Supply and Demand Estimate (WASDE) Crop Report
- 14:00 (US) Jun Monthly Budget Statement: -$80.0Be v -$146.8B prior
- Share on Twitter Share on Facebook Share on Linkedin
Forex Analysis: EURGBP
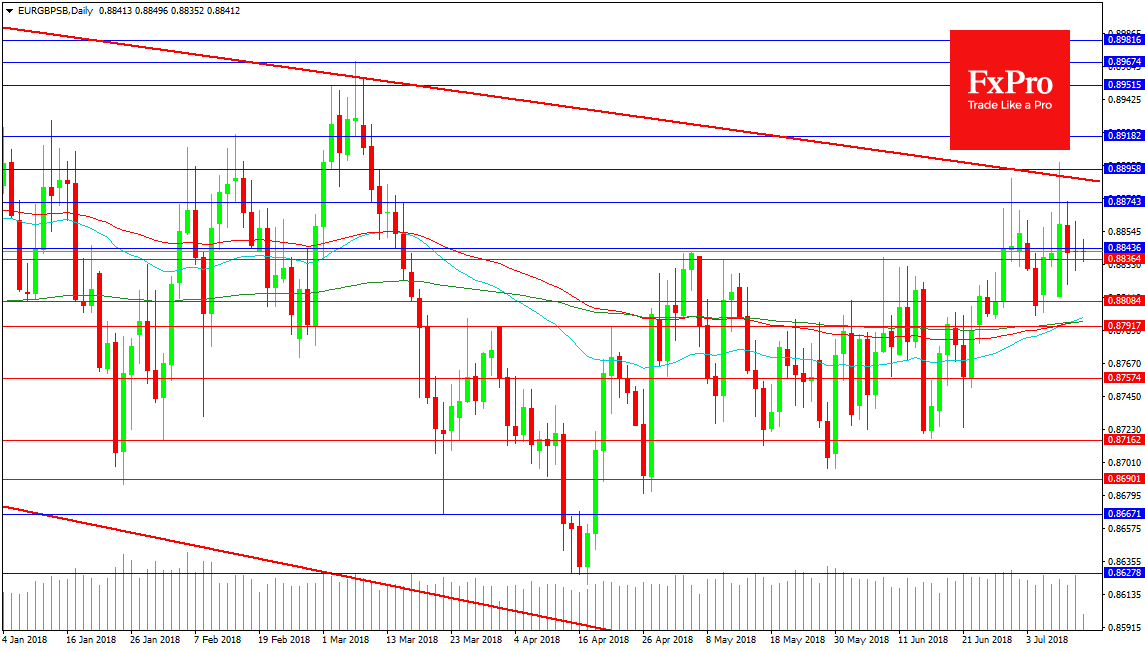
The EURGBP pair is in an uptrend on the daily since the 17th of April and the low created at 0.86203. The price has eked out higher highs and lows and advanced to Monday’s high at 0.89000. A break above this area could change the playing field and try to advance the chart to the 0.90000 area. This would require a turn back higher from current levels and a confirmed break of trend line resistance at 0.88873. There is light resistance at 0.88743 also with the March high at 0.89674.
Support for the pair can be found at the 0.88000 area followed by the moving average cluster around 0.87950. A break under this zone could see price wallow under 0.88000 for a further considerable period. But it should be noted that the 50 and 100 DMAs are crossing above the 200 DMA creating a Golden cross and potential pointing to higher prices. If this is disregarded by markets the swing low at 0.87162 becomes a crucial area of support if a deeper selloff to lower levels is to be avoided.
European stocks follow Asia Higher, China Shanghai Composite ended up 2.16%
Yen continues to trade as the weakest one for today, followed by Swiss Franc. Meanwhile Dollar pares back some again as markets await US consumer inflation release later today, which could see headline CPI accelerated to 2.9% yoy.
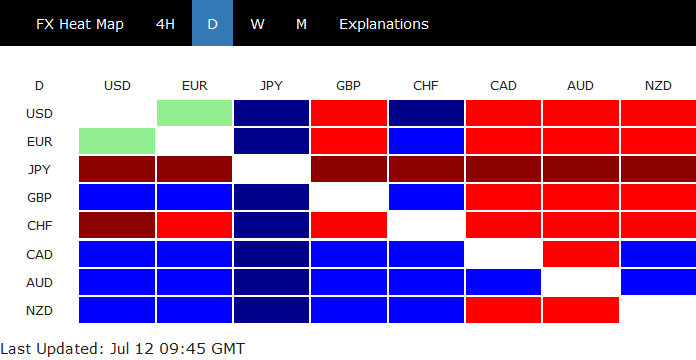
Global equities stage a strong rebound today as the impact of trade war escalation faded. Investors are getting tired of the noises from the US and China. Some attributed the chance of resuming negotiation between US and China. But we're don't buy into this as Trump is clear with what he's doing. Negotiation has started and ended abruptly, showing no intention to continue. And, just as Trump is blasting NATO allies on spending again today after the latters promised to increase it. It's clear to the objective eyes whether one is pushing for reforms or finding excuses to quit, and blame the others for his decision.
Anyway, at the time of writing, DAX is up 0.35%, CAC is up 0.39% while FTSE is up 0.68%. Earlier today, Nikkei closed up 1.17%, Hong Kong HSI rose 0.60%, Singapore Strait Times rose 0.12%.
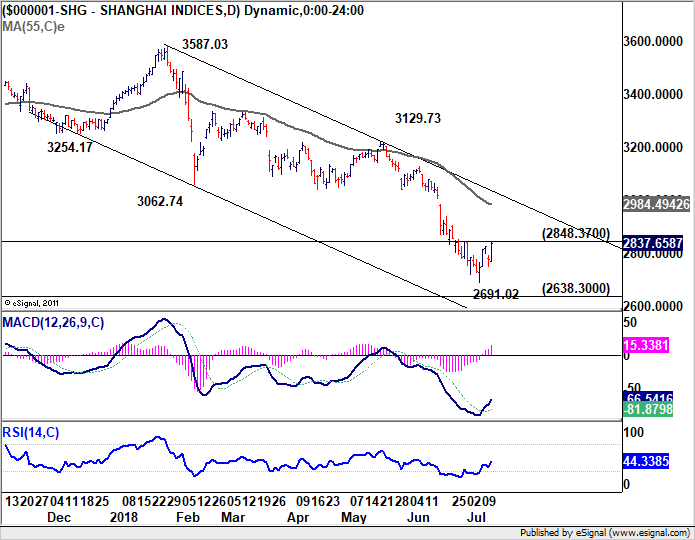
More importantly, China Shanghai SSE rose 2.16% to close at 2837.66, back above 2800 handle. The development indicates certain calmness in the markets despite this week's trade war escalation. And it affirmed the view of strong support between 2016 low at 2638.3 and 2700 psychological level. The rebound from 2691.02 is in progress and break of 2848.37 will extend it to 55 day EMA now at 2984.49. For now, we're seeing no chance of breakthrough 3000 psychological level. But such near term development is enough to stabilize the Asian markets, which suffered most last week.
Gold – Bulls May Test Downward Trend Line
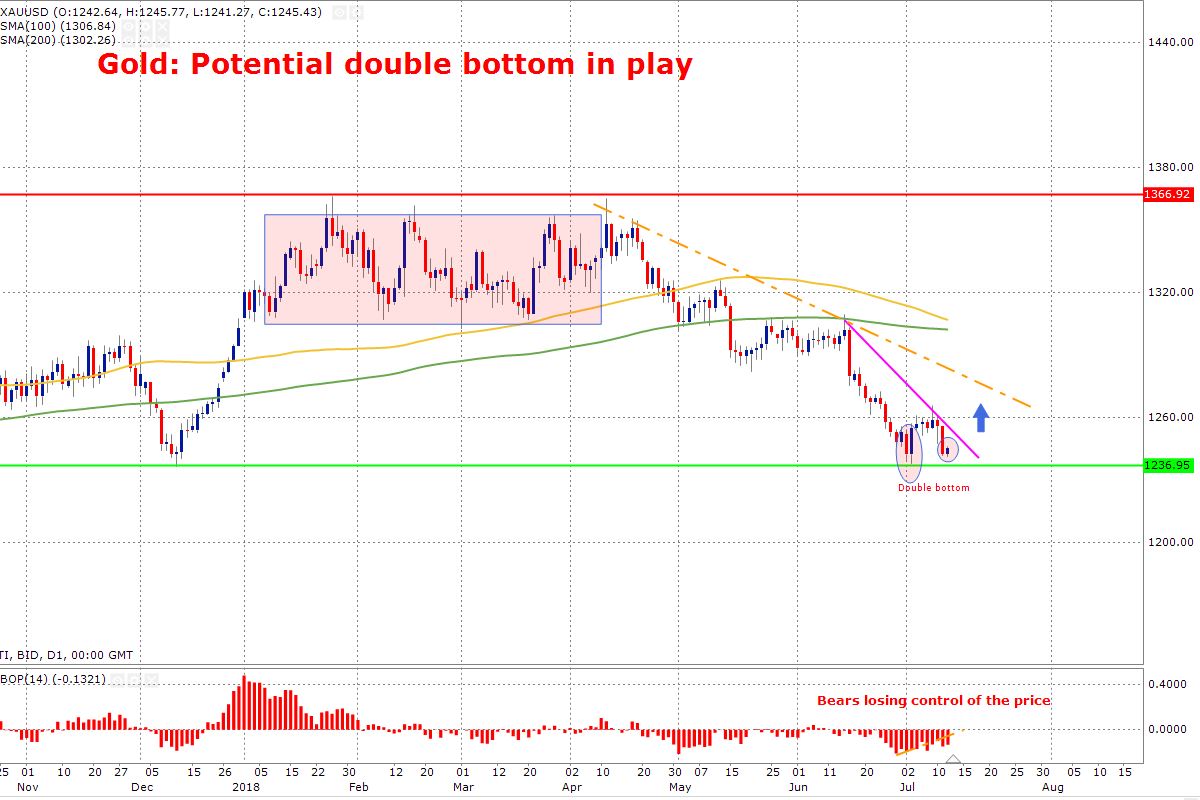
Gold: Potential double bottom in play
Today is again one of those days where trade war concerns have brought small interest for gold. We know one thing for certain that Trump is serious with respect to trade tariffs on China. Once again, the counter reaction from China is expected and that itself would have tendency to escalate the tensions further. So may be stay bullish on gold for a little longer.
The Fee hasn’t paid much attention to trade war. We do think if the current situation continues at this pace, the prospects of two rate hikes may be under jeopardy.
Technically speaking, the price has formed a double bottom which is a reveral pattern. This usually triggers bullish move, however from the balance of the power, we can that bears are still holding the ground. If the price starts to move higher, it would have to face the first resistance at 1240 mark. a break of the downward trend line would be a bullish sign.
Stocks Recover As Trade Negotiation May Resume
- Donald Trump ranched up the pressure on China
- Trump is picking up the areas where it would hurt the most
- China & US may be able to resolve tradewar through bilateral agreement
US futures and European markets are trading higher on the back of the hopes that the trade talks between China and the US would resume soon at a higher level. Donald Trump ranched up the pressure on China after announcing another huge potential tariff on Chinese products. His latest plan is targeting 10% tariffs on $200 billion worth of Chinese import later this year. Large consumers of Chinese imports are the target market here and they would be hit hard as a result of this.
In other words, trade war concerns are all over the traders' dashboard again. Trump is serious about punishing China, he is picking up the areas where it would hurt the most. Although, market participants still aren’t factoring in a full trade war. The hope is that China and US would be able to resolve this matter through bilateral agreement. But uncertainty around this matter has anchored up. The sad aspect is none of the parties are ready to throw in the towel yet which makes me think that there is no resolution in insight yet. Beijing has threatened for retaliation action against the current measures.
Therefore, over the coming days, I would expect a tit-for-tat reaction from China-unless the bilateral discussions resume between the two parties. The alarming area is if China chooses to go after the multinational companies which are operating in China. Certainly, that is the area where it would create more wounds. We think that the odds are high that China would specifically pick on US firms or at least it would shift the grounds in such a way that other foreign firms would have more privileges being in China on relative perspective. After all, China isn’t going to sit on its hand and see its GDP dragging lower by another 0.2% if the new tariffs become effective.
The Chinese yuan has already depreciated since Donald Trump has announced another $200 billion in new tariffs on Chinese products. China has a few options to answer this; it can let its currency continue to depreciate, there is an option of selling the US Treasuries , China can choose to answer this by applying fiscal subsidies to exporters, change the level of playfield for US firms and finally just put the same amount of tariffs on US products.
The impact of the trade war would be prominent in base metals as well particularly in copper. If China chooses to fight back the current tariffs, we would expect the copper prices to move lower. Afterall, if the Chinese GDP is going to get back and it is also going to have an impact on the US economy, the copper demand would naturally move from its current place and that would have an adverse effect on its price.
Having said this, it is important to mention that we are in uncharted territory because trade tariffs of current magnitude isn’t a familiar scenario in the modern era. Therefore, I think that it is fairly arduous to predict the cumulative impact.
European Commission cuts Eurozone growth forecasts on unfavorable external environment, upgrade inflation projections
European Commission released summer 2018 Interim Economic Forecast today.
On Eurozone growth:
- 2018 GDP is projected to grow 2.1%, revised down from Spring forecast of 2.3%.
- 2019 growth is projected to grow 2.0%, unchanged.
On Eurozone inflation:
- 2018 CPI is projected to be at 1.7%, revised up from 1.5%
- 2019 CPI is projected to be at 1.7%, revised up from 1.6%
On EU 28 growth:
- 2018 GDP is projected grow 2.1%, revised down from 2.3%.
- 2019 GDP is projected grow at 2.0%, unchanged.
On EU 28 inflation:
- 2018 CPI is projected to be at 1.9%, revised up from 1.7%
- 2019 CPI is projected to be at 1.8%, unchanged
On some countries
- Germany GDP growth forecast at 1.9% in 2018, revised down from 2.3%.
- Germany GDP growth forecast at 1.9% in 2019, revised down from 2.1%.
- France GDP growth forecast at 1.7% in 2018, revised down from 2.0%.
- France GDP growth forecast at 1.7% in 2019, revised down from 1.8%.
- Italy GDP growth forecast at 1.3% in 2018, revised down from 1.5%.
- Italy GDP growth forecast at 1.1% in 2019, revised down from 1.2%.
- UK GDP growth forecast at 1.3% in 2018, revised down from 1.5%.
- UK GDP growth forecast at 1.2% in 2019, unchanged
Quotes from the release:
Valdis Dombrovskis, Vice-President for the Euro and Social Dialogue, also in charge of Financial Stability, Financial Services and Capital Markets Union, said: "European economic activity remains solid with 2.1% GDP growth forecast for the euro area and the EU28 this year. Nevertheless, the downward revision of GDP growth since May shows that an unfavourable external environment, such as growing trade tensions with the US, can dampen confidence and take a toll on economic expansion. The growing external risks are yet another reminder of the need to strengthen the resilience of our individual economies and the euro area as a whole."
Pierre Moscovici, Commissioner for Economic and Financial Affairs, Taxation and Customs, said: "Growth in Europe is set to remain resilient, as monetary policies stay accommodative and unemployment continues to fall. The slight downward revision compared to the spring reflects the impact on confidence of trade tensions and policy uncertainty, as well as rising energy prices. Our forecast is for a continued expansion in 2018 and 2019, although a further escalation of protectionist measures is a clear downside risk. Trade wars produce no winners, only casualties."
US CPI Data On The Way As US President Trump Heads To The UK
At 08:30 GMT, UK BOE Credit Conditions Survey will be published. This is a survey of lenders which asks respondents to rate the level of credit conditions, including secured and unsecured loans to households, small businesses, non- financial corporations and non- bank firms. GBP pairs can move because of this data release.
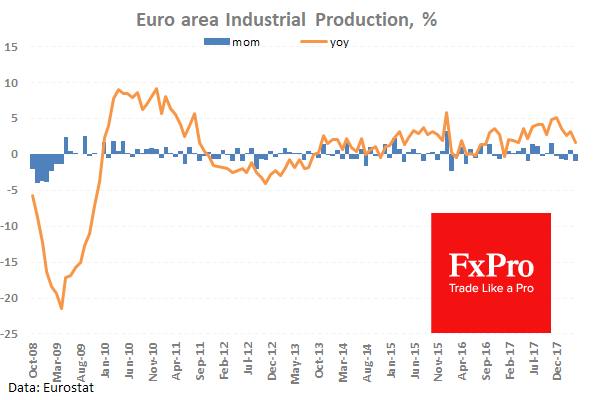
At 09:00 GMT, Eurozone Industrial Production w.d.a. (May) will be released with the consensus for 1.2% (MoM) and 2.8% (YoY) from a prior reading of -0.9% (MoM) and 3.0% (YoY). This data is expected to increase today with the monthly figure moving back into positive territory after falling under zero last month. The expected rise in the data is positive after months of sluggish economic data coming out of the Eurozone. The EUR can be moved by this data.
At 12:30 GMT, US FOMC Member Kashkari is due to speak at a scheduled event. USD pairs can be moved by any comments made.
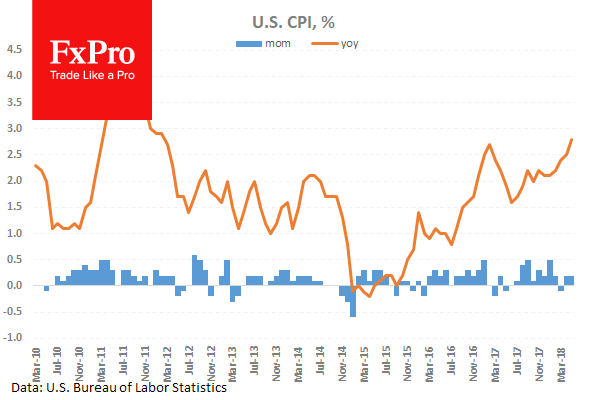
At 12:30 GMT, US Consumer Price Index (Jun) data will be released with an expected reading of 0.2% (MoM) and 2.8% (YoY) from 0.2% (MoM) and 2.9% (YoY) previously. Consumer Price Index Ex Food & Energy (Jun) data will be released with an expected reading of 0.2% (MoM) and 2.3% (YoY) against 0.2% (MoM) and 2.2% (YoY) previously.
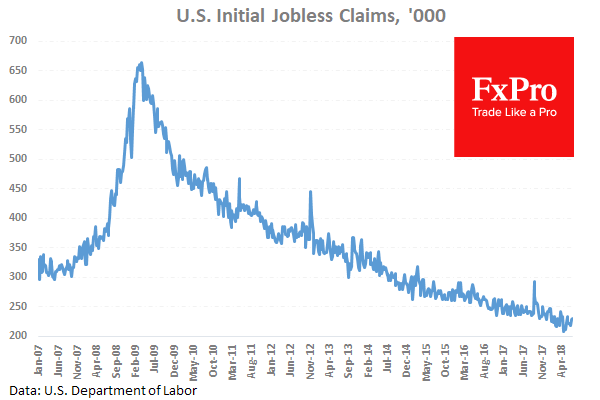
US Initial Jobless Claims (Jul 2) are expected to come in at 225K from 231K previously. Continuing Jobless Claims (Jun 25) are expected to be 1.720M from a prior 1.739M.
At 16:15 GMT, US FOMC Member Harker is due to speak at the Virginia Society of Certified Public Accountants. Audience questions expected. USD pairs can be moved by any comments made.
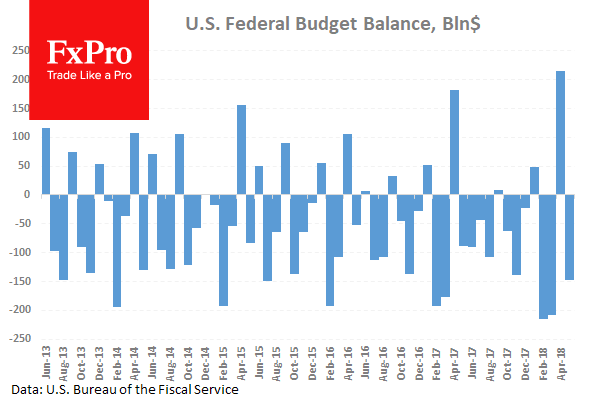
At 18:00 GMT, The US Monthly Budget Statement (Jun) will be released with an expected balance of $-98.2B from a previous $-147.0B. This data is expected to remain firmly in negative territory as seasonal factors affect the calculation of this metric. The previous reading dropped from the high in April 2018 of $182.4B. USD pairs may be moved by this data.
Dollar At 6-Month High Versus Yen
USD/JPY rises to 6-month high
After a rocky Wednesday, financial markets stabilised on Thursday as trade war fears eased. Asian moved back up with the Nikkei rising 1.17%, while Chinese equities rebounded strongly with the Shanghai and Shenzhen Composites rising 2.17% and 2.73% respectively. Similarly, European stocks opened slightly higher with the Eurostoxx 50 up 0.09% and the German DAX rising 0.27%.
In the FX market, the greenback enjoyed a nice recovery as investors fled risky assets. The dollar index surged to 94.78 (its high level since July 3rd) but consolidated gains on Thursday morning. Surprisingly, the Japanese yen, which usually appreciates during period of rising risk aversion, fell substantially over the last 24 hours. USD/JPY rose more 1.30% to 112.42, its highest level since January 10th. The currency pair is currently testing a key resistance level, which corresponds to the top of its multi-month downtrend channel.
It is still why the market has punished the yen against the backdrop of deteriorating risk environment. However, the surge in demand for upside protection in USD/JPY suggests that investors are getting anxious about further yen weakness. Indeed, call prices for all maturity increased with the 1-week 25-delta risk reversal measure climbing to -0.34% from -1.28% two weeks ago.
Today, traders will focus on the publication of the June inflation report in the US. Headline inflation is expected to have risen 2.9%y/y in June, while the core gauge, which excludes the most volatile components such as energy and food prices, should come in at 2.3%y/y. A stronger print in core inflation should provide the last nudge needed for USD/JPY to break the resistance as it would support the case for more rate hike this year.
Brent crude endures its largest drop in 2 years
OPEC meeting in Vienna on 22. June 2018 was a real push for oil prices. Members confirmed their willingness to reduce total production output. Both Brent Crude and West Texas Intermediate (WTI) were trading at $79.44 and $74.15 on 29. June 2018, a 4-year high for the black gold. However, as the diplomatic situation between both largest oil consumers, China and the US, are deadlocked, the tendency on crude oil is reversing.
Indeed, following Wednesday's OPEC report forecast confirming a decline in world demand for crude due to slowing consumption (OPEC-related demand estimated at 32.18 million bpd, a drop of 760'000 bpd compared to current year) and higher production from rivals, investors' opinion drastically changed, causing a rapid selloff of the commodity. Crude oil and WTI dropped by -6.92% and -5.03% on Wednesday late afternoon session.
Aside from escalating trade tensions between the two largest nations, EIA US crude oil stockpiles report confirms a lower drop in inventories for last week while communications made by both the US and Libya with regard to further sanctions against Iran for one and reopening of four export terminals for the other provide a rather negative outlook for oil prices in the mid-term. Speculations involving US pressure on Russia for extending its oil production also support the downtrend.
Accordingly, we expect oil prices to benefit from a slight bounce in the short-term, as the worst-case scenario is now priced in. We would therefore recommend to reload at current valuation levels.
5 Key Trading Affirmations to Help Keep Your Mind Sharp
‘You become what you think about all day long’ ― Ralph Waldo Emerson
Our thoughts have an immense effect on what paths we take in life. Talk to any coach, mentor or motivational speaker and they will very likely embrace and support positive affirmations. Think about it. If your mind’s narrative is constantly driven by negative thoughts and fears, you will likely struggle to meet your desired goals, be it trading or in other areas of your life!
So, without further ado, let’s dive into our first trading affirmation!

I am a consistently profitable trader
Voicing this affirmation first thing sets an incredibly positive theme for the day. Even if you have not reached a level of consistency yet, do not be afraid to say it! Also important is expressing it in present tense, rather than future tense. Using future tense will effectively nudge your goal into the future, much like hanging a carrot in front of a donkey!
Trading is a game of probabilities
Does every trade have to be a winner? Of course it doesn’t! Losing trades are a part of the business. In fact, win rate counts for very little if you’re losing more on your losing trades than you net on your winners.
If you take only 50 trades per year – that equates to approximately one trade each week – you only need to win 20 of those 50 trades (assuming your winners make twice the initial risk) to have a profitable year (this is a 40/60 win/loss ratio). We discuss the thinking behind probabilities in depth here: Thinking in Probabilities
I have Confidence in my Strategy
Without confidence in your trading strategy, you’ll likely end up throwing in the towel as without the guidance of a trusted method you’ll have no purpose and question every move you make. This is NOT how profitable traders operate. If you are trading a strategy that resonates with your personality – for example has been back tested and forward tested using a small live account – then saying this affirmation each trading day will help you recall the hard work you have already put in to develop your method.
I am patient. I do not chase trades. I only trade when opportunities present themselves to me.
Making the mistake of trading for the sake of trading is a disaster waiting to happen. A common misconception is that you need to trade regularly to make money. Whilst it is true that you do need to place trades to profit, you do NOT have to trade every day. Check out this article: What Snipers Teach you about Trading where we emphasize the need to think like a military sniper in trading.
I control my emotions in regard to profits and losses.
Humans are emotional creatures. There’s no getting away from that! Both profit and loss have the ability to cause an emotional tornado within us. Experiencing a profitable trade, or a string of profitable trades, can induce a sense of confidence – a sense of euphoria if you will. A loss, or a string of losses, will likely force the unaware on a path of destruction that has come to be known as ‘revenge trading’.
Controlling one’s emotions is seen as a key component to success in this business.
So, why do positive affirmations work?
Many successful people attribute their successes to a positive mindset. Jim Carrey and Denzel Washington, both A-list American actors, openly supported affirmations in the early stages of their careers. In addition to this, there’s also a plethora of credible sources proving that affirmations are worthwhile. We found this site to be particularly interesting: Science of Affirmative Proof
Will affirmations work for you and your trading? Well, unless you try you’ll never know! Spend some time creating a few positive affirmations that when read aloud evoke a strong personal connection. Attach them to your monitor using post-it notes. That way, you’ll see them (and hopefully read them) while switching on your computer.
Risk/Reward Ratio
Frustrated with losses?
Continuously looking to alter your method?
If so, the following article may help.
What is risk/reward?
- Risk is the amount of capital that one could potentially lose.
- Reward is the profit that one could potentially gain.
Risk/reward is expressed as a ratio, and refers to the amount of profit we expect to gain on a position, relative to what we’re risking in the event of a loss. Knowing this helps traders manage risk.
As an example, a long trade on the GBP/USD that requires a 50-pip stop, and has a take-profit target set at 100 pips, would be expressed as 1:2 risk/reward ratio. If the take-profit target was 200 pips, however, it’d be expressed as a 1:4 risk/reward ratio.
In the real world of trading, risk/reward ratios are NOT set in stone. Each trader will be different depending on the trading environment, timeframe selection and entry/exit points.
To help hammer home this concept, let’s look at a couple of examples:
A scalper, someone who looks to make a large number of trades and earn a small profit each time, usually has to have a high win ratio (essentially means more winners than losers) and may aim for a 1:1 risk/reward on each trade (IF they’re lucky). Do this consistently and the scalping business can be extremely profitable.
Now, say our scalper executes ten trades per day and targets a 1:0.5 risk/reward ratio. In order to rinse a profit he/she would need to win at least seven out of ten trades. One thing to keep in mind, especially using this type of strategy, is that spreads and commissions can really eat into your bottom line if not correctly accounted for.
As a swing trader (someone who takes positions that can last anywhere from two days to two weeks), the win ratio may decrease. That’s perfectly fine when trading medium term, though, as risk/reward tends to be healthier than that of a scalper (when targeting a larger gain, the win rate normally decreases). Typically, we have found that swing traders bat for at least a 1:1.5 risk/reward ratio. Therefore, if the swing trader is able to win 50% of the time and register a 1:1.5 risk/reward ratio, a profit can be made.
The bottom line unfortunately is that a lot of traders lack the patience to consistently execute a large enough series of trades to realize the true power behind risk/reward. Traders often get disheartened after a loss or two. Placing so much emphasis on winning trades is irrelevant on its own.
Here’s why you may want to consider incorporating risk/reward ratios in your trading decisions:
- Traders, especially those new to the industry, tend to focus on their win/loss ratio over their risk/reward ratio. Big mistake. A trader with a high win ratio and a shabby risk/reward ratio can end up in trouble.
- A reasonably consistent risk/reward, over time, can help contain losses.
- Measuring risk/reward can help locate high-probability trades. For example, say that you predominantly trade supply and demand areas, and you are about to enter long at a mouth-watering demand base. The demand alone is enough to get most supply/demand traders motivated. But what if the next supply is located nearby, measured at one times your risk i.e., a 1:1 risk/reward ratio from the entry point? Would you still take the trade? This, of course, will be dependent on what your desired risk/reward is per trade, as the supply will likely hinder upside. If one generally targets a 1:2 risk/reward, it may be best to pass on the setup. To calculate risk/reward, keep it simple. Assuming that your stop-loss distance is 50 pips and the underside of the opposing barrier is also 50 pips from entry, this would be considered a 1:1 risk/reward ratio.
- Understand that you do not have to trade every day. Without going into too much detail, a long-term trader who only takes ten trades per year and has a risk/reward ratio of 1:3, but loses seven of those trades, will still make money at the end of the year. As long as risk/reward is in line, the win ratio and trade output over the year should not bethe front-line concern.
To summarize…
If you’re frustrated with losses, try directing your attention on the risk/reward element of trading. Even with three winning trades out of ten, as we’ve already highlighted above, one can still potentially make a profit! Let’s remember that losses are a part of trading. You could Consider it as an expense.
In addition to this, if you are one of those traders who continuously looks to alter his/her trading methodology after a few losses, and we know there are plenty of you who do this, stop what you’re doing. It could be helpful to trade the method on a demo account and log at least twenty trade examples. As you now know, you can effectively lose more than 50% of your trades and STILL make a profit. Give it a go. You’ll be surprised at how much you learn and develop without the need to chop and change your strategy, which could have been perfectly satisfactory to begin with.
Trade with discipline – set your risk; set your reward.