Sample Category Title
Technical Outlook: WTI OIL – Bears Look For Fresh Signals On Break Below Daily Cloud
WTI oil holds in red for the fourth straight day and moved lower on Friday after bouncing from new two-week low at $60.17 on Thursday.
Recovery attempts proved to be short-lived as oil price remains under pressure on continuing concerns about US oil production, strong build of US crude stocks and fresh fears about US protectionist policies which could result in trade war after President Trump announced impose of tariffs on imported metals.
Daily techs show MA's (10/20/30/55) in bearish setup, with momentum studies turning south, which supports for further easing.
Fresh weakness probes again through daily cloud base (60.72) for renewed attempts below cracked pivotal support at $60.49 (Fibo 61.8% of $58.19/$64.22 bull-leg), close below which will be strong bearish signal.
In addition, WTI contract is on track for bearish weekly close and forming weekly bearish engulfing, which would add on existing negative outlook.
Firm break below daily cloud / Fibo support would look for retest of Thursday's low at $60.17 and attack at psychological $60.00 support.
Falling 20SMA ($61.61) is expected to cap upticks and keep bears intact.
Res: 61.39, 61.61, 61.98, 62.18
Sup: 60.49, 60.17, 60.00, 59.61
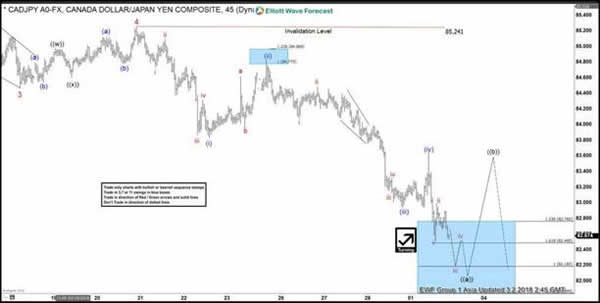
CAD/JPY 4H Chart: Possible Retracement
After reaching the weekly pivot point at 91.62, the Canadian Dollar began to decline against the Japanese Yen.
The currency exchange rate had breached the lower boundary of a dominant channel where the monthly S3 is located and is slowly moving downwards to test the weekly support at 80.98.
Regarding the near future, the CAD/JPY pair is likely to continue trading in the junior pattern. However, a reverse north could occur at the aforementioned weekly support.
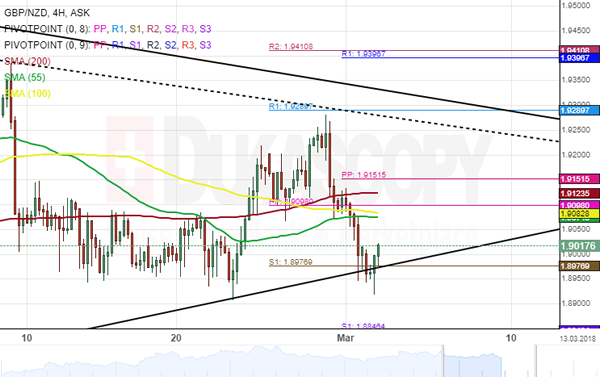
GBP/NZD 4H Chart: Breached Large-Scale Triangle
The Pound Sterling has been guided by a three-month descending channel against the New Zealand Dollar.
The combination of the 55-, 100-, and 200-hour SMAs was restricting the currency pair from making any upward movement. At the time of the analysis, the GBP/NZD pair had breached the monthly S1 at 1.8976.
As for near future, the exchange rate is likely to continue its bearish movement until it finds the next support set by the weekly S1 at 1.8846. In addition, technical indicators confirmed that bears could grow stronger during the following trading sessions.
DAX Plunges To 6-Month Low After US Imposes Steel Tariffs, German Retail Sales Slide
The DAX index continues to head lower and has posted sharp losses in the Friday session. Currently, the index is trading at 11,962.50, down 1.88% since the Thursday close. On the release front, German retail sales dropped 0.7%, well off the estimate of a 0.8% gain. On the inflation front, Eurozone PPI, improved to 0.4%, matching the estimate.
It has been a dreadful week for the DAX, which has shed 4.6% if its value. European stock markets are in red territory on Friday, following US President Trump’s decision to impose stiff tariffs on steel and aluminum imports in order to protect domestic producers. . Under the new scheme, foreign steel will be taxed at 25% and aluminum at 10%. The response to the move was overwhelmingly negative, but abroad and in the US. China and the EU immediately denounced the move US auto makers and oil and gas producers also condemned the tariffs. In imposing the tariffs, Trump relied on a provision which allows such measures for national security, but clearly, US trading partners will not quietly accept these protectionist measures. If these countries retaliate, a nasty trade war could ensue, which would likely unnerve investors and send the markets even lower.
The Federal Reserve has been in the spotlight in recent weeks, culminating with Fed chair Powell’s testimony before congressional and senate committees this week. Market attention will shift to the ECB next week, as policymakers meet on March 8. No major changes are expected, but members could discuss the possibility of removing the Bank’s easing bias towards increasing bond purchases if needed. A removal of the easing bias would likely be interpreted as a plan to tighten policy and would be bullish for the euro. Inflation remains weak, so there is little pressure on the ECB to tighten policy anytime soon. Recent indicators show that inflation in the eurozone is steady, but remains well below the ECB target of around 2 percent. Eurozone CPI dipped to 1.2% in February, down from 1.3% in January.
GBPJPY Looks Oversold, Completes 5-Month Low
GBPJPY has been plunging sharply lower since Thursday and reached a more than a 5-month low of 145.40. The pair completed the fourth red day in a row following the significant pullback on the 150.00 psychological level. When looking at the bigger picture the price is creating a bearish correction and fell below the 23.6% Fibonacci retracement level of the last upward movement from 124.00 to 156.60.
From the technical point of view, the market could increase negative momentum in the 4-hour chart. The Relative Strength Index (RSI) is sloping down in the oversold territory, while the stochastic oscillator is also holding in the bearish area.
If price action remains negative, the next level to have in mind is the 38.2% Fibonacci level slightly above the 144.00 barrier. A slip below the aforementioned level could open the door for the key level of 143.00, taken from the highs in September.
Conversely, if the price creates a bullish movement, then the focus could shift to the upside towards the 148.00 resistance level. If this level is breached, it could increase bullish pressure until the price hits 148.50.
Technical Outlook: AUDUSD – Limited Recovery To Precede Fresh Bears
The Aussie dollar remains in red after Thursday's bounce from new low at 0.7712 and recovery extension on Friday was capped by broken 100SMA (0.7773). Lower Asian stocks on fears about the impact of new tariffs on imported metals on Asia, keep the Australian dollar at the back foot. The pair may hold in extended consolidation before bears re-take full control, as oversold slow stochastic suggest a breather after recent fall, but daily studies in firm bearish setup, along with deteriorating fundamental outlook, keep bearish bias in play. Close below cracked support at 0.7742 (Fibo 61.8% of 0.7500/0.8135 ascend is needed for fresh bearish signal for extension of pullback from 0.8135 (2018 high, posted on 26 Jan) towards 0.7650 (Fibo 76.4% of 0.7500/0.8135. Broken 100/200SMA's (0.7773 and 0.7782) mark strong barrier (reinforced by daily cloud base/falling 10SMA (0.7817) which is expected to limit recovery attempts.
Res: 0.7773, 0.7782, 0.7817, 0.7843
Sup: 0.7742, 0.7712, 0.7700, 0.7650
EUR/USD Analysis Makes Another Fundamental Move
The picture on the EUR/USD charts is a complicated mix of technical levels and fundamental events causing various moves. This combination has resulted in a rather high volatility to the upside in the last 24 hours.
In general, the pair bounced off the support of the speculative long term channel, which was strengthened by a weekly pivot point near the 1.2150 mark.
The event coincided with the sudden announcement that Donald Trump will impose tariffs on metal imports. That caused a sudden increase in volatility.
The volatile trading broke various resistance levels until the surge paused on Friday morning near the 200-hour SMA.
GBP/USD Analysis Gets Squeezed In
Finally the exact location of the dominant support can be marked, as the Pound has fully confirmed the trend line by surging against the US Dollar.
The surge resulted in the breaking of the junior channel down pattern's resistance. However, the ascent of the currency exchange rate was stopped on Friday morning by the 55-hour simple moving average.
In general, the pair is either going to break the SMA and move to the 1.3870 mark or make another attempt to pass the long term support below.
Both scenarios can be played. So watch out for a break out from this rather rare squeeze in.
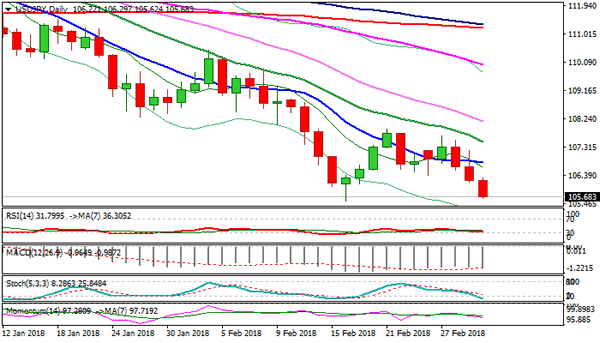
USD/JPY Analysis Continues Lower
The Dukascopy research team has abandoned the idea to map the USD/JPY with a short term pattern. The reason for the decision is that the US Dollar is too volatile against the Japanese Yen. The volatility is largely caused by politics and monetary policy.
However, the larger scale descending trend has been confirmed and one can observe that the rate is going lower and lower. Although, the currency pair does make stops near various pivot point levels.
By taking that into account, we expect the pair to next decline down to the 105.17 level where the next support is located at.
Gold Analysis Continues To Move As Forecast
The support levels just above the 1,300.00 mark where reached even faster than it was expected.
Mainly the move has been associated with the strength of the US Dollar, but the combination of various supports at the mentioned level managed to force the metal into a rebound.
During the rebound various resistance levels where passed, and by the middle of Friday's trading the bullion was trading sideways above the 1,315 mark.
In general, the situation needs to be watched, as a sudden surge or decline was about to occur.