
Sample Category Title
Trade Wars Overwhelmed the Markets, More Volatility ahead
The theme of trade wars overwhelmed the global financial markets last week and overshadowed any other topics. It started on news that US President Donald Trump is going to impose tariffs of 25% on steel and 10% on aluminum. Trump then doubled down by tweeting "trade wars are good, and easy to win" on Friday. DOW suffered a wild 1582 pts swing, diving from weekly high at 25800.35 to as low as 24217.76 before closing at 24538.06. Dollar was initially boosted by Fed Chair Jerome Powell's testimony, which raised the chance of four Fed hikes this year. But the greenback gave up after a brief try to reverse its down trends against Euro and Swiss Franc. Sterling was pressured as EU's draft Brexit treaty reminded the markets that there are still huge divergences between UK and EU regarding post Brexit relationship. And UK Prime Minister Theresa May's high profile speech on Friday didn't live up to the expectations and gave no inspirations.
In the currency markets, Yen ended as the strongest one on risk aversion. Euro closely followed as the second. Dollar didn't perform too badly indeed as it end as the third strongest. Meanwhile, Canadian Dollar ended as the weakest one, partly because of ongoing drag in NAFTA renegotiation, and partly because it's the biggest steel importer to the US. Sterling followed as the second weakest while Aussie was the third.
Large volatility in the markets is almost like a guarantee in the coming week. Results of German Social Democrat member's vote on grand coalition will be released on Sunday. Italy election will be held on the same day too. Then, Trump will probably formally announce the tariffs and other countries will have likely come up with counter measures. Then, there will be RBA, BoC, BoJ and ECB rate decision. US will also release non-farm payroll report. We better be prepared for a rough ride.
DOW heading through 23360 and below as medium term correction extends
DOW initially edged higher to 25800.35 last week but reversed from there and dropped sharply to as low as 24217.76. The index then recovered to close at 24538.06. The development now suggests that the corrective pattern from 26616.71 has started the third leg. That is, further fall should be see through 23360.29 in near term to 100% projection of 16616.71 to 23360.29 from 25800.35 at 22543.93.
Nonetheless, the goods news is that for now, it's look like DOW is only corrective the up trend from 15450.56. Therefore, strong support should be seen around above mentioned 22543.93, which is close to 55 week EMA (now at 22817.61), and 38.2% retracement of 15450.56 to 26616.71 at 22351.24, to bring strong, sustainable rebound.
German DAX performing even worse
Outlook of German DAX is much worse as the last week's sharp decline to close at 11913.71 confirmed resumption of fall form 13596.89. Based on current momentum, key support level at 11868.85 will likely be taken out firmly. And DAX would dive to 61.8% retracement of 9214.09 to 13596.89 at 10888.32 before having strong enough support for rebound.
10 year yield takes a breath, but still on course for 3.036
Despite increasing expectation for four Fed hikes this year, 10 year yield didn't extend recent up trend. For now, 2.943 should be a short term top. And TNX will likely gyrate lower as correction, possibly to 55 day EMA (now at 2.690). But we'd expect strong support from 38.2% retracement of 2.033 to 2.943 at 2.595 to bring rebound.
We'd maintain then the region between 3.036 and 3.318 (100% projection of 1.336 to 2.621 from 2.034) is the long term trend defining resistance zone. And TNX should at least have a go at it even if it's going to give up eventually.
Dollar index staying in down trend after failing 91.01 key resistance
For once, Dollar looks like it's finally reversing the down trend as inspired by Fed Chair Jerome Powell's testimony. However, it clearly lacked follow through buying to push it through 91.01 key support turned resistance. For now, it's staying in the down trend from 103.82. And more downside is still in favor to key support at 84.75 (61.8% retracement of 72.69 to 103.82 at 84.58) before having enough support to complete the medium term correction.
Again, firm break of 91.01 will be the first signal of trend reversal and will turn focus back to 95.15 key resistance for confirmation.
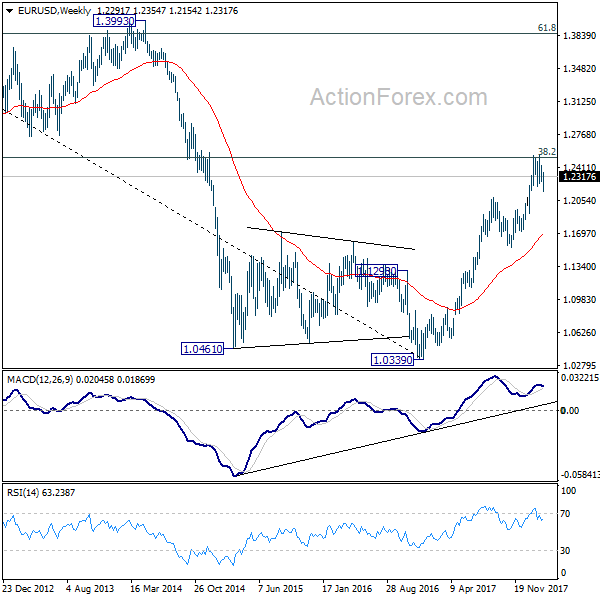
EUR/USD Weekly Outlook
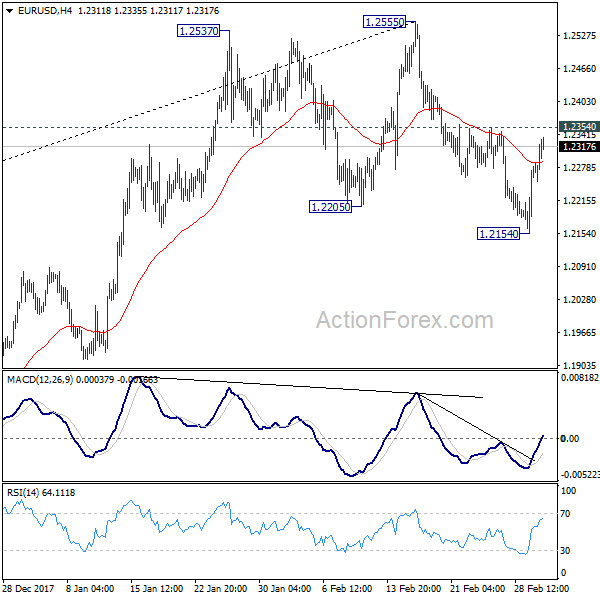
EUR/USD dipped 1.2154 last week but drew support from 55 day EMA and rebounded. The failure to sustain below 1.2205 key support didn't confirm trend reversal. Initial bias is neutral this week first. on the upside, above 1.2354 minor resistance will bring retest of 1.2555 high. Firm break there will carry larger bullish implication. On the downside, break of 1.2154 would revive the case of rejection by 1.2516 key fibonacci level and trend reversal. Outlook will be turned bearish for 38.2% retracement of 1.0339 to 1.2555 at 1.1708.
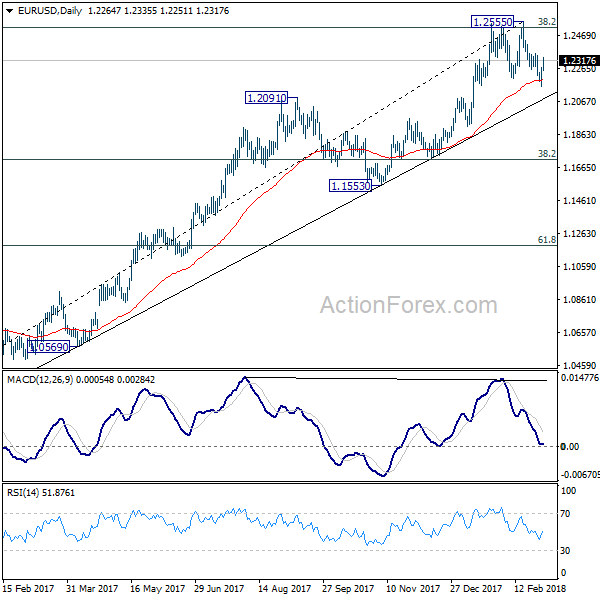
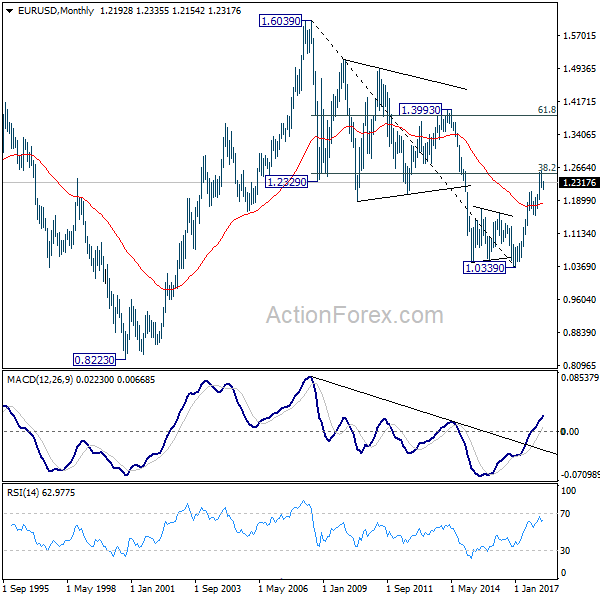
In the bigger picture, key fibonacci level at 38.2% retracement of 1.6039 (2008 high) to 1.0339 (2017 low) at 1.2516 remains intact despite attempts to break. Hence, rise from 1.0339 medium term bottom is still seen as a corrective move for the moment. Rejection from 1.2516 will maintain long term bearish outlook and keep the case for retesting 1.0039 alive. Firm break of 1.1553 support will add more medium term bearishness. However, sustained break of 1.2516 will carry larger bullish implication and target 61.8% retracement of 1.6039 to 1.0339 at 1.3862.
In the long term picture, 1.0339 is seen as an important bottom as the down trend from 1.6039 (2008 high) could have completed. It's still early to decide whether price action from 1.0339 is developing into a corrective or impulsive pattern. Reaction to 38.2% retracement of 1.6039 to 1.0339 at 1.2516 will give important clue to the underlying momentum.
Summary 3/5 – 3/9
Monday, Mar 5, 2018
[php_everywhere instance="1"]
Tuesday, Mar 6, 2018
[php_everywhere instance="2"]
Wednesday, Mar 7, 2018
[php_everywhere instance="3"]
Thursday, Mar 8, 2018
[php_everywhere instance="4"]
Friday, Mar 9, 2018
[php_everywhere instance="5"]
Weekly Economic and Financial Commentary: Soaring Sentiment, but Will the Hard Data Follow?
U.S. Review
Soaring Sentiment, but Will the Hard Data Follow?
- U.S. factory sector data released this week showed another divergence between the "hard" and "soft" data. The ISM manufacturing index reached its highest level since 2004, but durable goods orders showed signs of cooling.
- The Consumer Confidence Index climbed to 130.8 in February, touching the highest level since late-2000 despite volatile U.S. equity markets.
- New and pending home sales slipped in January, while strong public construction spending offset some weakness in the private sector.
Soaring Sentiment, but Will the Hard Data Follow?
U.S. factory sector data released this week showed another divergence between the "hard" and "soft" data. On the hard data front, private equipment spending looks to be cooling after increasing at a double-digit pace in the third and fourth quarters of 2017. Durable goods orders fell 3.7 percent in January, with much of the decline concentrated in the volatile nondefense aircraft component. Our preferred gauge of future business investment, orders excluding aircraft and defense, fell 0.2 percent in January on the heels of a 0.6 percent decline in December. The trend in core capital goods orders has weakened noticeably from the impressive run in the fall; core capital goods orders are up at a 3.7 percent three-month average annualized pace, compared to over 18 percent as recently as November (see chart on page 1).
Survey data on U.S. manufacturing, however, continued to reach new heights. The headline print of 60.8 for the ISM manufacturing index was the highest since 2004 and the latest affirmation of broadening business confidence (top chart). The prices paid component of the index continued climbing—signaling building price pressures in the pipeline—and the employment component jumped to 59.7 after a sharp fall to 54.2 in January. As we have written previously, we expect to see the hard data for orders converge with the survey data. In times of such pronounced survey strength, however, the gap between hard and soft data is usually narrowed by business surveys getting reined in, rather than the hard orders data, which feed directly into GDP calculations.
Survey-data released this week also showed consumer confidence soaring. The Conference Board's Consumer Confidence Index climbed to 130.8 in February, touching the highest level since late- 2000. Both the present situation and future expectations indices rose in the month, with more upbeat sentiment about the availability of jobs and expected income growth. February's stock market volatility seemed to have little effect on consumer sentiment. A separate release from the Department of Commerce showed strong disposable income growth in January as the tax cuts began to take effect. Consumption growth started the year off on a bit of a soft note, but rising confidence and solid income growth bode well for consumption growth over the remainder of the year.
New home sales slipped in January, falling 7.8 percent despite market expectations for a 3.5 percent gain. The winter months can have notoriously volatile seasonal adjustment factors for home building, however, and some upward revisions going back to October helped offset some of the January weakness. Pending home sales also exhibited weakness in January. Construction outlay data were a bit better, as private residential spending rose 0.3 percent and 0.6 percent in the single-family space. Public construction in particular exhibited strength: federal outlays surged 14.9 percent in the month after a 12.7 percent jump in December (bottom chart). Q4-2017 saw the fastest growth in the government line of real GDP since Q2-2015. Although seasonality issues could be at work, this recent data is an early sign of continued near-term momentum in this sector.
U.S. Outlook
ISM Non-Manufacturing • Monday
The ISM non-manufacturing index rose 3.9 points last month to reach a new cycle high of 59.9. The index had reached a cycle high previously in the fall due to hurricane-related distortion, but this record-breaking print is being driven by overall firming in the sector. Non-manufacturing new orders rose 8.2 points in January, which was the strongest monthly increase in the series since early 2009. Prices increased in 15 of the 18 industries reported in service firms last month.
While a trend has yet to emerge, price gains will be something to keep an eye on over the first half of the year. Trade data in the index will also hold significance. Last month, export and import activity picked up, above their six-month averages. However, the rise in imports has been stronger than exports, suggesting trade could be a headwind to Q1 GDP growth.
Previous: 59.9 Wells Fargo: 58.8 Consensus: 58.7
Factory Orders • Tuesday
Factory orders closed 2017 with a 1.7 percent increase in December, marking the fifth straight monthly increase, including upwardly revised November data. Core capital goods shipments were up nearly 9 percent on the year and are up 12.1 percent on a three-month annual rate basis. Equipment spending in Q4 grew by an initially reported 11.4 percent; however, the recent strength in core capital goods, in part, reflects the upwardly revised Q4 equipment spending figure to 11.8 percent. Looking forward into Q1, core capital goods orders slipped a bit in December but are still elevated on an annualized rate basis.
There is still a disconnect between euphoric soft data with ISM new orders near record highs, and hard data that has not quite kept pace. If January's factory orders report confirms survey data strength, Q1 business investment and equipment spending could be in for another strong quarter.
Previous: 1.7% Wells Fargo: -1.1% Consensus: -0.5% (Month-over-Month)
Employment • Friday
January's jobs report posted a solid 200,000 job gain with broad strength, with 63 percent of industries adding jobs compared to just 52 percent last year. Average hourly earnings rose 0.3 percent in January and are now up 2.9 percent over the year. Earnings have trended upwards over the past six months, and this caused some concern in the markets, as higher labor costs could squeeze profits and accelerate inflation. Previously, wages had been sluggish due to low productivity and weak inflation.
Labor force participation is an area that needs improvement if we are to achieve sustained 3 percent growth, as it would help drive both productivity and income growth. The labor force participation rate has trended downwards since the turn of the century, and has remained just under 63 percent over the past two years. The unemployment rate held at 4.1 percent in January, and we expect it to continue declining as job growth outpaces labor force growth.
Previous: 200,000 Wells Fargo: 210,000 Consensus: 200,000
Global Review
Economic Recovery Continued in South America in 2017
- Growth was not strong, but was in the right direction for some of the largest economies in South America. The Brazilian economy managed to grow 1.0 percent in 2017 after a 2.1 yearover- year rate in Q4-2017, with the external sector driving growth. Argentina's economy grew 2.8 percent in 2017. China's Manufacturing Disappointed, U.K.'s Did Not
- The official manufacturing PMI for February dropped close to the demarcation point once again, to 50.3 from 51.3 in January, after remaining above 51 for more than a year.
- In the United Kingdom, the manufacturing PMI came in a bit higher than what markets were expecting, at 55.2 versus markets expectations' of 55.0.
Economic Recovery Continued in South America in 2017
Not strong, but in the right direction, should be the call for some of the largest economies in South America. The largest one, which is also the ninth-largest economy in the world, Brazil, finally abandoned a recession that lasted more than two years. Economic growth was not great, and risks are still high for this economy in 2018, but it managed to grow 1.0 percent in 2017 after a 2.1 yearover- year rate in Q4-2017. From the Q4 release, it is clear that although domestic consumption is starting to improve, the economy was driven by the external sector. Real exports of goods and services surged 9.1 percent in the final quarter of the year, year over year, and 5.2 percent for the year as a whole, while real imports of goods and services grew 8.1 percent on a year-earlier basis in Q4-2017 and 5.0 percent for the whole of 2017. Real personal consumption expenditures were up 1.0 percent, while real government expenditures were down 0.6 percent. Growth in real gross fixed investment was negative for the whole of 2017, down 1.8 percent, but it grew 3.8 percent on a year-earlier basis in Q4-2017, clearly showing a recovering trend that will help the prospects for economic growth in 2018 if the political cycle does not add to the uncertainty over the future of the Brazilian economy.
Meanwhile, Argentina's economy grew 2.8 percent for 2017, according to the monthly economic activity index, after declining 2.2 percent in 2016. While we do not have demand-side numbers yet, we suspect that the recovery in the global economy also contributed to the performance of the Argentine economy in 2017 as it did for the Brazilian economy. Perhaps in the Argentine case, the balance of growth was relatively more even between the external sector and the domestic economy than in the case of Brazil, as the country's construction industry led the way from the supply side in the recovery process.
China's Manufacturing Disappointed, U.K.'s Did Not
In China, the official manufacturing PMI for February dropped close to the demarcation point once again, to 50.3 from 51.3 in January, after remaining above 51 for more than a year. However, the Caixin China manufacturing PMI, which tends to survey foreign firms producing for the export market, saw its index improve slightly, from 51.5 in January to 51.6 in February. The difference between these two indices is probably related to the current state of the global economy versus the Chinese economy, i.e., the global economy has continued to expand, while data suggest that the domestic Chinese economy may be decelerating a bit in Q1-2018. In the United Kingdom, the manufacturing PMI came in a bit higher than what markets were expecting, at 55.2 versus markets expectations of a 55.0 reading, but the index was slightly lower than the 55.3 print recorded in January. All this information, together with the release of a strong February manufacturing PMI for the United States, continues to point to a relatively strong and steady manufacturing sector across the global economy. In some sense, this week's numbers for the manufacturing sector are a sign that global growth has steadied over the past several quarters, which is no small feat.
Global Outlook
Australia GDP • Tuesday
The Australian economy expanded 2.8 percent year over year in Q3, largely driven by a pickup in investment spending and a modest build in inventories. While the business sector expanded in Q3, private consumption was weak, up just 0.1 percent sequentially. However, recent data point to an improving consumer outlook. Monthly retail sales rose on average 2.4 percent year over year in Q4, and the unemployment rate continues to trend lower. The economy is likely poised for further expansion, as consumer spending improves and a tighter labor market should put upward pressure on wages. The Reserve Bank of Australia (RBA) also meets next week on Monday. Slow wage growth, below-target inflation and high levels of household debt have kept the RBA on hold for the past several quarters. However, its latest policy statement cited improving economic conditions. In the midst of slowly increasing inflation, we look for the RBA to raise rates either later this year or in early 2019.
Previous: 2.8% Consensus: 2.5% (Year-over-Year)
Bank of Canada Meeting • Wednesday
The Bank of Canada (BoC) hiked its overnight target lending rate 25 bps to 1.25 percent at its January meeting, largely due to a strong labor market and inflation within the target range. Although economic growth remains solid and inflation is firmly within the BoC's target range of 1-3 percent, we look for the BoC to remain on hold until the second half of this year. The BoC has already tightened its policy rate 75 bps since July 2017, and is likely mindful of how higher rates will affect consumers. Highly-leveraged households are already facing higher mortgage rates, and other debt servicing costs could also increase. The BoC also cited ongoing NAFTA negotiations as a risk to the outlook, as the United States is Canada's largest trading partner. On net, the outlook remains positive for future rate hikes, albeit at a gradual pace. We acknowledge some upside risk to our forecast, should growth pick up or NAFTA negotiations result in a more favorable outcome for Canada.
Previous: 1.25% Wells Fargo: 1.25% Consensus: 1.25%
European Central Bank Meeting • Thursday
Economic growth in the Eurozone is becoming increasingly broadbased; however, sluggish inflation has restrained the European Central Bank (ECB) from implementing a more rapid pace of policy normalization. Core CPI inflation was only 1.0 percent in February, and ECB President Mario Draghi's testimony to the European Parliament this week cited that "inflation has yet to show more convincing signs of a sustained upward adjustment." However, an overall pickup in growth—Q4 real GDP increased 2.7 percent year over year—combined with a tightening labor market, should support slowly increasing inflation in the coming quarters. While we do not expect the ECB to make any policy changes on March 8, we look for the ECB to end its current €30 billion monthly pace of bond purchases by the end of this year. We then look for the ECB to slowly begin to raise rates by first hiking the deposit rate in H1-2019, while leaving the overnight interbank rate and two-week refinancing rate unchanged for the time being.
Previous: 0.00% Wells Fargo: 0.00% Consensus: 0.00%
Point of View
Interest Rate Watch
So, Mr. Powell, How's the New Job?
The new Chairman of the Federal Reserve, Jerome Powell, took the oath of office on February 5, the same day that U.S. stocks went into freefall and the Dow Jones Industrial Average posted it largest singleday point drop on record, falling 1,175 points.
It would certainly be unfair to blame the new Chairman for the selloff, although it certainly made for a memorable first day on the job. This week, financial markets got an opportunity to take the measure of the new Fed Chairman when he headed to Capitol Hill to meet with lawmakers for the semiannual Monetary Policy Report.
The initial financial market reaction to the published policy report was rather muted, but sparks flew on Wall Street later in the day on Tuesday when the Q&A of Mr. Powell was widely interpreted as being at least somewhat more hawkish than the carefully crafted formal report. After stating that, in his personal view, the economy had strengthened since December, Powell added that "we've seen continuing strength in the labor market — we've seen some data that in my case will add some confidence to my view that inflation is moving up to target." Equity markets sold off again on Tuesday as Treasury yields climbed higher.
Later in the week, during Powell's appearance before the Senate Banking Committee on Thursday, financial markets had more or less stabilized… until the President announced his new tariffs on steel and aluminum. The immediate reaction was another steep sell-off in stocks. Another takeaway from the Q&A of the new Fed Chair is that he does not place too much importance on financial market volatility when considering the course for monetary policy. A week like this one feels almost designed to test anyone's nerve.
Another interesting takeaway from Powell's appearances this week centered on whether recent improvements in the labor market would translate into higher inflation. "For wages to go up sustainably, you need higher productivity," Powell argued. We agree. In fact, productivity is the magic elixir to help GDP growth as well, as we discuss in the Topic of the Week on the next page.
Credit Market Insights
Noncurrent Loan Balances Up in Q4
Noncurrent balances for bank loans increased 1.3 percent ($1.5 billion) in the fourth quarter, according to the FDIC Quarterly Banking Profile released Tuesday. This recent uptick marks a departure from trend after six consecutive quarterly declines, which collectively shaved off $26.4 billion in noncurrent loans.
Real estate contributed most of the increase in noncurrent loans. Noncurrent residential mortgages rose 5.2 percent ($2.8 billion) for the first increase since Q3-2012. Residential real estate makes up just under half of all noncurrent loans, so changes in this segment have a large influence on the headline. Noncurrent credit card balances also increased, up 11.5 percent ($1.2 billion), but noncurrent commercial and industrial loans fell 8.5 percent ($1.7 billion).
Bank balance sheets continue to show underlying strength. Total loan balances at banks increased 1.7 percent in Q4, with growth across nearly every category. This kept the noncurrent loan rate at 1.2 percent, the lowest level since Q3-2007 and down from 1.42 percent a year ago. The coverage ratio of loan-loss reserves to noncurrent loan balances declined slightly to 106.3 percent, but has been above 100 percent for the past three quarters.
We expect the Fed to raise rates three times in 2018. This environment may put pressure on borrowers' ability to afford payments. However, bank balance sheets look to be in a position to absorb further modest increases in noncurrent loans at this point.
Topic of the Week
Potential Growth: As Easy As One-Two-Three?
Last summer, we published a report detailing the challenges to achieving 3 percent real economic growth on a sustained basis, and last week's release of the Economic Report of the President offered another opportunity to revisit the outlook for potential growth.
In the short-run, aggregate spending drives economic growth. It is from the demand-side that economists derive the well-known equation C+I+G+NX=GDP. Over the long-run, however, growth is driven by an economy's capacity to produce goods and services. Labor force growth and the growth in the productivity of these workers determine an economy's productive capacity.
The Economic Report of the President showed the assumptions that underpin the Trump administration's 3 percent growth forecast. As illustrated in the top chart, a return to historical growth rates for hours worked and productivity would lift potential growth to 3 percent. The challenge, however, is that today's demographic profile looks vastly different than the previous half-century. The prime-age population in the United States has more or less been flat for the past decade (bottom chart). The administration's own estimates, which include a positive labor response from the tax plan, do not expect labor's contribution to growth to return to the historical average. The prospect of tighter immigration laws represent another potential downside risk to the labor component.
If labor's contribution will be lower in the future than in the past, productivity growth would have to make up the difference. Indeed, the White House projects productivity growth of 2.6 percent per year over the next decade, above the 2.0 percent averaged since 1953 and the 1.2 percent averaged since 2007 (top chart). We concur that productivity growth is likely to rise from its current pace as stronger investment spending drives capital deepening and total factor productivity accelerates from historic lows. We remain skeptical, however, that productivity growth will swing from one extreme to the other, which is what would be needed to sustain 3 percent GDP growth.
The Weekly Bottom Line: Fears of Trade War Rattle Financial Markets
U.S. Highlights
- Markets sold off sharply this week, following a somewhat hawkish assessment of the U.S. economy from the Fed's new chair Jerome Powell and the announcement of steep tariffs on steel and alumimium imports by Donald Trump.
- Despite the market reaction to Powell's comments, there was not much in the data this week to indicate that the economy is overheating. Both headline and core PCE inflation remained unchanged in January, coming in at 1.7% y/y and 1.5% y/y, respectively. Real consumer spending fell by 0.1% on the month. Vehicle sales also weakened in February.
- Both consumption and GDP will start the year on a softer footing but weakness is expected to be short-lived. Tax cuts and tightening labor market will support consumer spending and above-trend growth over the remainder of 2018.
Canadian Highlights
- The marquee event this week was the 2018-19 federal budget, which despite an array of new spending measures, contained little in the way of policies intended to address Canada's newly disadvantaged tax position versus the U.S.
- Real GDP hit 1.7% (annualized) in the fourth quarter, below the Bank of Canada's forecast. The monthly figure edged modestly higher in December, up 0.1%, signaling diminished momentum to end the year and a soft hand-off into 2018.
- A softer-than-expected GDP print coupled with a maintenance-type budget provides the Bank room to be patient on the rate hike front, but data-dependency remains in place.
U.S. - Fears of Trade War Rattle Financial Markets
This was a busy and difficult week for financial markets. Economic data releases were overshadowed by the much anticipated first Congressional testimony by the new Federal Reserve chair Jerome Powell and trade tariff announcement from the White House.
In his speech on Tuesday, Mr. Powell struck an upbeat tone on the U.S. economy and inflation, saying that his "outlook for the economy has strengthened since December." He also highlighted potential upside risks to growth and inflation stemming from fiscal policy and the improved global economic backdrop. Without stating the exact number of rate hikes expected this year, Powell seems to have opened the door to a faster rate of normalization as long as the economic data cooperates. Markets were quick to interpret his comments as hawkish, with equities selling off and bond yields rising. New York Federal Reserve president Bill Dudley added more fuel to the fire by saying that four rate hikes by the Federal Reserve this year would still constitute a "gradual" pace of tightening.
Market losses extended further on Thursday on fears of trade wars following Donald Trump's announcement of a 25% import tariff on steel and 10% on aluminum. While nothing has been signed yet, should these tariffs be introduced, they will lead to higher input prices for many manufacturing and construction industries which rely heavily on steel and aluminum inputs and ultimately result in higher prices for U.S. consumers, thus posing an upside risk to the Fed's inflation outlook. The Fed may look through a one-time change in prices as a result of tariffs, but will be cautious on the impact on inflation expectations and potential economic growth – trade wars are not typically good for productivity growth.
Still, for the time being there is not much in the incoming data to indicate that the economy is overheating. Inflation-wise, both headline and core PCE inflation remained unchanged in January, coming in at 1.7% y/y and 1.5% y/y, respectively. Real consumer spending fell by 0.1% on the month, despite strong gains in real disposable income (+0.6% m/m) on the back of lower taxes. Indicators of housing activity were also soft. Coming on the heels of a decline in existing homes, January sales of new homes and the forward looking pending sales of existing homes also weakened. Ditto for auto sales, which edged down to 17.0 million units in February from 17.1 million in January. All in all, similar to the prior years, both consumption and GDP will start the year on a softer footing.
That being said, the slowdown will likely be short-lived. Some of the weakness in consumption is likely a pullback from the hurricane-induced ramp up at the end of 2017, and some due to "residual seasonality," which has become apparent in recent years. Barring unexpected developments trade-side, tax cuts and a tightening labor market will prop up household income this year, supporting robust consumer spending and above-trend growth over the remainder of 2018.
All in all, the latest data does not change the calculus for the Fed with three rate hikes expected this year, however, the central bank will certainly need to keep a close watch of the economy, given rapidly evolving U.S. public policy.
Canada - Placeholder Federal Budget Caps Busy Week
It was a fairly busy week for Canadian markets, with several key economic reports and a budget to boot. Sentiment has soured during the week, with the TSX lower in recent days, partly on the back of statements by President Trump indicating that he planned to put punitive tariffs on aluminum and steel imports, sparking fears of a trade war. Softer oil prices amid a larger-than-expected inventory build south of the border also weighed on bourses, as did the inaugural testimony to Congress by the newly-minted U.S. Federal Reserve Chair Powell, who struck a bullish tone, signaling that the pace of hikes may be faster than expected. Powell's speech also sent global bond yields higher though the back-up in Canadian bond yields proved temporary, as weak domestic data weighed on them.
Arguably, the marquee event on the economic calendar this week was the release of the federal budget for the fiscal year 2018-19. The federal government plans to use an improved fiscal starting position to fund an array of new initiatives. This should inject some modest near-term stimulus into the Canadian economy. However, the government is banking on the notion that on-going economic growth coupled with slower program spending will keep the federal deficit at a manageable 1% of GDP and the leave the debt-to-GDP profile on downward track (Chart 1). Despite some $20 billion in new spending initiatives announced, in many ways the budget felt like a placeholder. Sweeping U.S. tax reforms have eroded Canada's competitiveness on the global stage, leading to calls for a response from the government. However, the budget contained little in the way of measures to address Canada's disadvantaged position, opting for monitoring instead. At this point, it appears that the government is keeping its powder dry ahead of next year's pre-election budget.
While the budget took centre-stage early on, the release of the Q4 GDP figures capped off the week. GDP growth hit 1.7% (annualized) in the fourth quarter, averaging a robust 3.0% during 2017 overall. The quarterly pace represented a slight strengthening from Q3, but was below the Bank of Canada's estimate of 2.5%. Net trade was slightly less of a drag on growth, with exports improving in part due to higher automotive production – previously depressed on maintenance shutdowns and a labour disruption. Consumer spending slowed sharply but nonetheless remained a positive contributor to growth, while residential investment benefitted from higher home sales ahead of the implementation of the B20 guidelines (Chart 2). On a monthly basis, December's gain was a modest 0.1%, as growth was restrained by weak construction, manufacturing, wholesale and retail activity.
All told, economic growth has clearly downshifted from the solid pace observed in the first half of 2017 while December's relatively modest print points to rather soft momentum heading into 2018. This will likely motivate a downgrade to the Bank of Canada's forecast for growth, and affords more patience on the rate hike front.
U.S.: Upcoming Key Economic Releases
U.S. Employment - February
Release Date: March 9, 2018
Previous Result: 200k, unemployment rate: 4.1%
TD Forecast: 175k, unemployment rate: 4.1%
Consensus: 203k, unemployment rate: 4.0%
We expect nonfarm payrolls to advance by a respectable 175k in February, recording a pace slightly below the 6-month average trend. We expect the unemployment rate to stabilize at 4.1% though unrounded figures should show a decline. All eyes are on average hourly earnings following the January upside surprise that left wage growth tracking at 2.9% y/y. With the 12th of the month landing on a Monday, calendar effects are favorable in February for a strong 0.3% m/m print. However, we see scope for disappointment as monthly readings have a high tendency to mean revert, while any wage increases in response to tax reform are likely insignificant in the aggregate. We expect a 0.2% m/m increase, leaving the y/y pace lower at 2.7% vs 2.9%. Downward revisions cannot be excluded as well, which point to further downside risk to the y/y figure.
Canada: Upcoming Key Economic Releases
Canadian International Trade - January
Release Date: March 7, 2018
Previous Result: -$3.2bn
TD Forecast: -$3.0bn
Consensus: N/A
TD looks for the merchandise trade deficit to narrow to $3.0bn in January on higher export and import activity. Energy will provide the driving force behind export growth though we also see upside risks to non-energy exports on a surge in motor vehicle production, which continues to normalize after transitory disruptions. Imports should see a more tepid pace of growth on the slowdown in consumer spending, though aircraft imports should rebound on Boeing deliveries.
Canadian Employment - January
Release Date: March 9, 2018
Previous Result: -88k, unemployment rate: 5.9%
TD Forecast: 2k, unemployment rate: 5.9%
Consensus: N/A
We expect job creation to print at a subdued 2k in February after the January cold shower of -88k. While outsized LFS prints tend to reverse the following month, we think the dismal January report is mostly explained by the impact of the Ontario minimum wage hike and unsustainable gains over the prior three months as LFS outperformed the less timely SEPH measure by roughly 130k in Q4, the largest gap on record. Moreover, we expect the Ontario minimum wage hike to continue weighing on the regional labour market and we could see further job losses in February, concentrated in low-wage industries (accommodation and food services). We do see scope for a reversal in the full/part time split at the national level, which would add a downbeat tone to the headline print. We expect a small rebound in labour force participation after the rate fell 0.3pp in January, though the unemployment rate should hold at 5.9% from an unrounded 5.85% the prior month. Finally, wage growth for permanent employees is expected to slip to 3.0% from 3.3% on base effects and moderating underlying wage pressures.
Week Ahead – Big Week for Central Banks as ECB, BoJ, RBA and BoC Meet; US Jobs Report also...
The coming week looks set to be dominated by central banks as policymakers in Europe, Canada, Australia and Japan gather for their corresponding policy meetings. Economic data shouldn't escape the headlines however as Australian GDP, Chinese trade figures and US and Canadian jobs reports will be eagerly awaited. However, early in the week, politics will be setting the mood, particularly for the euro as Italians go to the polls to vote for a new government on Sunday and Germany's SPD party publishes the results of the postal vote by its members on whether to approve the coalition deal struck with Chancellor Merkel's CDU party.
Important week for Australian dollar
Fourth quarter growth figures and the Reserve Bank of Australia's policy meeting will put the spotlight on the aussie next week but there will also be plenty of other data out of Australia to keep aussie traders busy. The week will start with January building approvals and Q4 business inventories on Monday. After this week's disappointing capital expenditure numbers, another weak reading of a GDP component would raise the risk of a negative surprise in Wednesday's growth figures. On Tuesday, January retail sales will be watched to gauge the strength of Australian consumer spending at the start of 2018, while the net exports contribution for Q4 will be the final barometer for the GDP release the following day. Rounding up the week will be January trade numbers on Thursday.
Australia's economy is forecast to have expanded by 0.6% quarter-on-quarter in the final three months of 2017, the same rate as in the prior period. The RBA will likely already have a sneak preview of the GDP data when it meets on Tuesday. The central bank is widely expected to keep its cash rate unchanged at 1.5% as inflation and wages remain subdued. Weak GDP growth could prompt the RBA to tone down its recent upbeat view but will likely take comfort from the aussie's 5% slide versus the US dollar from January's 2½-year high.
Apart from domestic factors, the aussie could face additional volatility coming from Chinese indicators. The latest trade data out of China on Thursday will be eyed to see how exports and imports withstood the long Lunar New Year holiday in February. Friday's consumer and producer prices indices could also show some impact from the new year celebrations.
Bank of Canada and employment report may add to loonie's woes
The Canadian dollar slid to a 2-month low this week, with USD/CAD breaking above the 1.28 level as the US currency regained some positive momentum. While the February jobs figures may provide the loonie a helping bump up, the Bank of Canada meeting poses a downside risk. The Bank of Canada's latest policy decision is due on Wednesday and after three rate hikes in the past eight months, the Bank could be headed for a pause. The latest data for January was mixed with employment and retail sales numbers missing estimates by a wide margin but inflation unexpectedly picking up. Comments from BoC policymakers have been more cautious of late and markets are not fully pricing in another rate hike until July. If the BoC reiterates its data-dependent view, the loonie may continue to drift lower. However, a robust employment report on Friday could go some way in bringing rate rise expectations forward to May.
No surprises expected from Bank of Japan
The Bank of Japan will be another central bank holding a monetary policy meeting in the next seven days and like the RBA and the BoC, it is not expected to make any tweaks to its policy even as the Japanese economy continues to improve. There will be more evidence of this strength on Wednesday when revised GDP figures for the fourth quarter are released. GDP growth is forecast to be revised upwards from 0.5% to 0.9% on an annualized basis. However, with corporate Japan unwilling to pass on higher earnings to employees, there's been insufficient progress in wage growth and consumer price inflation for the BoJ to start reducing its massive stimulus program. An appreciating yen over the past month also stands in the way of this progress, though BoJ Governor Haruhiko Kuroda has already started to look ahead with recent talk of policy normalization. Such language is unlikely to be included in Friday's decision statement however, when the Bank concludes its two-day policy meeting. The BoJ is expected to maintain rates at -0.1% and the target on 10-year Japanese government bond yields at 0%.
ECB to drop easing bias?
The European Central Bank will be among next week's highlights as it holds its March policy meeting. Economic data will not be sparse but are unlikely to generate significant moves in the euro. The Eurozone sentix index, final Markit PMIs and retail sales figures will kick-off the week on Monday. On Wednesday, the third estimate of Q4 GDP growth is published but no revision to the prior 0.6% q/q reading is being forecast. German data will also attract attention with industrial orders due on Thursday, and industrial production and trade numbers out on Friday (all for January).
Markets' focus will instead be ECB President Mario Draghi's latest views on the Eurozone economy and inflation at his post-meeting press conference on Thursday. No change in policy is expected from the ECB but a tweak in the Bank's statement is possible according to a Reuters report citing ECB sources. The farthest the ECB is likely to go this month is to drop its pledge to increase its asset purchases if necessary, with a bigger decision on updating the Bank's forward guidance not anticipated before April.
Flash CPI estimates out this week showed euro area inflation slowed to a 14-month low of 1.2% in February, supporting the case for a very gradual exit from QE. The single currency could retreat further from last month's 3-year peaks if Draghi repeats the dovish stance when he testified before the European Parliament earlier this week.
UK services PMI unlikely to inspire sterling
After sliding to a 7-week low just above $1.37, the pound may struggle to find much support from the few data releases coming out of the UK next week. Services activity is expected to edge up marginally in February, with the Markit/CIPS PMI rising from 53.0 to 53.3 on Monday. Industrial and manufacturing output will be the next major data on Friday. After a sharp slowdown in December, both indicators are forecast to rebound in January. Industrial production is expected to jump by 1.1% month-on-month in January, while manufacturing output is forecast to grow by 0.2% m/m. January trade figures are also due on Friday.
US pay growth back in focus
Just as markets were beginning to recover from the turmoil set off by the stronger-than-expected wage growth figures in January's US jobs report, President Trump's decision to impose steel and aluminium tariffs has cast fresh cloud over the outlook, putting markets in a vulnerable footing from any surprises in Friday's nonfarm payrolls report. Ahead of the jobs data, the ISM non-manufacturing PMI for February will be eyed on Monday, followed by January factory orders on Tuesday and the trade balance on Wednesday.
February's jobs report is expected to show another month of solid gains in nonfarm payrolls, with a consensus of 190k jobs being added to the US economy. The unemployment rate is forecast to tick down to 4.0% in February from 4.1%. However, the annual growth in average hourly earnings is forecast to ease slightly to 2.8% from January's 8½-year high of 2.9%. A stronger reading could exacerbate the concerns about inflation taking off this year, which would lead to a more aggressive Fed tightening. Without a positive wage component though, a broadly strong report may not impress dollar bulls, especially against the backdrop of rising risks of a trade war.
Dollar Retreats as Trade War Talk Escalates
Fed's Chair words boosted USD but Trump's view on trade sparked a sell-off
The US dollar was set to end the week on a positive note after Fed Chair Jerome Powell testified twice and other Fed speakers signalled a hawkish view on the economy. The USD had appreciated on a weekly basis up until Thursday when President Donald Trump announced a 25 percent tariff on steel and 10 percent on aluminium imports. Markets reacted to the protectionist measure with Trump unfazed by criticism and tweeting that Trade wars are good, and easy to win. The decision turned a USD on the rise against major pairs into a mixed bag. The USD is up against the AUD, CAD, GBP and NZD but depreciated against the EUR and JPY.
- 4 central banks (RBA, BOJ, BOC and ECB) expected to keep rates unchanged
- US wages could rise increasing inflation anxiety
- Employment data to be released in the US and Canada
Central Banks and US Employment Data to Guide Markets
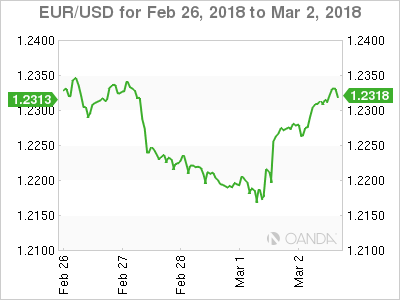
The EUR/USD gained 0.24 percent during the week. The single currency is trading at 1.2323 after the anti-trade measures announced by the Trump administration on Thursday. The Dollar was headed for a strong month on the back of economic fundamentals and the hawkish comments from Fed Chair Jerome Powell. The market was beginning to price in another rate hike to the 3 already expected which boosted the USD across the board. The tariffs announced by President Trump reversed the gains against the EUR.
Next week will be a rollercoaster for investors with an economic calendar that features four central banks: Reserve Bank of Australia (RBA), Bank of Canada (BoC), European Central Bank (ECB) and the Bank of Japan (BOJ) as well as the release of employment data in Canada and the United States. The U.S. non farm payrolls (NFP) will be published on Friday, March 8 at 8:30 am EST with another gain of 200,000 jobs expected and a wage increase of 0.3 percent.
The ECB will deliver its rate statement on Thursday, March 8 at 7:45 am EST. President Mario Draghi will host a press conference at 8:30 am. There are no major changes expected to the interest rate or the quantitative easing program, but the central bank could take the opportunity to make minor tweaks to the language. The ECB will be cautious in its use of communication to avoid market overreaction. The central bank is expected to end its QE program at the end of the year, but it awaits a stronger inflationary pressures before signalling the move.
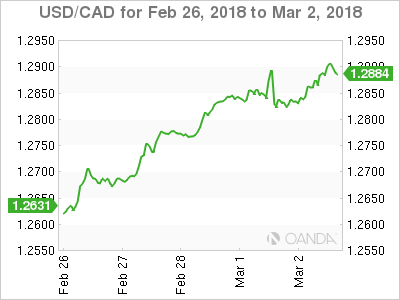
Canadian dollar weekly graph February 26, 2018
The USD/CAD gained 2.20 percent in the last five trading days. The currency pair is trading at 1.2907 after the Canadian currency could not deflect the one-two punch of Fed hawkish rhetoric and protectionist tariffs from the White House. Interest rates are expected to rise three to four times in 2018. Fed members have been very vocal on the subject and although it is still gradual as the moves will be for 25 basis points each, it does signal and end of low rates in the US.
The Bank of Canada (BoC) will release its rate statement on Wednesday, March 7 at 10:00 am EST. The interest rate is forecasted to remain at 1.25 percent but the central bank is still expected to hike two times this year. Growth expectations are lower after a slowdown in the final quarter of 2017 was evident with the release of the Canadian GDP on Friday. Annual GDP gained 1.7 percent, short of the 2.0 percent forecast and offering little support for the struggling loonie.
Canadian jobs data will land at the same time at US jobs on Friday, March 9 at 8:30 am. The U.S. non farm payrolls (NFP) will steal most of the spotlight as inflation anxiety has stricken stock markets around the globe. Wage growth in the United States will be key on Friday as inflation is the one factor missing that would force the Fed to raise interest rates to avoid the economy overheating.
NAFTA talks are still ongoing, but this week the steel tariffs are drawing a more dire future for the trade agreement. The seventh round will wrap up in Mexico City and so far there is very little progress. Mexico and Canada have said that they will retaliate if they fall under the steel and aluminum tariffs, but at this point as it is becoming the norm with the Trump Administration there are few details on the full scope of the tariffs.
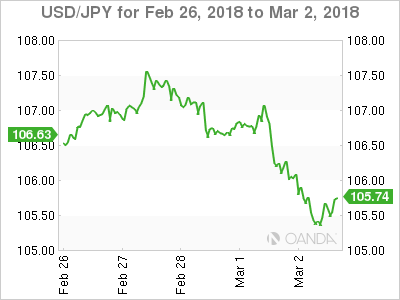
The USD/JPY lost 1.22 percent in the last five days. The currency pair is trading at 105.55. The Japanese Yen has been one of the biggest movers against the American currency appreciating 6.25 percent versus the greenback. The Yen has reached levels it hadn't been trading at since prior to the US elections.
The Japanese currency was the big winner of the week that saw Fed rhetoric and trade war drive the market. The Bank of Japan (BOJ) will feature this week on Wednesday and Thursday when it release its rate statement and a press conference with BOJ Governor Haruhiko Kuroda. The Governor has just been reappointed for a second term and on Friday hinted about ending the massive stimulus in 2019.
Market events to watch this week:
Monday, March 5
- 4:30am GBP Services PMI
- 10:00am USD ISM Non-Manufacturing PMI
- 7:30pm AUD Current Account
- 7:30pm AUD Retail Sales m/m
- 10:30pm AUD Cash Rate
- 10:30pm AUD RBA Rate Statement
Tuesday, March 6
- 4:35pm AUD RBA Gov Lowe Speaks
- 7:30pm AUD GDP q/q
Wednesday, March 7
- 8:15am USD ADP Non-Farm Employment Change
- 8:30am CAD Trade Balance
- 10:00am CAD BOC Rate Statement
- 10:00am CAD Overnight Rate
- 10:30am USD Crude Oil Inventories
- 7:30pm AUD Trade Balance
Thursday, March 8
- 7:45am EUR Minimum Bid Rate
- 8:30am EUR ECB Press Conference
- Midnight JPY BOJ Policy Rate
- Midnight JPY Monetary Policy Statement
Friday, March 9
- JPY BOJ Press Conference
- 4:30am GBP
- Manufacturing Production m/m
- 8:30am CAD Employment Change
- 8:30am USD Average Hourly Earnings m/m
- 8:30am USD Non-Farm Employment Change
*All times EDT
AUDJPY Sharply Bearish and Oversold
In February, AUDJPY recorded its worst monthly performance since April 2016, posting a loss of 5.8%. The negative sentiment remains strong in the first days of March, with prices hitting a 10-month low of 81.59 today but momentum indicators signal that the market could be overextended in the four-hour chart.
The Relative Strength Indicator (RSI) has been trending below 30 in oversold territory during the past two days, while Stochastics have posted a bullish cross below 20, flagging that upside movements might be underway in the near-term. The trend, however, might remain to the downside as long as prices continue to trade below the 20-period simple moving average line (SMA) and the Ichimoku cloud.
Should the pair head lower, the 81.00 key-level, last seen in November 2016, could provide nearby support. A closing bar below this mark could open the door to the 80.00 and 79.00 psychological marks.
To the upside, AUDJPY could meet resistance at the red Tenkan-Sen line at 82.35 before it extends its recovery to the 20-period SMA at 82.80. If the market manages to step above this area, bulls' radar could target the previous-support handle of 83.29 and then the 50-period SMA at 83.51.
After Quick Start, Canadian GDP Growth Ends 2017 Slower
Red hot growth in the first half of the year gave way to only tepid growth in the second half in Canada in 2017, but for the year as a whole it was the biggest increase in GDP growth since 2011.
Soft Second Half
Real GDP growth in Canada came in at a 1.7 percent annualized rate in the fourth quarter. Not only was that a bit below expectations, but the initially reported growth for Q3 was revised a bit lower as well. In short, after growing faster than the rest of the G7 in the first half of the year, Canada's economy slowed more than initially reported in Q3 and grew less than expected in Q4.
When we look into the underlying details, there is evidence of some of the factors we have cited among our top worries for Canadian growth. Specifically, there were signs of fatigue in consumer spending and a softer pace of inventory investment. Consumer spending expanded at just 2.1 percent, the slowest pace of expansion all year. Inventories are still building but at a more modest pace, the result of which was a full percentage point drag on headline GDP growth.
Looking forward, we remain concerned about elevated household debt levels and the run-up in home prices that have occurred alongside the leveraging process over the past several years (middle chart). The Bank of Canada may be somewhat less inclined to raise rates quickly after this report, but the eventual normalization of interest rates could further hamstring household spending. On the inventory side, stockpiling in 2017 may result in further drags on growth in 2018 as a more normal pace of inventory building would act as a governor on the pace of broader GDP growth.
Over time, we also expect to see a retrenchment in business fixed investment, though we saw no signs of it here in the fourth quarter despite three straight periods of expansion earlier in the year. Remarkably, not only did business spending stay positive, it actually posted its fastest pace of expansion all year, growing at a 9.5 percent annualized pace. The question going forward is the extent to which this strength reflects some pent-up demand after business spending suffered during the low oil-price environment of 2015 and early 2016, or whether the pick-up is a function of a re-emergence of animal spirits and the gathering momentum of global growth.
Down Where the Trade Winds Play
It has been a rather consequential week for North American trade dynamics. Not only were the latest rounds of NAFTA negotiations underway this week in Mexico City, there was also the announcement of steel and aluminum tariffs rolled out this week by the White House. As of this writing, it is unclear whether Canada will receive an exemption on the tariffs. Our analysis finds that Canada supplies roughly 20 percent of imported steel and iron to the United States, so clearly without an exemption the new U.S. tariff would be bad for Canadian exports. For the fourth quarter anyway, Canadian exports expanded at a 3.0 percent pace, although with imports growing faster, trade was actually a drag on growth in the fourth quarter.
Australia & New Zealand Weekly: RBA on Hold, AUD to Weaken through 2018 and 2019
Week beginning 5 March 2018
- RBA on hold: AUD to weaken through 2018 and 2019.
- RBA: March policy decision, Governor Lowe speaks.
- Australia: GDP, company profits, current account, trade, retail sales, dwelling approvals.
- NZ: building work, retail card spending.
- China: CPI, foreign direct investment, trade balance.
- Euro Area: ECB policy decision, Italian General Election, SPD coalition vote results.
- US: nonfarm payrolls, Federal Reserve Beige Book.
- Central banks: BoC policy decison, BoJ policy decision.
- Key economic & financial forecasts.
Information contained in this report current as at 2 March 2018.
RBA on hold : AUD to weaken through 2018 and 2019
The Reserve Bank Board meets next week on March 6. Of course we expect there will be no change in the overnight cash rate.
We also do not expect to see any significant change in the Governor's rhetoric from last month.
The GDP Report for the December quarter - which we expect will show that annual growth has slowed from 2.8% in the year to September to 2.5% - will not print until March 7 and although the Bank will be anticipating a soft result, this is unlikely to dissuade it from its current view that GDP growth in 2018 will lift to 3.25%.
Readers should be aware that Westpac has reviewed its currency forecasts and, while continuing to see an AUD low of USD 0.70 in 2019, has pushed out the timing to September 2019 from March. Below I set out detailed reasoning behind our AUD views.
We expect to see the AUD gradually fall through 2018 and 2019 against the USD.
The AUD is likely to hold around USD 0.77 to June before falling to USD 0.74 by year's end.
In 2019 it is expected to reach USD 0.70 by September and to hold around that level to year's end.
These forecasts broadly reflect our Fair Value model after making some adjustments for our own judgements particularly around capital flows that may not be fully explained by commodity prices and interest rates.
The key drivers behind our views are: a fall in Australia's commodity export prices, and an unprecedented sharp negative widening in the AUD/USD interest rate differential as US rates rise sharply. Furthermore, we anticipate a reversal of the current trend for the USD to weaken against the other majors.
The key to commodity prices lies with China. China's Chairman Xi recently identified pollution; poverty and excessive leverage as China's key policy challenges.
Our commodity price views have been based around the expected slowdown in China's credit growth (particularly in the unregulated so-called shadow banking sector) firstly squeezing commodity speculators who currently hold substantial stocks of iron ore and secondly slowing investment particularly in major transport projects. These projects are typically associated and funded by local governments, usually outside the regulated banking sector. They place considerable reliance on funding from the shadow banking system. In addition, housing activity, which also partly relies on the shadow banking sector, looks set to remain quite flat over the next few years.
While these are clear factors which are likely to weigh on commodity prices, China's anti-pollution policies have been supporting iron ore and coking coal prices. Small high polluting mines/furnaces have been closed down with some production moving to larger more efficient operations. These larger producers have been using a higher share of quality imported iron ore, effectively holding up import prices despite lower production.
The dominant iron ore exporters - Australia and Brazil - have not been significantly lifting production to take advantage of higher prices and widening margins.
These dynamics will continue to support prices for some time yet. Nevertheless we expect that over the course of the second half of 2018 and through 2019, the downward pressures associated with a slowing economy and tighter credit conditions in China will gradually take their toll on both iron ore and coal prices.
We would also expect some downward price pressure from a lift in supply from the dominant exporters. Margins remain extremely attractive and we expect producers, particularly the Brazilians (around 30% of the majors' production) to lift production.
Overall, we are expecting a cumulative fall (in USD's) in Australia's Commodity Price Index of around 25% between June 2018 and December 2019. That includes around a 6% appreciation in the USD Index.
The USD Index has been under considerable recent pressure (down 15% from its peak in late 2016 to its low in mid-February). Recently it has lifted by around 2% partly reflecting the sharp rise in US bond rates.
While I was recently in the US visiting real money managers and officials, the common theme was that the recently enacted Tax Cuts and the $300 billion spending package were poorly timed. They coincided with the US economy at full employment and building momentum. The likely resulting inflation pressures and a rising FEDERAL FUNDS RATE were expected to significantly boost bond rates. In turn, higher bond rates are likely to reverse the recent weakness in the USD.
Readers will be aware that Westpac expects a considerable widening in the negative Australia/US interest rate differential as the FEDERAL RESERVE continues to raise rates and the RBA remains on hold.
Markets move on expectations.
They are currently pricing in a yield differential between Australia and the US overnight rates of around negative 50 basis points by end 2018 whereas Westpac expects negative 65 basis points. They are expecting a differential of around negative 30 basis points compared to Westpac's forecast of negative 112 basis points by end 2019.
Our expected differential in 2019 has no precedent raising the prospect that the downward pressure on the AUD could be under stated in our forecasts.
We anticipate that as markets adjust to Westpac's rate differential outlook there will be further downward pressure on the AUD. This effect is likely to be more pronounced in 2019 than 2018 with the gap between Westpac's view and the market narrowing significantly in 2019. Note that only a few weeks ago markets were only expecting a negative differential of 28 basis points by end 2018. They have moved significantly towards the Westpac view. But there is more to come.
Falling commodity prices; widening negative yield differentials and a stronger USD all point to a weaker AUD through the remainder of 2018 and 2019.
The week that was
Market participants and the RBA have long been waiting for an uplift in business investment. In the latest CAPEX release, there is cause for optimism (albeit measured). While the quarterly outcome which feeds into GDP disappointed, this came as a result of a latecycle bout of weakness in mining investment, as key gas projects draw near completion. More importantly for the outlook was the 1.8%, 10.4%yr gain for CAPEX across the non-mining economy. This upswing is being driven by construction work, particularly non-residential activity to meet the needs of a growing population. Victoria is the most notable beneficiary by state.
In addition, the forward estimates for 17/18 and 18/19 financial years were on the upside. See chart of the week for further detail.
A consequence of the above CAPEX disappointment in the December quarter (and last week's construction release) is that we have shaved our Q4 GDP forecast for next week by 0.1ppt to 0.5%, 2.5%yr. Of the contributors to the overall forecast, the positives include: a modest bounce for consumption 0.7%, 2.1%yr; a 1.5%, 7.0%yr gain for business investment; and a gain for public spending of 0.6%, 4.4%yr. Net exports will however subtract 0.6ppts in the quarter. Looking to 2018, the sub-trend pace of expansion is set to persist as the consumer is restrained by weak wages growth, and the home building downturn continues.
Important to both of these factors, house price growth remained in a downtrend in February. The national composite has fallen 1.3% since October, led by declines in Sydney. Here, annual price growth turned negative for the first time since late 2012, - 0.5%yr. In Melbourne, annual price growth has instead held up, 6.9%yr in February. Recent data on auction clearance rates point towards a stabilisation in prices in the months ahead. For an in-depth assessment of Australian housing markets, see our latest Housing Pulse report.
Turning to the US, new FOMC Chair Jerome Powell's first Congressional testimony was the focus for markets this week. In his first appearance, before the House of Representatives Committee, he struck a confident and committed tone, emphasising that since the December FOMC meeting, the economy had strengthened on the back of tax and spending initiatives from the government and given continued gains for employment and confidence. The market debate quickly turned to whether the next set of forecasts from the Committee would point to four rather than three rate hikes in 2018. However, a subsequent repeat performance before the Senate carried a more cautious tone on wages and inflation, and this saw market pricing revert to where it began the week - President Trump's trade announcement was also a contributor (see below). It is very clearly the case that US interest rates are on the way up. Debate over the timing and the overall scale of the increase will continue through 2018; how the market reacts to each rise holds great significance. We continue to expect three hikes this year and another two in 2019, but see the risks skewed to the upside.
A new point of tension that has come to the fore this week is trade relations. Overnight President Trump announced tariffs on steel (25%) and aluminium (10%) imports to the US in pursuit of greater production and employment in the US. Only time will tell whether this is a one-off or the first in a succession of protectionist measures. It will also be critical to assess how other countries respond, either through challenging the tariffs via the World Trade Organisation, or by responding with their own measures. Along with the fiscal uncertainty being created by the tax and spending initiatives (which could add near 15ppts to US government debt over the decade, if sustained), trade will be a key area of uncertainty for the US economy (particularly the US dollar) in 2018.
One of the countries that is likely most affected by these measures is China. Data to hand for 2018 suggests that, while authorities are having great success reducing speculation absent a substantial decline in residential construction activity, Chinese growth is still very susceptible to global growth trends. External demand provided a material windfall to China in 2017; but this will not be the case in 2018. Should additional protectionist measures be imposed by the US or others, the headwinds will grow stronger still.
Lunar new year holidays make assessing Chinese data and that of other Asian nations difficult at this time of year. However, from the official China PMI's, there is some evidence that underlying momentum in manufacturing topped out at the end of 2017, and is set to slow in 2018. Being more domestically focused, growth in services has held up. For the rest of Asia, conditions are strong. This is particularly the case for Japan which is benefitting not only from a comparatively cheap currency but also its strong, export-focused corporate sector.
Chart of the week: Business investment plans
The ABS business plans survey suggests that the upturn in business investment that emerged in 17/18 will extend into 18/19.
Estimate 5 for investment in the current financial year implies a 2.5% gain on the 2016/17 year, as non-mining investment offsets the dissipating drag from mining. The first estimate for the 2018/19 financial year suggests this uptrend will continue, with a 3.5% gain overall and an 8.0% rise for non-mining spending expected. The mix remains skewed to buildings and structures (13.5%) over equipment (2.0%). Note that early estimates for the coming financial year are highly volatile. Further, the CAPEX survey is only a partial representation of business investment. That said, to the extent that it omits key growth industries, the estimates are more likely to be skewed to the downside than upside.
Looking to next week, RBA Governor Lowe is giving a speech on the "The Changing Nature of Investment" on Wednesday Mar 7.
New Zealand: week ahead & data wrap
The start of 2018 has seen divergent conditions across the New Zealand economy. Households have hit the ground running, and spending looks like it will remain firm for some time yet. In contrast, gauges of business sector activity remain soft.
Households resilient
Looking first at the household sector, the strength in spending that we saw at the close of 2017 has carried through into early 2018. Retail spending rose by a solid 1.4% in January, including strong gains in categories such as durables and hospitality. We expect that the February figures (out next week) will show that spending is continuing to grow at a healthy pace.
Contributing to this firmness in spending have been the recent pick-up in the housing market and the resilience in net migration. Both of those factors were key drivers of demand growth in recent years. And while they are now off their earlier peaks, they remain in supportive territory. However, these are also areas where we expect conditions to change markedly over the next few years, and over time that will have a dampening impact on spending.
On the housing front, we have seen a bit of a second wind over the past few months as election related uncertainty has faded and mortgage rates have fallen. With fixed mortgage rates falling further in recent weeks, and the Reserve Bank slightly easing its LVR mortgage lending restrictions, we expect the current market buoyancy will continue for a few more months. Housing market conditions have a close relationship with household spending in New Zealand, particularly for durable items like home furnishings. And with both home sales and prices lifting in recent months, it's no surprise that housing spending has remained firm.
However, even with the recent pick-up, the housing market is looking softer than it did this time last year, especially in Auckland where sales are down 20% over the past year and prices have been flat. Going forward, we expect the current resurgence will eventually give way to an extended period of soft housing market activity. In part, this is because we expect fixed mortgage rates will creep higher later this year. On top of this, the Government will be rolling out a range of policies aimed at dampening housing market conditions over the next few years including restrictions on foreign buyers, an extension of the 'bright line' test for capital gains, and the ring-fencing of losses on investment properties. This combination of polices will result in a markedly different set of housing market conditions than New Zealand has experienced in recent years, with investor demand likely to be significantly curtailed.
One of the other big drivers of household spending in recent years has been rapid population growth on the back of record levels of net migration. Through mid-2017, it looked like the migration cycle had peaked, as arrivals levelled off and departures trended upwards. However, net migration has picked up again over the past few months as arrivals have pushed higher. This has seen annual net migration stabilising at a very high level of 70,000. The key question is whether we will see net migration resuming its downtrend over the coming months. Movements of New Zealanders in and out of the country have remained stable, and we are continuing to see a gradual increase in departures of non-New Zealanders. The big uncertainty relates to new arrivals. January's pickup in arrivals was large, and it wouldn't be surprising to see some pull back next month. In addition, we are seeing firmer conditions in other countries, which will make New Zealand look relatively less attractive. Putting this altogether, we continue to expect that net migration will decline over the next few years, however this may be quite gradual.
Business nervousness persists
Turning to the business sector, things are looking very different. Slowing GDP growth and the changing political backdrop saw business confidence fall sharply in late-2017. And while we have seen some recovery in early-2018, businesses remain deep in pessimistic territory.
Importantly, it's not just confidence about the general economic environment that has taken a knock. Activity indicators from both the PMI and PSI remain down on their pre-election levels. That includes a pullback in new orders, suggesting that we could see further softness over the months ahead.
With businesses still nervous about the economic backdrop, we've been factoring in a period of softness in investment spending over the coming year. However, due to the lags associated with capital spending, we don't expect to see this coming through until mid to late 2018. Indeed, this week's trade figures actually showed that imports of capital equipment remained firm in January.
Data Previews
Aus Q4 company profits
Mar 5, Last: - 0.2%, WBC f/c: 4.0%
Mkt f/c: 1.5%, Range: -1.5% to 6.0%
- In Q3, company profits were little changed, -0.2%, to be 1.7% higher for the year to date. Falls in mining (on lower commodity prices) and real estate (as housing cools) were offset by gains across business service sectors.
- For Q4, we anticipate a rise of 4.0%qtr, inflated by higher prices boosting the value of inventories (which is booked as a profit). However, on a national accounts basis (abstracting from this valuation adjustment) a more modest rise is likely, around +1.3%.
- Mining profits are expected to rise by almost 6% in Q4, having received a boost from higher commodity prices.
- Non-mining profits are trending higher, supported by a strengthening of domestic demand, but are mixed by industry, given an uneven expansion. For Q4, we anticipate a rise of around 3% (incorporating the artificial boost from the inventory valuation adjustment).
Aus Q4 inventories
Mar 5, Last: 0.2%, WBC f/c: 1.0% (0.3ppts)
Mkt f/c: 0.5%, Range: -0.3% to 5.6%
- Inventories were volatile in 2017, in part due to the impact of weather disruptions over the first half of the year.
- In Q3, inventory levels broadly stabilised, expanding by 0.2% ($0.3bn), to be 1.0% above the level of a year earlier. Inventories added 0.2ppts to activity in the period.
- For Q4, we expect a return to volatility, with a 1.0% ($1.6bn) rise in inventories, adding 0.3ppts to activity.
- Notably, imports of goods (ex fuel) spiked in the month of December, up 6% ($1.3bn), suggesting an abnormal clustering of shipments ahead of the new year. Some of these imported items will show-up initially as inventories
- Another consideration, mining inventories contracted sharply in Q3, -$0.7bn (in part to facilitate a lift in export shipments), a result that is unlikely to be repeated in Q4.
- As always with inventories, we note the elevated uncertainty.
Aus Jan dwelling approvals
Mar 5, Last: - 20%, WBC f/c: 1.0%
Mkt f/c: 5.0%, Range: 0.0% to 11.0%
- Dwelling approvals retraced spectacularly in Dec, dropping 20% as a an expected wind-back in Melbourne high rise approvals, after a big spike in Nov, was compounded by weakness elsewhere. Looking through recent volatility, trend approvals are again moving lower with non high rise approvals in Q4 down 3.5%yr. Assessing trends in the erratic high rise segment is much trickier but site purchases continue to point to this segment taking a further leg lower over the course of 2017-18.
- Latest housing finance data point to a slightly firmer trend in non high rise approvals in coming months. Although high rise should remain weak, this is likely to see a marginal 1% rise in total approvals in Jan. As always, housing data should be treated with extra caution around the summer holiday low period as seasonal adjustment can amplify monthly volatility.
Aus Jan retail trade
Mar 6, Last: - 0.5%, WBC f/c: 0.4%
Mkt f/c: 0.4%, Range: 0.1% to 0.6%
- Retail sales had a bumpy finish to 2017 with a solid recovery in Sep-Nov from weakness mid year giving way to a 0.5% decline in the Dec month. The iPhone X launch and increasingly popular 'Black Friday' sales were positives but may also have shifted the timing of sales. Alongside this monthly volatility, the quarterly data showed significant price declines for non-food categories associated with the launch of Amazon's Australian operations. Note that Amazon's Australian retail sales are in scope for the retail survey and should appear in sales estimates going forward.
- The wider consumer backdrop was reasonably positive at the start of 2018 with sentiment posting its best Jan read since 2010. Incomes continue to be supported by strong job gains but undermined by weak wage growth. Private sector business surveys suggest retailers saw a small lift. On balance we expect Jan retail sales to show a 0.4% gain, the inclusion of Amazon sales likely to give some boost.
Aus Q4 net exports, ppts cont'n
Mar 6, Last: 0.0, WBC f/c: -0.6
Mkt f/c: -0.6, Range: -0.9 to 0.6
- Net exports, as with inventories, were volatile in 2017, in part due to weather disruptions during the first half of the year.
- In Q3, net exports were neutral for activity, with both import and export volumes expanding by 1.9%.
- For Q4, net exports were a major headwind, subtracting an estimated 0.6ppts from activity.
- Imports rose an estimated 0.6% in Q4 to meet rising domestic demand.
- Exports stumbled, contracting by an estimated 2%, to be only 1.5% above the level of a year ago. Cereal shipments retreated from historic highs associated with the earlier bumper harvest, while coal exports fell in part due to temporary disruptions, including strike action.
Aus Q4 current account, AUDbn
Mar 6, Last: -9.1, WBC f/c: -13.0
Mkt f/c: -12.2, Range: -13.8 to -9.0
- During 2017, Australia's current account deficit has been well contained, at 2.0% of GDP in Q3, supported by elevated commodity prices boosting export earnings.
- For Q4, the current account deficit is expected to widen from $9.1bn to $13.0bn, representing 2.9% of GDP.
- Key to this, the trade position deteriorated in Q4. The trade balance swung from a surplus of $2.0bn in Q3 (revised lower from $3.1bn) to a deficit of $0.6bn in Q4. Exports stumbled at the same time as import volumes continued their upward trend (see above). As to the terms of trade, this was broadly flat in the period, we estimate.
- In Q4, the net income deficit is expected to edge higher to $12.4bn from $12.2bn. Note that the deficit has deteriorated from a 2016 average of $8.5bn/qtr as higher commodity prices translate into better returns for offshore investors.
Aus Q4 public demand
Mar 6, Last: 1.5%, WBC f/c: 0.6%
- Public demand is a key growth driver, expanding at an above trend pace in 2015, 2016 and 2017, with annual growth at 4.8%, 5.5% and 4.4% (we estimate), respectively.
- An upswing in public investment is underway, lifting from recent lows, as governments commit to additional projects - particularly transport infrastructure - now that earlier fiscal pressures at the state level have receded.
- In Q3, public demand increased by 1.5%, boosted by a sharp 7.4% jump in investment (which is often volatile quarter to quarter) but constrained by a rise of only 0.2% for public consumption (which accounts for 80% of public demand).
- For Q4, we anticipate a more modest rise in public demand of 0.6% as investment consolidates in the period.
Aus Mar RBA decision
Mar 6, Last: 1.50% WBC f/c: 1.50%
Mkt f/c: 1.50%, Range: 1.50% to 1.50%
- The RBA will almost certainly decide to hold rates unchanged at their March meeting - as they have since they last cut rates in August 2016.
- The Governor has stated that: "further progress in reducing unemployment and having inflation return to target is expected, although this progress is likely to be gradual".
- The case for patience has been reinforced by the latest price and wage updates - core inflation is only 1.6% annualised over the past half year and private wages growth is still at historic lows.
- Moreover, tighter lending standards have been helpful in containing the build-up of risk in household balance sheets.
- We continue to expect the RBA to leave the cash rate unchanged at 1.50% throughout 2018 and 2019.
Aus Q4 GDP
Mar 7, Last: 0.6%qtr, 2.8%yr; WBC f/c: 0.5%qtr, 2.5%yr
Mkt f/c: 0.5%, Range: 0.1% to 0.8%
- Real GDP expanded by a forecast 0.5% in Q4, with domestic demand up 0.7%, inventories adding 0.3ppts, with a sizeable partial offset from net exports, -0.6ppts as exports stumbled, -2%qtr. Annual real GDP growth moderates to 2.5% from 2.8%.
- Consumer spending improved, up a forecast 0.7%, after a rise of only 0.1% in Q3. Housing declined further, -1%qtr, following a strong and extended upswing.
- Business investment, +1.5%qtr, advanced having turned the corner in 2017, with a diminished drag from the mining investment wind-down and a lift in non-mining construction to meet the needs of a growing population. Public demand, +0.6%qtr, +4.4%yr, is expanding at an above trend pace, centred on an investment upswing. • See our preview bulletin for further details.
Aus Jan trade balance, AUDbn
Mar 8, Last: -1.4, WBC f/c: 0.6
Mkt f/c: 0.2, Range: -1.5 to 0.8
- In December, Australia's trade balance slumped to a deficit of $1.4bn, deteriorating from a $36mn surplus in November. Imports spiked 6.0% (+$1.9bn) in the month, suggesting an abnormal clustering of shipments ahead of the new year.
- For January, we expect a sharp reversal to a $0.6bn surplus. We highlight the uncertainty around trade forecasts, particularly in cases such as this, when the view is centred on a judgement on imports.
- The import bill is expected to decline by $1.9bn (-5.5%), fully unwinding December's spike. Contributing to the January reversal are lower prices owing to the rise in the currency, up 2% on a TWI basis and 4% higher against the US dollar.
- Export earnings are forecast to edge higher, up 0.2%, $0.1bn. A rise in iron ore exports, on higher prices and volumes, is expected to be largely offset by a moderation in coal.
NZ Q4 building work put in place
Mar 7, Last: +2.7%, Westpac f/c: +1.6%, Market f/c: 1.0%
- Construction activity picked up in September, rising by 2.7%. This was underpinned by a lift in residential construction that offset softness in non - residential activity.
- The aggregate building figures are masking stark regional differences in construction. Building activity in Canterbury is continuing its gradual post - quake wind - down. At the same time, activity is firming in other regions, including Auckland.
- The level of construction activity is elevated and there is a large pipeline of planned work. However, rising building costs, stretched capacity in the building sector, and difficulties accessing credit are all providing some brake on how quickly building activity can ramp up to meet demand. As a result, we expect a modest 1.6% rise in construction through the December quarter. The key area of risk is non - residential construction, which could surprise to the upside following its recent softness.
NZ Feb retail card spending
Mar 9, Last: +1.4%, WBC f/c: +0.6%, Market f/c: 0.3%
- Retail spending posted a solid rise of 1.4% in January, underpinned by a lift in durable spending. Stats NZ have attributed this to spending associated with increased purchases of 'back to school' supplies, which increasingly include electronic devices. However, we have also seen a second - wind in the housing market that is likely to have boosted spending on durable items. Spending on hospitality was also up.
- With mortgage rates edging down, renewed strength in the housing market, and migration remaining firm, we expect to see spending increase by 0.6% in February. Spending is expected to be up in most categories (though we are likely to see a pullback in durables spending following last month's strong gain).
US Feb employment report
Mar 9, nonfarm payrolls, last 200k, WBC 230k
Mar 9, unemployment rate, last 4.1%, WBC 4.0%
- Employment growth in the US began 2018 on a robust footing, with a further 200k jobs created. February is also likely to record a strong result, circa 230k, given both of the ISMs are pointing to strong momentum.
- Because job gains are continuing at pace as participation holds steady, the unemployment rate will edge lower to 4.0% in February. A move below 4.0% is near certain by mid year.
- Given the growing importance of wages and inflation for policy, increasingly the hourly wage series is becoming the primary focus for this release. In the short term, there is doubt over whether January's 2.9%yr outcome will be sustained in February. However, it is almost inevitable that 3.0%yr outcomes will become regular in 2018. Outcomes materially above this level however are still unlikely.
Weekly Focus: ECB Set to Remove Easing Bias
Market movers ahead
In the US , the most important release is the jobs report for February, with most focus on average hourly earnings (AHE), where another strong monthly print would be likely to add to the reflation story.
In the euro area, we await 'Super EU politics Sunday', with the Italian Parliamentary election being held and the results of the German SPD's member vote on the coalition with CDU/CSU due to be released on Sunday.
The other big event is the March ECB meeting, which is scheduled for Thursday, when we expect the ECB to change its forward guidance, removing its easing bias.
In the UK , focus remains on Brexit, as we approach the important EU summit on 22-23 March, where the ambition is to reach an agreement on transition.
In Japan , the main event next week is the Bank of Japan's monetary policy meeting ending on Friday, where we expect it to keep its 'QQE with yield curve control' policy unchanged.
Global macro and market themes
Inflation has been a key market driver this year and the balance of risks to our inflation forecasts is on the upside given the US fiscal stimulus and closing global output gaps.
Jerome Powell said the outlook for the US economy has strengthened - we still expect three Fed hikes this year but see the possibility of the Fed raising its 'dots' to three hikes for 2019 at its next meeting.
The ECB is set to remove some of its QE bias next week.
We remain positive on equities but see the US inflation outperformance as negative for the USD.