
Sample Category Title
USD/CHF Downtrend Resumes
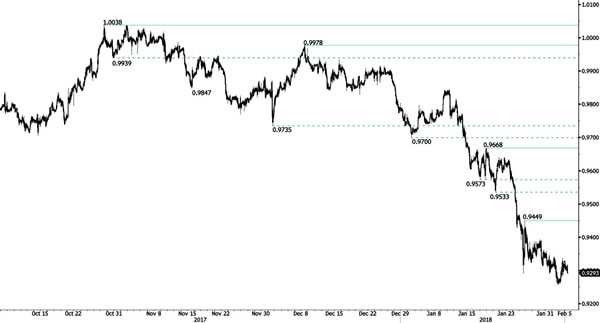
USD/CHF is trading lower following a recent rise up to 0.9336 (02/02/2018 high). The technical structure indicates that further weakness is likely. Hourly resistance is at 0.9449 (25/01/2018 high). Expected to show further short-term downside move.
In the long-term, the pair is still trading in range since 2011 despite some turmoil when the SNB unpegged the CHF. Key support remains at 0.9072 (07/05/2015 low) while resistance at 1.0344 (15/12/2016 high) is distanced. The technical structure favours a long term bullish bias since the unpeg in January 2015.
USD/JPY Pushing Towards 109.80
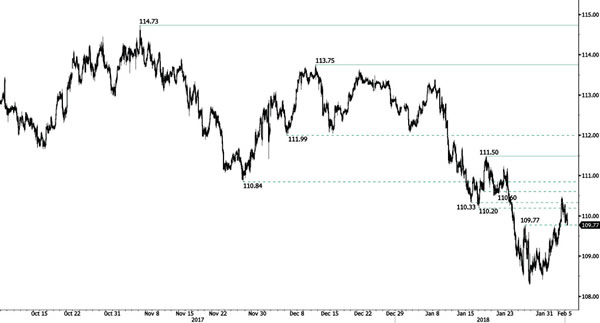
USD/JPY is rising following weakness and trades above 109.50. Hourly support remains at 111.50 (18/01/2018 high). The technical structure suggests further short-term upside move.
We favor a long-term bearish bias. Support is now given at 107.32 (08/09/2017 low). A gradual rise towards the major resistance at 125.86 (05/06/2015 high) seems unlikely. Expected to decline further support at 101.20 (09/11/2016 low).
GBP/USD Upward Oriented
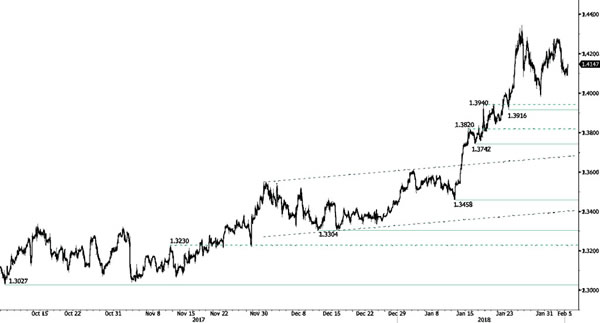
GBP/USD is trading lower but appears to head back towards 1.42. The technical structure indicates weakness. Hourly support is given at 1.3916 (23/01/2018 low).
The long-term technical pattern is reversing. The Brexit vote had paved the way for further decline but the pair is now moving up to 2016 highs. A long-term support given at 1.1841 (07/10/2017 low) and a strong resistance at 1.5018 (24/06/2016 high) are identified.
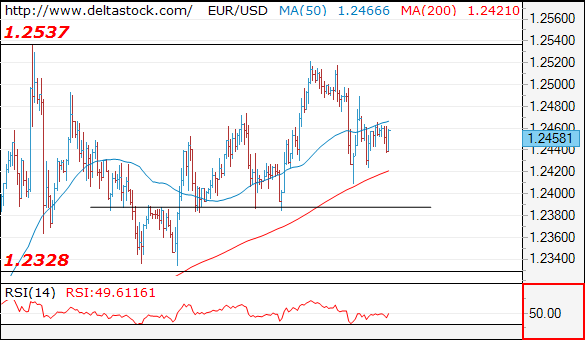
EUR/USD Bouncing
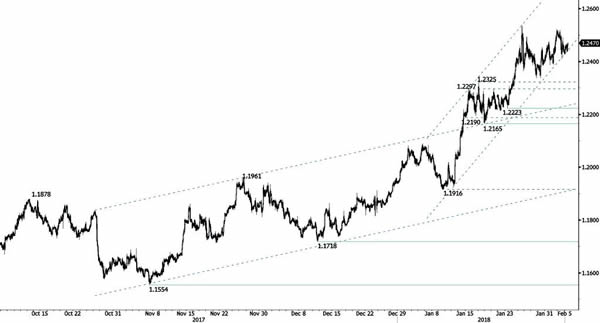
EUR/USD is recovering from its recent decrease. The pair is now retracing and lies well above 1.2325 (17/01/2018 high). Hourly support is given at 1.2223 (23/01/2018 low). The technical structure suggests further short-term upside moves.
In the longer term, the momentum is turning largely positive. We favor a continued bullish bias. Key resistance is holding at 1.2856 (15/10/2014 high) while strong support lies at 1.1554 (08/11/2017 low).
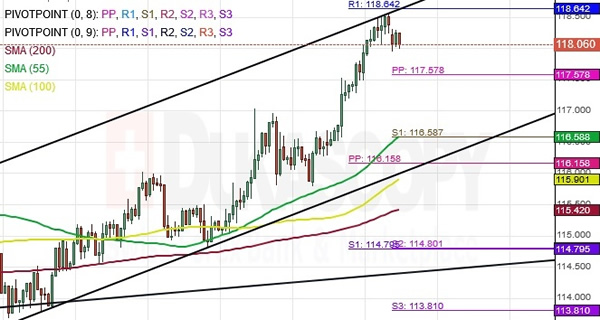
CHF/JPY 4H Chart: Meet Monthly Resistance
The Swiss Franc has been trading in an ascending channel against the Japanese Yen since early January.
During the past week, the pair has formed a new high at 118.50. However, the rally was stopped by the monthly resistance at the 118.64 mark to retrace for a brief period of time.
The pair is likely to continue trading north, Technical indicators are in favor for the Swiss Franc to continue its rally against the Yen during the following trading sessions
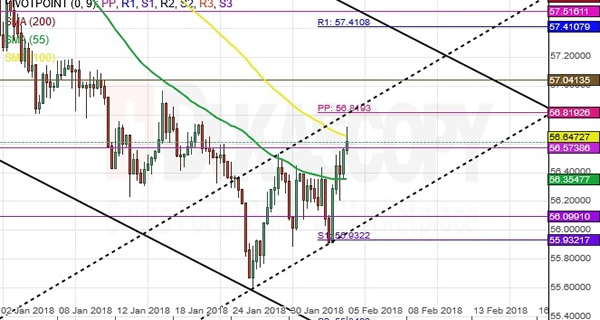
USD/RUB 4H Chart: Formed New Medium-Term Channel
The US Dollar has started to gain strength against the Russian Ruble after reaching an historical low level at 55.58.
The pair has formed a new medium-term channel, and the price is gradually moving north to test the upper boundary in combination with the monthly pivot point at the 56.64 mark.
In regards to the near future, analysts expect that the pair is likely to continue its rally until it breach the upper boundary of the medium-term channel. If and when its occurs, the pair might find resistance at the monthly R1 at 57.41.
Technical Outlook: SPOT GOLD – Limited Recovery Seen Ahead Of Fresh Weakness
Spot Gold is consolidating on Monday after Friday's sharp fall on upbeat US jobs data which boosted hopes for Fed's more aggressive approach to US monetary policy this year.
The yellow metal fell by 1.3% on Friday in the biggest one-day fall in nearly two months, generating bearish signal on completion of H&S pattern on daily chart as well as strong bearish weekly close.
Improved sentiment for the US dollar keeps gold price at the back foot, with limited recovery action seen ahead of fresh weakness.
Broken H&S neckline ($1340) and broken 10SMA ($1343) mark solid resistances which are expected to limit upside attempts and keep near-term bearish bias intact.
Bears could extend to $1316 (Fibo 38.2% of $1236/$1366, 12 Dec / 25 Jan rally) on break below Friday's low at $1327.
Conversely, immediate bears could be delayed if recovery rally clearly breaks above 10SMA, while lift above lower top at $1351 (01 Feb) is needed to neutralize bears and signal that corrective pullback from $1366 to $1327 might be over.
Res: 1340, 1343, 1351, 1357
Sup: 1327, 1324, 1320, 1316
Technical Outlook: AUDUSD Bounces, Boosted By Upbeat Chinese Data, But Limited Recovery Seen For Now
The Australian dollar bounces on Monday after pullback from 0.8135 peak which accelerated on Friday, found footstep at 0.7892 (Fibo 38.2% of 0.7500/0.8135, 11 Dec/26 Jan rally). Near-term sentiment was boosted by upbeat Chinese Caixin services PMI which was released overnight and hit the highest since May 2012. However, limited corrective action is expected as Friday's daily long red candle weighs along with strong bearish signal that developed on weekly chart after strong bearish weekly close which came after seven consecutive bullish weeks. Broken daily Kijun-sen marks initial barrier at 0.7960, followed by broken 20SMA/Fibo 38.2% of 0.8135/0.7892 pullback at 0.7984, with extended upticks expected to hold below psychological 0.80 barrier, before fresh push lower. Break below 0.7892 pivot could trigger fresh bearish extension towards 0.78 zone (09/10Jan trough). Conversely, stronger recovery through 0.80 barrier needs to regain broken 10SMA (0.8032) to neutralize bearish threats.
Res: 0.7960; 0.7984; 0.8000; 0.8032
Sup: 0.7892; 0.7847; 0.7817; 0.7800
Forex Technical Analysis: EUR/USD, USD/JPY, GBP/USD
EUR/USD
Current level - 1.2458
The bias is bearish below 1.2480 minor resistance, for a break through 1.2390 support, towards 1.2330 area.
| Resistance | Support | ||
| intraday | intraweek | intraday | intraweek |
| 1.2480 | 1.2540 | 1.2390 | 1.2330 |
| 1.2540 | 1.2870 | 1.2330 | 1.2220 |
USD/JPY
Current level - 109.82
My outlook is positive above 109.70, for another rise towards 111.90 zone. Crucial on the downside is 109.20 low.
| Resistance | Support | ||
| intraday | intraweek | intraday | intraweek |
| 110.50 | 111.90 | 109.70 | 108.30 |
| 111.90 | 113.40 | 109.20 | 107.30 |

GBP/USD
Current level - 1.4118
A reversal has been confirmed at 1.4275 and my outlook remains bearish, for a break through 1.4090, towards 1.3910 area. Minor intraday resistance is projected at 1.4200.
| Resistance | Support | ||
| intraday | intraweek | intraday | intraweek |
| 1.42800 | 1.4340 | 1.4090 | 1.3910 |
| 1.4275 | 1.4730 | 1.3980 | 1.3730 |

Sell-Off Continues: You Can Hide But Can You Survive? | Tesco And Ryanair Under Focus
The biggest sell-off for the equity markets in nearly two years is here
A 10% correction could take place as this was long overdue
Dallas Fed President Robert Kaplan and New York Fed President William Dudley to speak
Prayers have been answered by the equities bears. The biggest sell-off for the equity markets in nearly two years is here as investors are reacting to surging global bond yields. Something which stood out last week for traders was that the sell-off was across all the 11 sectors in the S&P 500, something which we have not witnessed since 2016 (during the US election). Friday's equity markets rout is likely to extend as the futures of the US stock indices are indicating.
However, there isn't much to worry about because corporate profits are still rising and chances of US recession are remote. So this may only be a healthy pullback which the investors have been waiting for some time. A 10% correction could take place as this was long overdue. In other words, the long-term momentum for the equity markets is only easing off as these markets have been defying the Newton Law of Gravity.
Over in the US, after a strong US NFP data, in particular, the US wage growth number, has asserted more pressure on the Fed to adopt a policy which can address the rising bond yields. Dallas Fed President Robert Kaplan and New York Fed President William Dudley are going to provide more details about the Fed's monetary policy stance and the question among the investors would be if the pace of the interest rate hike would be gradual or if the Fed is going to adopt a more aggressive stance.
Investors are trying to make a sense of Janet Yellen's last interview with CBS during which she mentioned that valuations and real estate prices are overstretched. Does she mean that the stock market is a bubble? Perhaps, the upcoming Fed chairman Jerome Powell will have to address this question. Bond traders need to know if he is going to favour three or four interest rate hike this year.
TESCO
Traders are paying attention to Tesco's 2018 profit forecast of £1.58 for the year and the company's intentions are that it would reinstate dividend of 2 pence per share. The corporate is shaking its management once again, the CEO of the merging group, Booker, will be taking over the company's driving wheel. Charles Wilson, the current boss of Booker, is going to head the UK and Ireland operation for Tesco.
Insiders have a 0.01 percent stake. During the past six months, insiders have increased their holdings by 1.9 percent. The overall street consensus rating is equivalent to sell. During the month of January, Tesco's stock fell 3.6% while the peers dropped nearly by 2.9%.
RYANAIR
Another big surprise from Irish carrier, Ryanair announced a 750 million euro share buyback. The message is clear for investors, the company has strong books. It is going to stand at its position by assuring investors that it is determined to remain Europe's biggest low-cost airline. This is despite the fact that the staff cost would rise by 45 million euros this year as it has compensated its flight crews with higher wages. However, the potential threat remains for the airline as the pilot dispute is still not resolved. Nonetheless, the key ingredient which has helped the airline to fight higher fuel prices and higher wages is mainly due to the extra-dense Boeing 737.