Sample Category Title
EUR/CHF Ready To Monitor Once More Resistance At 1.1623
EUR/CHF recovery bounce continues testing 1.1623 (15/09/2017 high). Support is given at 1.1388 (02/09/2017 low). Rising channel suggest further bullish momentum.
In the longer term, the technical structure has reversed. Strong resistance is given at 1.20 (level before the unpeg). Yet, the ECB's QE programme is likely to cause persistent selling pressures on the euro, which should weigh on EUR/CHF. Supports can be found at 1.0184 (28/01/2015 low) and 1.0082 (27/01/2015 low).
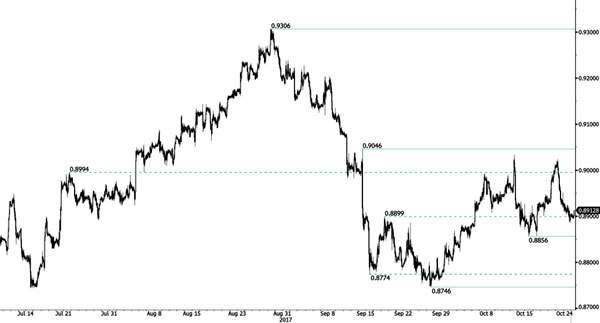
EUR/GBP Consolidating Above 0.89
EUR/GBP continues to bounce higher yet not important resistances have been broken (quick test). The pair is back below former resistance at 0.8899 (19/09/2017 low). Hourly support is given at a distance at 0.8746 (27/09/2017 low).
In the long-term, the pair has largely recovered from recent lows in 2015. The technical structure suggests a growing upside momentum. The pair is trading above from its 200 DMA. Strong resistance can be found at 0.9500 (psychological level).
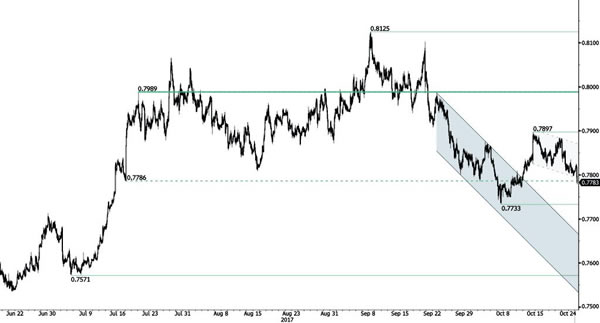
AUD/USD Bearish Breakout
AUD/USD broke out short-term downtrend momentum. Hourly resistance is given at 0.7897 (13/10/2017 high). Key support lies at at 0.7733 (06/10/2017 low). Expected to show continued decline.
In the long-term, the trend is turning positive. Key supports stands at 0.6009 (31/10/2008 low) . A break of the key resistance at 0.8164 (14/05/2015 high) is needed to invalidate our long-term bearish view.
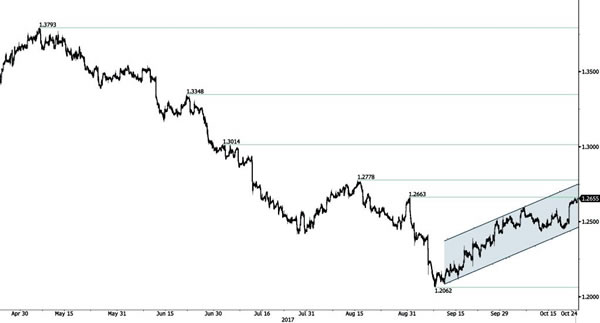
USD/CAD Challenging Resistance At 1.2663
USD/CAD bullish drive suggests a challenge to 1.2663 horizontal resistance. Hourly support lies at 1.2331 (26/09/2017 high). Expected to show continued short-term bullish pressures within uptrend channel.
In the longer term, the pair has broken longterm support that can be found at 1.2461 (16/03/2015 low). Strong resistance is given at 1.4690 (22/01/2016 high). The pair is likely to head further lower.
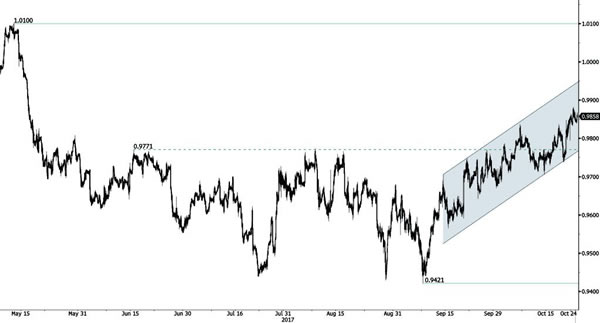
USD/CHF Riding Bullish Momentum
USD/CHF is pushing higher. The technical structure suggests an improving short-term buying interest. Expected to show continued bullish pressures within uptrend channel. Hourly support stands at 0.9712 (12/10/2017 low).
In the long-term, the pair is still trading in range since 2011 despite some turmoil when the SNB unpegged the CHF. Key support can be found 0.8986 (30/01/2015 low). The technical structure favours nonetheless a long term bullish bias since the unpeg in January 2015.
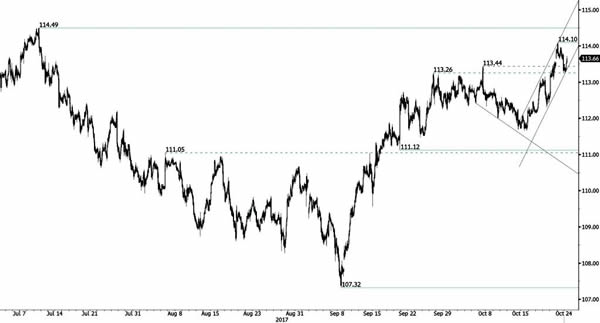
USD/JPY Bearish Consolidation Within Short-Term Uptrend
USD/JPY has bounced back after setting a new hourly resistance at 114.10 (23/10/2017 high). Next key resistance can be found at 114.49 (11/07/2017 high). Support is located at 111.12 (20/09/2017 low).
We favor a long-term bearish bias. Support is now given at 99.02 (10/08/2013 low). A gradual rise towards the major resistance at 125.86 (05/06/2015 high) seems unlikely. Expected to decline further support at 93.79 (13/06/2013 low).
GBP/USD Sideways Price Action
GBP/USD has successfully tested support at 1.3155 bouncing strongly to resistance at (1.3229 reaction high). Hourly resistance stands at 1.3338 (13/10/2017 high). Key support can be found at (1.3088 12/10/2017 low).
The long-term technical pattern is reversing. The Brexit vote had paved the way for further decline. Long-term support can be found at 1.1841 (07/10/2017 low). Long-term resistance given around 1.35 is at stake and indicates a long-term reversal in the negative trend. Yet, it is very unlikely at the moment.
EUR/USD Ready For Further Short-Term Weakness
EUR/USD is trading above hourly support at 1.1725 (23/10/20107 low). Break will trigger bearish extension to strong support given at a distance at 1.1662 (17/08/2017 low). Key resistance is located at 1.1878 (12/10/2017 high). Expected to show further short-term weakness.
In the longer term, the momentum is now turning largely positive. We favour a continued bullish bias. Key resistance is holding at 1.2252 (25/12/2014 high) while strong support lies at 1.0341 (03/01/2017 low).
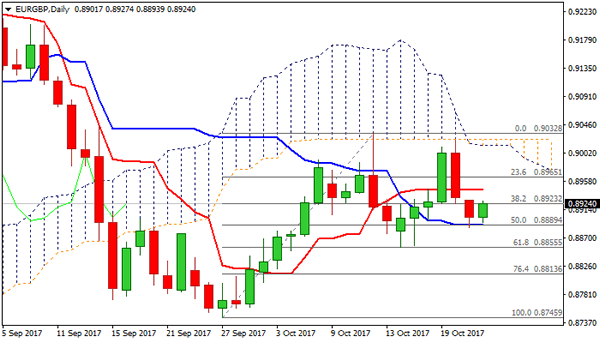
Technical Outlook: EURGBP – Falling Thick Hourly Cloud Is Expected To Limit Recovery
The cross is consolidating on Tuesday after strong fall on Fri/Mon found footstep at 0.8889 (daily Kijun-sen).
Recovery attempts are weighed thick falling hourly cloud (spanned between 0.8937 and 0.8962) which is expected to limit upticks and keep near-term bearish bias in play for fresh attempt towards key support at 0.8855 (16/17 Oct trough).
Daily cloud is widening after twist and weighs along with double-top pattern, which requires confirmation on sustained break below 0.8855 pivot.
Alternative scenario sees lift above hourly cloud as bullish signal which would neutralize downside threats.
Res: 0.8937, 0.8962, 0.9003, 0.9022
Sup: 0.8900, 0.8886, 0.8855, 0.8813
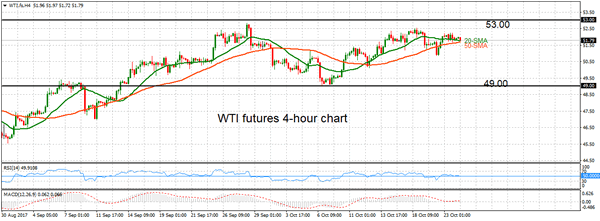
WTI Oil Futures Lack Clear Trend During Past Month, Short-Term Consolidation Phase At Upper End Of Range
WTI oil futures have been moving sideways in the past two weeks and are trading in the upper half of a broader range that has been forming during the past month following the rise above 49.00 on September 13.
On the 4-hour chart, there was a recent bounce ahead of the 49.00 level which is now considered to be strong support. Prices moved towards the upper end of the one-month range where they are now consolidating. As long as the 20-period moving average provides support, there is room for more upside for a re-test of the 52.83 peak. A rise above this range-high would help trigger a rally towards the 55 area.
Alternatively, a drop below the mid-point of the September – October range near the 51.00 area would shift the focus to the downside. Some soft support levels exist at 50.85, 50.13 before reaching the 49.07 low at the bottom of the range.
Trend and momentum readings on the 4-hour chart are pointing to a neutral bias in the near term with the possibility of a move back to the downside since prices are near the top of the one-month range.