Sample Category Title
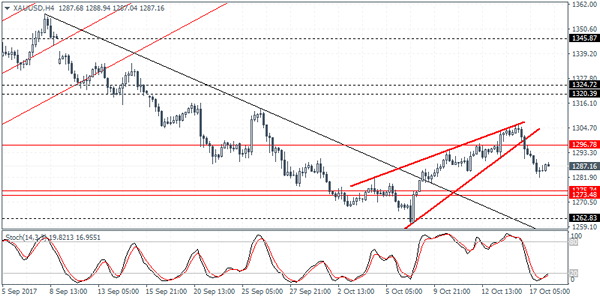
XAUUSD Intraday Analysis
XAUUSD (1287.16): Gold prices fell sharply yesterday with little to no retracement. However, the doji candlestick formed on the 4-hour chart and the subsequent bullish close could suggest some upside. Further declines, if any could send gold prices down to the lower support established at 175 - 1274 level. At the initial test of support, gold prices could see a short term bounce. To the upside, any gains are limited to the resistance level and potentially the breakout level from the rising wedge pattern.
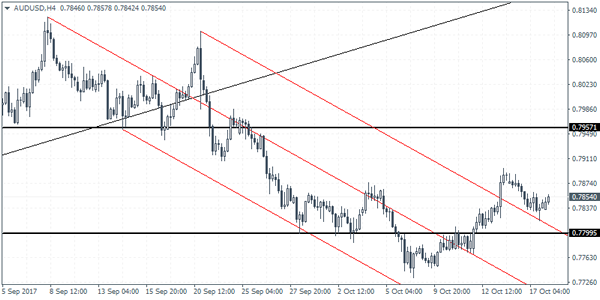
AUDUSD Intraday Analysis
AUDUSD (0.7854): The Australian dollar has been attempting to recover some of the losses from a previous couple of weeks. Price action is seen initially slipping earlier this week before currently attempting to push to the upside. The breakout from the falling median line suggests a near term rally towards the price level of 0.7957. This price level previously served as support and is now likely to be tested for resistance. However, ahead of the gains, AUDUSD could be seen sliding towards the lower support at 0.7799. Establishing support here will validate the upside move towards 0.7957.
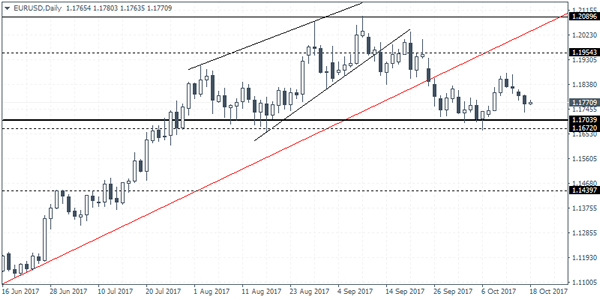
EURUSD Intraday Analysis
EURUSD (1.1770): The EURUSD extended the declines yesterday on a strong US dollar. However, the declines now see price retesting the breakout level of the descending wedge pattern. This could suggest some near term gains on the horizon. The Stochastics is also oversold and could signal a near term bounce. Any gains in price will be limited to the resistance level which has been established at 1.1822. Support is seen at 1.1720. The EURUSD is expected to maintain trading within the range into next week's ECB meeting. However if support at 1.1720 breaks, then EURUSD could post further declines towards 1.1704 - 1.1672 where the major neckline support exists.
AUD/USD Candlesticks and Ichimoku Analysis
Weekly
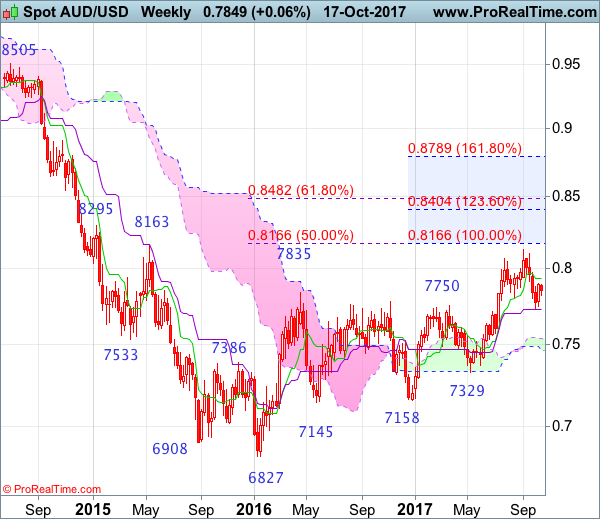
• Last Candlesticks pattern: Long white candlestick
• Time of formation: 10 Jul 2017
• Trend bias: Up
Daily
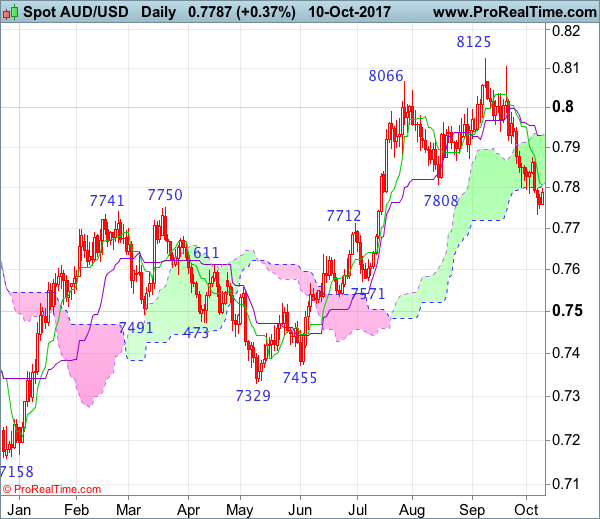
• Last Candlesticks pattern: Long white candlestick
• Time of formation: 18 Jul 2017
• Trend bias: Up
Although aussie rebounded to as high as 0.7897 late last week, as the pair met renewed selling interest there and has retreated again, retaining our bearishness and weakness to 0.7770-75 is likely, however, break there i needed to signal the rebound from 0.7733 and bring retest of this level later, break there would signal the fall from 0.8125 top is still in progress for retracement of early upmove to previous resistance at 0.7712, break there would extend weakness to 0.7660-70 and then 0.7620-30 but support at 0.7535-40 should remain intact due to oversold condition.
On the upside, expect recovery to be limited to 0.7870-75 and price should falter below said resistance at 0.7897, bring another decline later. Above said resistance at 0.7897 would risk test of the Kijun-Sen (now at 0.7918) but a daily close above there is needed to signal the fall from 0.8125 has ended instead, bring a stronger rebound to 0.7970-75, however, still reckon upside would be limited to 0.8000 and price should falter below resistance at 0.8103, bring another decline later.
Recommendation: Hold short entered at 0.7880 for 0.7680 with stop above 0.7900
On the weekly chart, although last week’s rebound formed a white candlestick, if our view that top has been formed at 0.8125 is correct, upside should be limited to last week’s high at 0.7897, bring another retreat later, below 0.7770 would bring test of 0.7727-33 (50% Fibonacci retracement of 0.7329-0.8125 and this month’s low), break there would add credence to this view and extend weakness to 0.7675-80 and possibly 0.7630-35 (61.8% Fibonacci retracement) but reckon support at 0.7535 would hold from here.
On the upside, price should falter below said resistance at 0.7897 and bring another retreat. Above said resistance would risk a stronger rebound to the Tenkan-Sen (now at 0.7929) but only a weekly close above there would defer and bring further gain to 0.8020-30, however, price should falter below resistance at 0.8103 and bring another decline later. A break of 0.8103 resistance would signal the retreat from 0.8125 top has ended instead, bring retest of this level. Looking ahead, only above there would extend the erratic rise from 0.6827 low to previous resistance at 0.8163, then 0.8200 but loss of upward momentum should limit upside to previous resistance at 0.8295.
Robust Industrial Production Renews Support For The USD
The US dollar was seen trading stronger on Tuesday as data showed that industrial production rose 0.3% on the month. This came after the previous month's data was revised to show a 0.7% decline. Import prices also increased, rising 0.7% on the month marking the largest increase since June 2016. Besides the economic data, the markets were also seen reacting to potential rumors that President Trump might nominate John Taylor, an economist from Stanford as the next chair of the Federal Reserve.
In the UK, inflation data showed a 3.0% increase for the month of September. The data sent the British pound pushing lower on the day. In the Eurozone, inflation data confirmed that the headline CPI rose 1.5% and core CPI was up 1.1% in September.
Looking ahead, the ECB President Draghi is expected to speak earlier in the day today. The UK's monthly jobs report data will be coming out which will bring some additional risk to the GBP. In the US trading session, the monthly building permits and housing starts will be released.
Sterling Lower Ahead Of UK Jobs
Investors itching for another opportunity to offload Sterling, were given thethumbsup on Tuesday, after BoE officials sounded more cautious than anticipated during their testimony to Parliament.
Although BoE Governor Mark Carney said the MPC believed a rate hike may be needed in the “coming months”, his refusal to offer any clear signs on whether the central bank will take action in November, simply punished Sterling. Dovish signals radiating from the newest members of the bank's Monetary Policy Committee also played a role in the Pound's selloff, as investors started to question the prospect of an interest rate hike in November.
With Bank of England's new deputy governor Dave Ramsden believing that a hike is not needed “in the coming months” and Silvana Tenreyro suggesting that any move is “very contingent on data”, November's MPC meeting could be dominated by doves. While markets still widely expect that the central bank will proceed with raising rates by +25 basis points in November to quell inflation, the move may be considered as a dovish hike. With Britain's macroeconomic landscape still fragile amid Brexit, investors may not consider the hike as the beginning of a tightening cycle but simply, a “once-off”.
While Carney maintained a safe distance from monetary policy discussion during the testimony to Parliament, he used the opportunity to express concerns over Brexit. With the Bank of England Governor warning that a “no deal” Brexit would have a negative impact on the economy, the British pound is likely to become even more sensitive to the Brexit negotiations.
The main risk event for Sterling this morning will be the UK employment report, which will be closely watched for any signs of Brexit having a negative impact on wage growth. While Britain's unemployment rate is currently at a 42-year low, subdued wage growth continues to weigh on sentiment and is a headache for BoE policymakers. If average earnings fail to pick up, consumers are likely to feel the pinch further, especially after inflation hit a five and a half year high at 3% in September.
Taking a look at the technical picture, the GBPUSD is under pressure on the daily charts. Prices failed to break above the 1.3300 resistance, resulting in a decline back towards 1.3150. Technical lagging indicators such as the MACD have crossed to the downside while prices are approaching the 50 SMA. A breakdown below 1.3150 may encourage a further decline lower towards 1.3050.
Trade Idea : USD/CHF – Buy at 0.9770
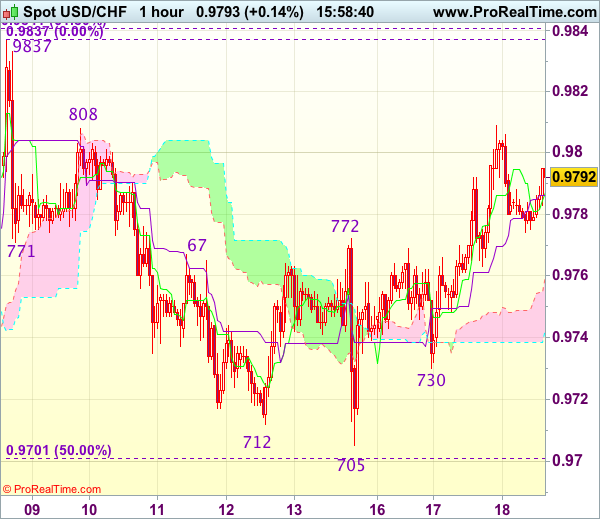
USD/CHF - 0.9791
Most recent candlesticks pattern : N/A
Trend : Sideways
Tenkan-Sen level : 0.9787
Kijun-Sen level : 0.9786
Ichimoku cloud top : 0.9766
Ichimoku cloud bottom : 0.9749
Original strategy :
Buy at 0.9770, Target: 0.9870, Stop: 0.9735
Position : -
Target : -
Stop : -
New strategy :
Buy at 0.9770, Target: 0.9870, Stop: 0.9735
Position : -
Target : -
Stop : -
Dollar’s rally after finding renewed buying interest at 0.9730 signals low has been formed at 0.9705 late last week and mild upside bias remains for test of 0.9808-10, however, break there is needed to add credence to our view that the fall from 0.9837 has ended at 0.9705, bring retest of this level later, break there would confirm recent rise from 0.9421 low has resumed and extend headway to 0.9870 and possibly 0.9900.
In view of this, would not chase this rise here and would be prudent to buy dollar on pullback as 0.9760-70 should limit downside. Only a break below support at 0.9730 would abort and signal the rebound from 0.9705 has ended, bring retest of this level. Once this support is penetrated, this would revive bearishness and extend the fall from 0.9837 to 0.9669-70 (61.8% Fibonacci retracement of 0.9565-0.9837 and previous support) but previous support at 0.9642 should remain intact.
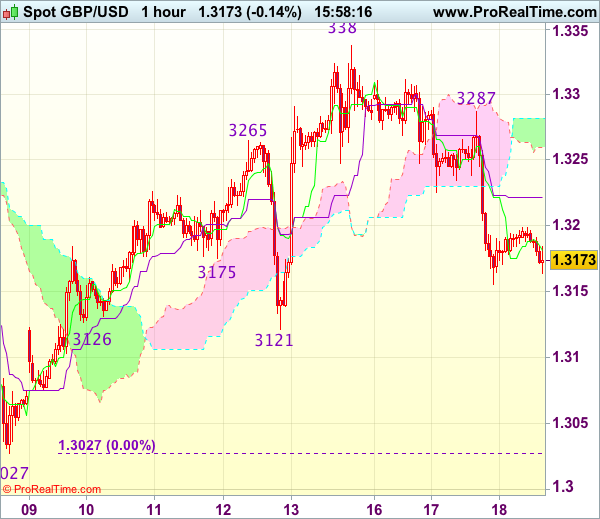
Trade Idea : GBP/USD – Sell at 1.3225
GBP/USD - 1.3187
Most recent candlesticks pattern : N/A
Trend : Near term up
Tenkan-Sen level : 1.3181
Kijun-Sen level : 1.3221
Ichimoku cloud top : 1.3282
Ichimoku cloud bottom : 1.3259
Original strategy :
Sell at 1.3225, Target: 1.3125, Stop: 1.3260
Position : -
Target : -
Stop : -
New strategy :
Sell at 1.3225, Target: 1.3125, Stop: 1.3260
Position : -
Target : -
Stop : -
Yesterday’s selloff after meeting renewed selling interest at 1.3287 adds credence to our view that top has been formed at 1.3338 late last week and consolidation with downside bias remains for this move to extend further weakness to 1.3150, then towards support at 1.3121, however, break of latter level is needed to retain bearishness and bring further subsequent decline to 1.3090-00.
In view of this, wee are looking to sell cable on recovery as previous support at 1.3225 should turn into resistance and limit upside, bring another decline later. Above 1.3250-60 would risk another test of said resistance at 1.3287 but only break there would signal low is formed instead, bring rebound to 1.3300 and possibly test of resistance at 1.3312.
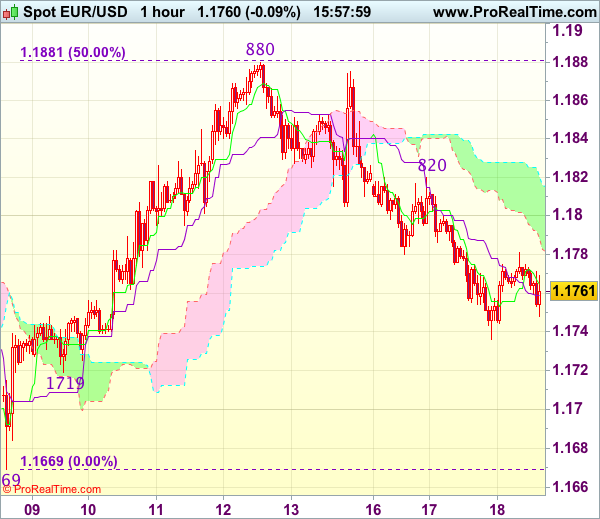
Trade Idea : EUR/USD – Sell at 1.1800
EUR/USD - 1.1762
Most recent candlesticks pattern : N/A
Trend : Near term up
Tenkan-Sen level : 1.1765
Kijun-Sen level : 1.1759
Ichimoku cloud top : 1.1816
Ichimoku cloud bottom : 1.1783
Original strategy :
Sell at 1.1800, Target: 1.1700, Stop: 1.1835
Position : -
Target : -
Stop : -
New strategy :
Sell at 1.1800, Target: 1.1700, Stop: 1.1835
Position : -
Target : -
Stop : -
As the single currency has remained under pressure after falling to 1.1736 yesterday, adding credence to our view that top has possibly been formed at 1.1880 last week and the fall from there may extend weakness towards support at 1.1719, however, break there is needed to retain bearishness and signal the rebound from 1.1669 has ended, then further decline to 1.1700 would follow.
In view of this, we are looking to sell euro on recovery as 1.1800 should limit upside. Above 1.1820 would suggest low is formed instead, bring a stronger rebound to 1.1845-50 but price should falter below said resistance at 1.1880, bring another retreat later.
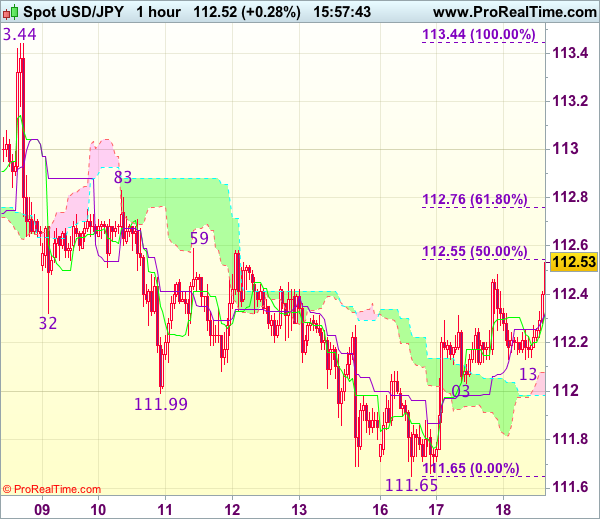
Trade Idea : USD/JPY – Buy at 112.30
USD/JPY - 112.51
Most recent candlesticks pattern : N/A
Trend : Near term down
Tenkan-Sen level : 112.34
Kijun-Sen level : 112.33
Ichimoku cloud top : 112.08
Ichimoku cloud bottom : 111.98
Original strategy :
Buy at 112.05, Target: 113.05, Stop: 111.70
Position : -
Target : -
Stop : -
New strategy :
Buy at 112.30, Target: 113.30, Stop: 111.95
Position : -
Target : -
Stop : -
As dollar has surged again after finding renewed buying interest at 112.13, adding credence to our view that low has been formed at 111.65 and consolidation with mild upside bias remains for gain to 112.55-59 (50% Fibonacci retracement of 113.44-111.65 and previous resistance), however, break there is needed to signal the fall from 113.44 has ended, bring further gain to 113.00 and 113.30 but said resistance at 113.44 should hold from here due to near term overbought condition.
In view of this, we are looking to buy dollar on pullback as said support at 112.13 should limit downside and bring another rebound later. Below said support at 112.03 would defer and risk weakness to 111.80 but still reckon support at 111.65 (this week’s low) would hold from here. Only break there would revive bearishness for the fall from 113.44 top to extend weakness to 111.47 support and later towards another previous support at 111.11.