
Sample Category Title
Trade Idea: GBP/USD – Stand aside
GBP/USD – 1.3202
New strategy :
Stand aside
Position: -
Target: -
Stop:-
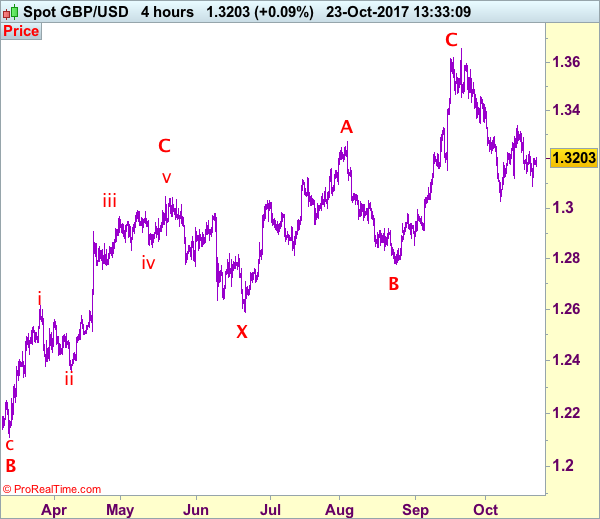
Despite last week’s anticipated fall to 1.3088, lack of follow through selling and the subsequent rebound suggest further consolidation would be seen and test of resistance at 1.3229 cannot be ruled out, however, break there is needed to suggest the fall from 1.3338 has ended at 1.3088, then a stronger rebound to 1.3287 resistance cannot be ruled out, having said that, price should falter well below resistance at 1.3338 and bring further choppy trading later.
On the downside, whilst pullback to 1.3160-70 cannot be ruled out, reckon 1.3115-20 would hold and bring further sideways trading. Only a break below said support at 1.3088 would revive bearishness for resumption of recent decline towards recent low at 1.3027. Our preferred count is that (pls see the attached chart) the wave IV is unfolding as a complex double three (ABC-X-ABC) correction with 2nd wave B ended at 1.2774, hence 2nd wave C could have ended at 1.3658.
Our preferred count on the daily chart is that cable's rebound from 1.3500 (wave (A) trough) is unfolding as a wave (B) with A ended at 1.7043, followed by triangle wave B and wave C as well as wave (B) has ended at 1.7192, the subsequent selloff is the larger degree wave (C) which is still unfolding with minor wave (III) of larger degree wave 3 ended at 1.1986, hence wave (IV) correction is in progress which could either be a triangle wave (IV) of a complex formation but upside should be limited to 1.3500 and price should falter well below 1.4000, bring another decline in wave (V) of 3 for weakness to 1.1500, then 1.1200.
Trade Idea: GBP/JPY – Buy at 149.50
GBP/JPY - 150.10
New strategy :
Buy at 149.50, Target: 151.50, Stop: 148.90
Position: -
Target: -
Stop:-
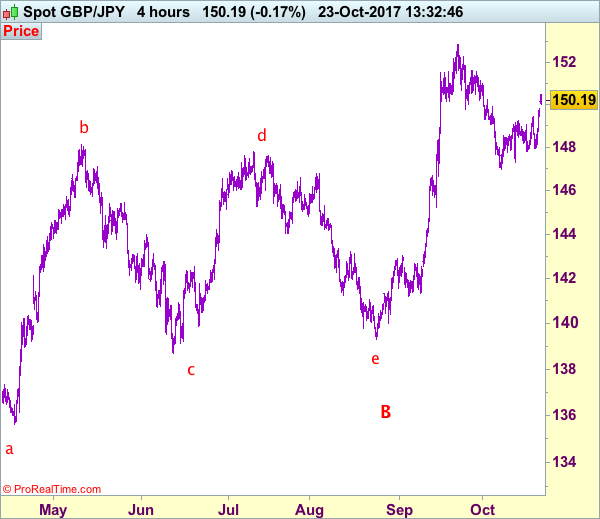
Sterling found decent demand at 147.95 late last week and has rallied above resistance at 149.40, adding credence to our view that the erratic rise from 146.95 is still in progress, hence bullishness remains for this move to bring retracement of the fall from 152.85 to 150.50-55 and possibly 151.00 but still reckon upside would be limited to towards resistance at 151.60 which is likely to hold from here, bring retreat later.
In view of this, we are looking to buy sterling on pullback as 149.45-50 should limit downside and bring another rise. Below 148.90-00 would defer and risk weakness to 148.55-60, break there would signal top is formed instead, then weakness to indicated support at 147.80 would follow. Once this level is penetrated, this would signal the rebound from 146.95 has ended, bring weakness to another previous support at 147.30, below would confirm the fall from 152.85 has resumed for retest of 146.95. Looking ahead, below there would extend the fall from 152.85 top for retracement of recent upmove to 146.60-65 and then 146.00 but previous support at 145.25 should remain intact.
Our preferred count is that larger degree wave V with circle is unfolding from 251.12 with wave (I) 219.34, (II): 241.38 and wave (III) is subdivided into 1: 192.60, 2: 215.89 (23 Jul 2008) and wave 3 ended at 118.87 earlier in 2009. The correction from there to 162.60 is wave 4 which itself is a double three and is labeled as first a-b-c ended at 151.53, followed by wave x at 139.03, 2nd a ended at 162.60, 2nd b at 146.75 and 2nd c leg of wave 4 ended at 163.00. Therefore, the decline from 163.00 to 116.85 is now treated as wave 5 which also marked the end of larger degree wave (III), hence wave (IV) major correction has commenced for retracement of the wave (III) from 241.38 and upside target at 183.95-00 (50% Fibonacci retracement of the wave (II) from 241.38) had been met, a drop below 160.00 would suggest wave (IV) has ended at 195.85, bring decline in wave (V) for initial weakness to 130 (already met) and 120.
Trade Idea: EUR/JPY – Buy at 133.20
EUR/JPY - 133.81
Original strategy:
Buy at 133.30, Target: 135.30, Stop: 132.70
Position: -
Target: -
Stop: -
New strategy :
Buy at 133.20, Target: 135.20, Stop: 132.60
Position: -
Target: -
Stop:-
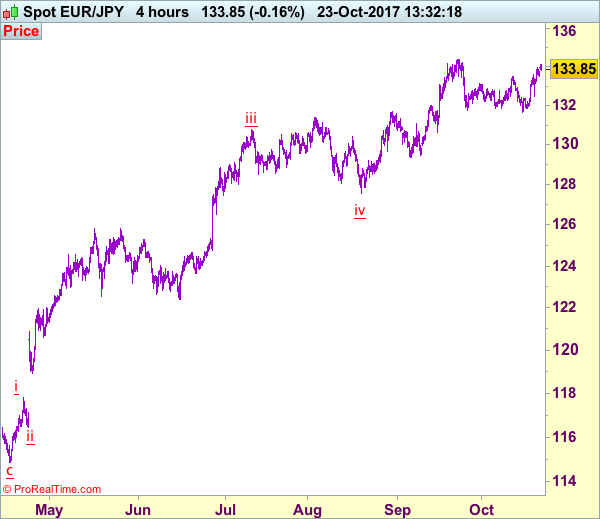
As the single currency opened higher and has maintained a firm undertone, suggesting the rise from 131.66 (last week’s low) is still in progress, hence bullishness remains for this move to bring a retest of recent high at 134.41, however, bream there is needed to confirm early upmove has resumed and extend headway to 135.00-10 and later towards 135.50-60 which is likely to hold from here due to overbought condition.
In view of this, would not chase this rise here and would be prudent to buy euro on pullback as 133.20-30 should limit downside. Only below said support at 132.47 would abort and prolong choppy trading, risk weakness to 132.00, having said that, strong support at 131.66 should remain intact, bring another rebound later.
Our latest preferred count is that wave (ii) is ABC-X-ABC which ended at 123.33 and wave (iii) is unfolding with wave iii ended at 100.77, followed by wave iv at 111.57 and wave v as well as the wave (iii) has ended at 97.04, followed by wave (iv) at 111.43 and wave (v) has ended at 94.12 which is also the end of the larger degree v, this also implied the major wave (C) has also ended there, hence major correction has commenced from there with (A) leg unfolding in its lower degree wave c which has possibly ended at 145.69. Under this count, A-B-C wave (B) has commenced with A leg ended at 136.23, wave B at 143.79 and wave C has possibly ended at 149.79.
Our larger degree count is that the decline from 139.26 is wave (C) and is sub-divided into a diagonal triangle i-ii-iii-iv-v with wave i - 105.44, wave ii- 123.33, wave iii - 97.03, wave iv - 111.43, followed by the final wave v as well as the end of wave (C) at 94.12, this also mark the bottom of larger degree wave B. Under this count, major rise in wave C has commenced as an impulsive wave with minor wave III ended at 145.69, wave V is still in progress for further gain to 150.00. Having said that, this so-called wave V could well be the first leg of larger degree 5-waver wave C and this wave C should bring at least a retest of wave A top at 169.97 (July 2008).
Aussie Dollar Trading Higher In The Morning Session
For the 24 hours to 23:00 GMT, the AUD declined 0.8% against the USD and closed at 0.7814 on Friday.
LME Copper prices rose 1.3% or $88.5/MT to $7008.5/MT. Aluminium prices rose 1.4% or $30.5/MT to $2159.0/MT.
In the Asian session, at GMT0300, the pair is trading at 0.782, with the AUD trading 0.08% higher against the USD from Friday’s close.
The pair is expected to find support at 0.7796, and a fall through could take it to the next support level of 0.7772. The pair is expected to find its first resistance at 0.7850, and a rise through could take it to the next resistance level of 0.7880.
The currency pair is trading below its 20 Hr and 50 Hr moving averages.

Trade Idea: AUD/USD – Hold short entered at 0.7875
AUD/USD – 0.7825
Original strategy:
Sold at 0.7875, Target: 0.7700, Stop: 0.7890
Position: - Short at 0.7875
Target: - 0.7700
Stop:- 0.7935
New strategy :
Hold short entered at 0.7875, Target: 0.7700, Stop: 0.7890
Position: - Short at 0.7875
Target: - 0.7700
Stop:- 0.7890
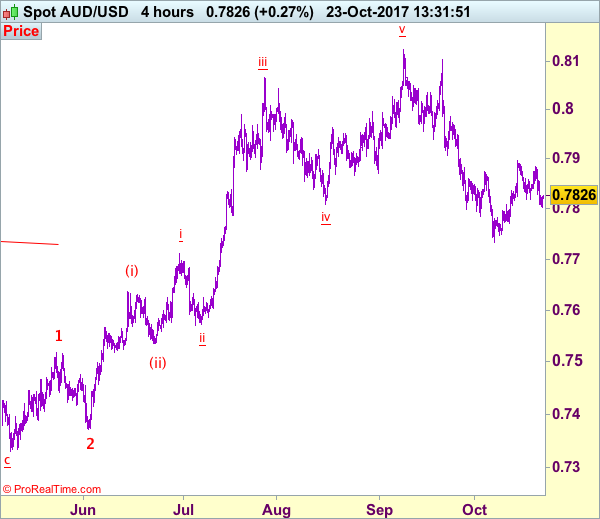
Aussie met resistance at 0.7884 and has retreated, retaining our bearishness and consolidation with downside bias remains for weakness to support at 0.7771, however, break there is needed to signal the rebound from 0.7733 has ended at 0.7897, bring a retest of said support at 0.7733, below there would confirm recent fall from 0.8125 top has resumed for weakness to 0.7700-10 and later towards 0.7660-65.
In view of this, we are holding on to our short position entered at 0.7875. Only above previous support at 0.7908 (now resistance) would defer and risk a stronger rebound to 0.7950 but resistance at 0.7986 should remain intact and bring another decline later.
On the 4-hour chart, recent upmove from 0.7329 is unfolding as an impulsive rise with wave 3 as well as smaller degree wave (iii) extending, only minor wave v of (iii) has ended at 0.8125, hence bullishness remains for this move to extend headway to 0.8200, then towards 0.8300, however, reckon upside would be limited to 0.8400 and the final wave 5 should falter below 0.8500, bring correction later.
Euro-Zone’s Current Account Surplus Rose To A 15-Month High In August
For the 24 hours to 23:00 GMT, the EUR declined 0.65% against the USD and closed at 1.1770 on Friday.
In economic news, the Euro-zone's seasonally adjusted current account surplus notched its highest level since May 2016 in August, after it widened to €33.3 billion, boosted by larger exports of goods. The region had registered a revised surplus of €31.5 billion in the prior month.
The greenback advanced against its major counterparts, on the back of renewed optimism over the US President, Donald Trump's tax reforms plans, after the US Senate approved a budget blueprint.
On the macro front, existing home sales in the US unexpectedly rebounded 0.7% on a monthly basis to a level of 5.39 million in September, defying market expectations for a fall to a level of 5.30 million and after registering a level of 5.35 million in the previous month.
Meanwhile, the Federal Reserve (Fed) Chairwoman, Janet Yellen, warned that there is an “uncomfortably high” risk that the central bank may have to deploy crisis-era unconventional policy tools again if the US economy remains stuck in a low interest-rate regime. Further, Yellen also noted that the Fed is making “good progress” in reducing its massive portfolio of bond holdings.
In the Asian session, at GMT0300, the pair is trading at 1.1768, with the EUR trading marginally lower against the USD from Friday's close.
The pair is expected to find support at 1.1737, and a fall through could take it to the next support level of 1.1707. The pair is expected to find its first resistance at 1.1812, and a rise through could take it to the next resistance level of 1.1857.
Moving ahead, investors would eye the Euro-zone's flash consumer confidence index for October, slated to release later today. Further, the US Chicago Fed national activity index for September, due to release later in the day, will be on investors' radar.
The currency pair is trading below its 20 Hr and 50 Hr moving averages.

EUR/USD Candlesticks and Ichimoku Analysis
Weekly
• Last Candlesticks pattern: Shooting star
• Time of formation: 31 Jul 2017
• Trend bias: Near term up
Daily
• Last Candlesticks pattern: Shooting star
• Time of formation: 2 Aug 2017
• Trend bias: Up
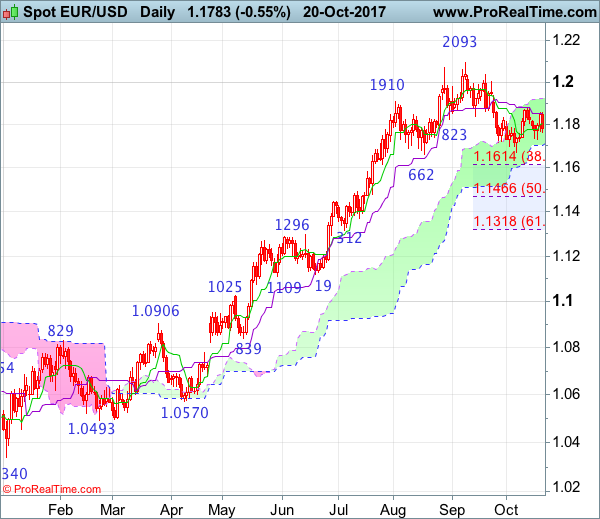
EUR/USD – 1.1770
Although the single currency retreated to as low as 1.1730 last week, as euro found support there and rebounded, retaining our bullishness for near term rise from 1.1669 low to resume after consolidation, above strong resistance at 1.1858 would add credence to this view and bring test of previous resistance at 1.1880. Once this level is penetrated, this would confirm and encourage for headway to the upper Kumo (now at 1.1922) but a daily close above there is needed to retain bullishness and extend gain to indicated resistance at 1.2005 but upside would be limited to resistance at 1.2035 and price should falter below key level at 1.2093.
On the downside, as long as support at 1.1730 holds, prospect of another rebound remains. A daily close below there would suggest the rebound from 1.1669 low has ended instead, risk another test of this level, break there would extend the erratic decline from 1.2093 top for retracement of early upmove to 1.1595-00, break there would bring subsequent fall to 1.1550, then towards 1.1500, having said that, previous support at 1.1479 should limit downside and 1.1466 (50% Fibonacci retracement of 1.0839-1.2093) should hold on first testing.
Recommendation: Hold long entered at 1.1775 for 1.1975 with stop below 1.1675.
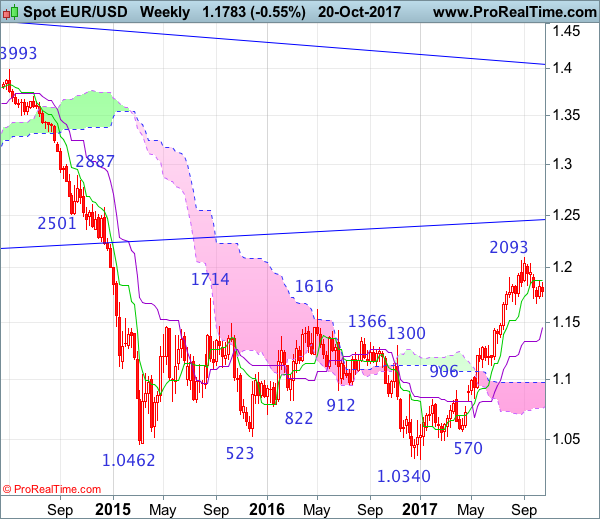
On the weekly chart, the single currency remains confined within recent range and further sideways trading is in store, however, reckon downside would be limited to 1.1730 and bring another rebound later, above last week’s high at 1.1858 would bring test of 1.1880 would suggest the pullback from 1.2093 top has possibly ended and extend gain to 1.1935-40, then towards 1.2035-40. Having said that, break there is needed to provide confirmation, bring retest of 1.2093. A break above there would extend recent rise from 1.0340 low to 1.2160-70 (50% Fibonacci retracement of 1.3993-1.0340) but loss of upward momentum should limit upside to 1.2220-30 and reckon 1.2300-10 would hold from here, price should falter well below 1.2390-00, bring another retreat later
On the downside, below support at 1.1730 would risk another test of this month’s low at 1.1669 but only break there would signal a temporary top has been formed at 1.2093, bring retracement of recent rise to 1.1610-15 (38.2% Fibonacci retracement of 1.0839-1.2093) and possibly towards 1.1550, having said that, downside should be limited to 1.1510-20 and 1.1460-70 (50% Fibonacci retracement) should remain intact, price should stay well above support at 1.1312, bring another rise.
UK’s Public Sector Net Borrowing Registered A Deficit In September
For the 24 hours to 23:00 GMT, the GBP rose 0.24% against the USD and closed at 1.3187 on Friday, amid hopes of constructive talks over Brexit, after the UK Prime Minister, Theresa May, called on EU leaders for a new dynamic that would allow Brexit talks to progress.
Macroeconomic data indicated that Britain's public sector net borrowing posted a less-than-anticipated deficit of £5.3 billion in September, following a revised deficit of £4.1 billion in the prior month, while markets were expecting public sector net borrowing to post a deficit of £5.7 billion.
In the Asian session, at GMT0300, the pair is trading at 1.3193, with the GBP trading marginally higher against the USD from Friday's close.
The pair is expected to find support at 1.3120, and a fall through could take it to the next support level of 1.3048. The pair is expected to find its first resistance at 1.3233, and a rise through could take it to the next resistance level of 1.3274.
With no major macroeconomic releases in the UK today, investor sentiment would be governed by global macroeconomic factors.
The currency pair is trading above its 20 Hr and 50 Hr moving averages.

USD/JPY Candlesticks and Ichimoku Analysis
Weekly
• Last Candlesticks pattern: Dark cloud cover
• Time of formation: 10 Jul 2017
• Trend bias: Down
Daily
• Last Candlesticks pattern: Evening doji
• Time of formation: 7 Aug 2017
• Trend bias: Down
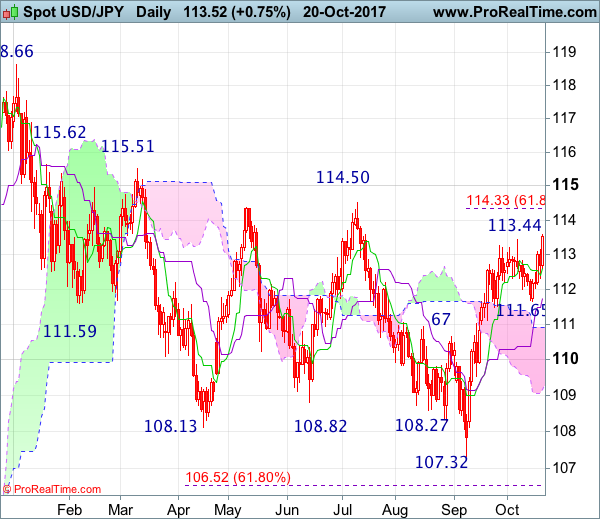
USD/JPY – 113.74
The greenback found renewed buying interest at 111.65 early last week and has staged a strong rebound from there, dampening our near term bearishness and upside risk remains for the rise from 107.32 low to extend further gain to towards 114.30-35 (61.8% Fibonacci retracement of 118.66-107.32), however, a daily close above resistance at 114.50 is needed to retain bullishness and suggest the fall from 118.66 has ended, then upside bias remains for headway to 115.00 and then towards 115.50-55.
On the downside, whilst pullback to 113.00 cannot be ruled out, reckon the Tenkan-Sen (now at 112.61) would limit downside and extend further gain later. Below 112.30 would bring weakness to 112.00 but only break of said support at 111.65 would revive bearishness and suggest top is possibly formed, bring retracement of recent rise to 111.10-15, having said that, reckon downside would be limited to the upper Kumo (now at 110.91) and 110.00 should hold, price should stay well above previous support at 109.55, bring rebound later.
Recommendation : Stand aside for this week.
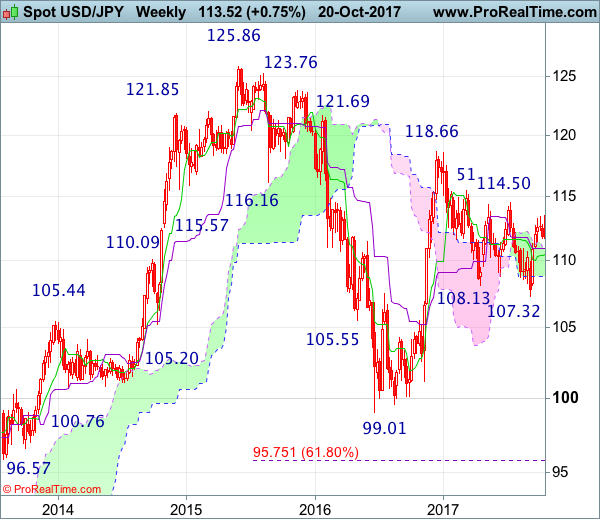
On the weekly chart, last week’s rebound after finding decent demand at 111.65 formed a white candlestick, suggesting the rise from 107.32 low is still in progress and mild upside bias is seen for this move to bring at least a retracement of the fall from 118.66 to 114.30-35 (61.8% Fibonacci retracement) but a sustained break above resistance at 114.50 is needed to signal the aforesaid decline has ended, bring further rise to psychological level at 115.00, then test of resistance at 115.51, break there would add credence to this view and encourage for headway to 116.50-60 first.
On the downside, expect pullback to be limited to 113.00 and 112.30 should hold, bring another rise later. Only below 111.65 would suggest a minor top is possibly formed, bring weakness to the Kijun-Sen (now at 110.91), however, only a weekly close below there would confirm the rebound from 107.32 has ended, bring further fall to 109.90-95 but still reckon support at 109.55 would contain downside and bring another rise later.
Japanese Prime Minister Retains Two-Third Majority In National Elections
For the 24 hours to 23:00 GMT, the USD rose 0.84% against the JPY and closed at 113.51 on Friday.
In the Asian session, at GMT0300, the pair is trading at 113.75, with the USD trading 0.21% higher against the JPY from Friday’s close, following the outcome of a snap election in Japan.
The Japanese Prime Minister, Shinzo Abe’s ruling coalition secured a resounding victory after winning 312 out of 465 seats at Sunday’s election.
The pair is expected to find support at 113.18, and a fall through could take it to the next support level of 112.61. The pair is expected to find its first resistance at 114.21, and a rise through could take it to the next resistance level of 114.67.
Moving ahead, traders would focus on Japan’s flash Nikkei manufacturing PMI for October, slated to release overnight.
The currency pair is trading above its 20 Hr and 50 Hr moving averages.
