Sample Category Title
EUR/AUD Weekly Outlook
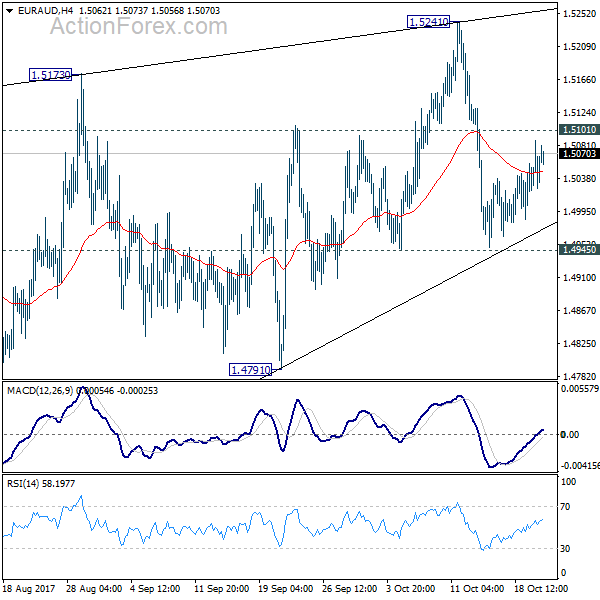
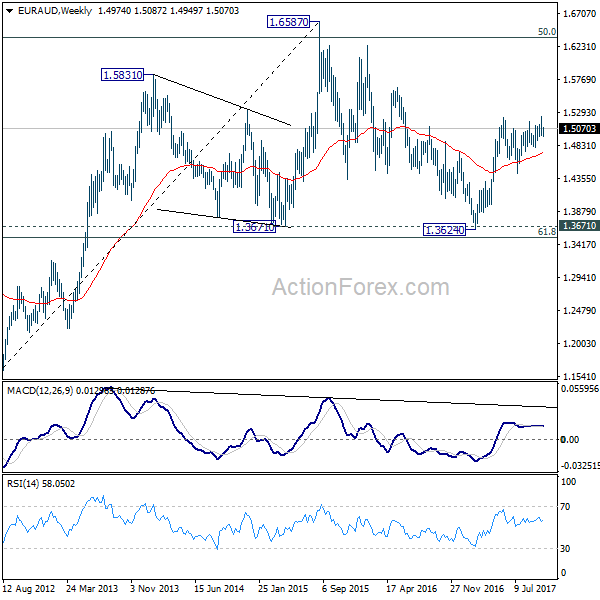
EUR/AUD was bounded in tight range between 1.4945/5101 last week and outlook is unchanged. Initial bias stays neutral this week first. Fall from 1.5241 is seen as the third leg of the consolidation pattern from 1.5226. Another decline is in favor as long as 1.5101 minor resistance holds. Break of 1.4945 will target 1.4791 support and possibly further to 1.4421. On the upside, though above 1.5101 will turn focus back to 1.5241 resistance instead.
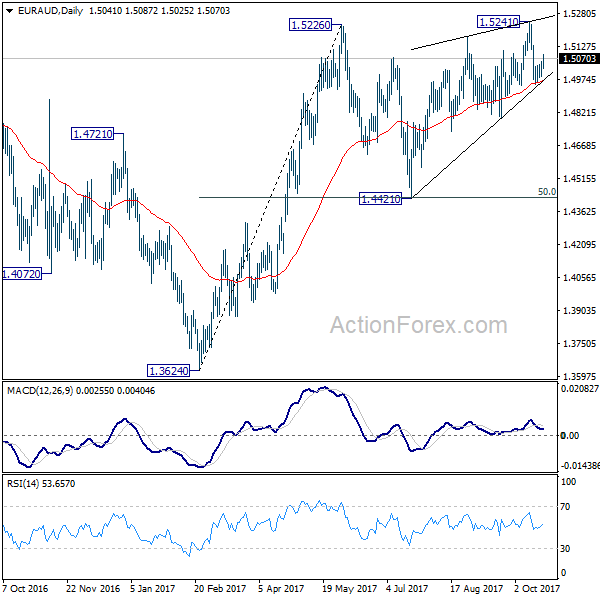
In the bigger picture, we're holding on to the view that corrective decline from 1.6587 medium term top has completed at 1.3624. Rise from 1.3624 is expected to extend to retest 1.6587. The corrective structure of the price actions from 1.5226 is affirming this view. Sustained trading above 1.5226 will target a test on 1.6587 key resistance. However, break of 1.4421 support will dampen our view and would drag EUR/AUD lower to retest key support zone around 1.3624.
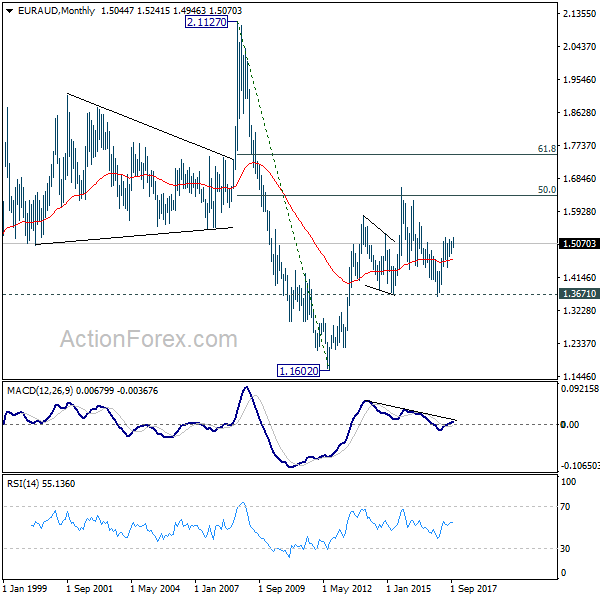
In the longer term picture, the rise from 1.1602 long term bottom isn't over yet. We'll keep monitoring the development but there is prospect of extending the rise to 61.8% retracement of 2.1127 to 1.1602 at 1.7488 and above. However, sustained trading below 1.3671 should confirm trend reversal and target 1.1602 long term bottom again.
EUR/CHF Weekly Outlook
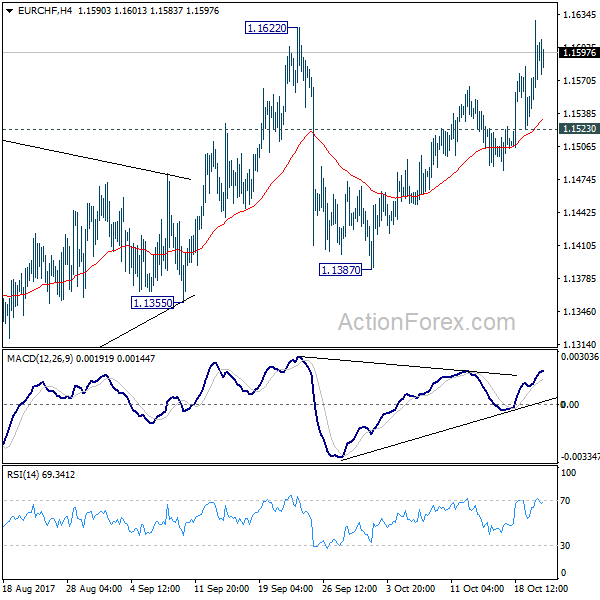
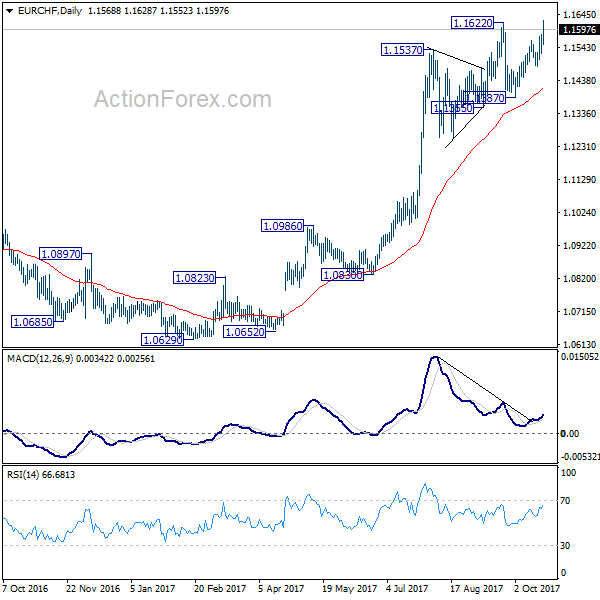
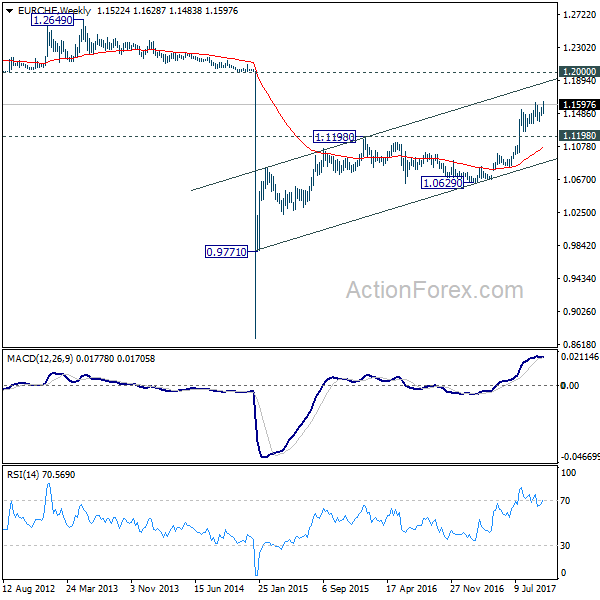
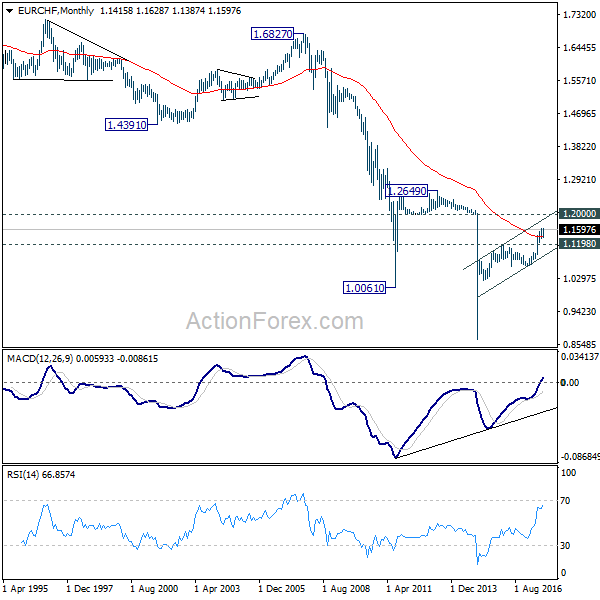
EUR/CHF's break of 1.1622 resistance argues that medium term rally is resuming. Initial bias is cautiously on the upside for further rally. Sustained break of 1.1622 will pave the way to 1.2 key level. On the downside, below 1.1523 will dampen this bullish case and turn bias to the downside for 1.1387 instead. In that case, consolidation from 1.1622 will extend for a while.
In the bigger picture, long term rise from SNB spike low back in 2015 is still in progress. EUR/CHF should now be heading back to prior SNB imposed floor at 1.2000. For now, this will be the favored case as long as 1.1198 resistance turned support holds.
Dollar Surged on Tax Plan Hope, Yields to Provide Further Support
Dollar surged broadly last week as Republican's tax plan overcame another hurdle. The news also sent DOW and S&P 500 to new records, with upside acceleration. Accompanying that, treasury yields closed sharply higher, reversing prior week's loss. Technical development in Dollar was not totally convincing yet. NZD/USD led the way lower as markets were unhappy with the new labour-led coalition in New Zealand. USD/CAD followed after disappointing economic data. Solid risk appetite also pushed USD/JPY and USD/CHF near term resistance to resume recent rally. But EUR/USD was kept in range only, showing much resilience in spite of political turmoil in Catalonia. GBP/USD was also held in range with support from some positive news regarding Brexit. AUD/USD also stays in recently established range.
A number of key events will be closely watched this week. The list include election in Japan on Sunday, Catalonia standoff and BoC rate decision. Nonetheless, the more market moving event should be ECB rate decisions where the central bank could announce to extending the asset purchase program but half the purchase size. Q3 GDP from UK and US will also trigger some volatility in the markets. In addition, there could be unscheduled news regarding US President Donald Trump's choice of next Fed chair, as well as news on the tax plan.
Dollar index gyrated around 55 day EMA - a bullish sign
Dollar index's gyration around a flat 55 day EMA is taken as a bullish sign. That is, rebound from 91.01 maybe not completed yet. Of course, in the background, there is bullish divergence condition seen in daily MACD. And, DXY breached 91.91/93 key long term support briefly (38.2% retracement of 72.69, 2011 low, to 103.82, 2016 high). Focus could now be back on 94.14/26 resistance zone this week. Decisive break there will confirm medium term reversal and target 38.2% retracement of 103.82 to 91.01 at 95.90.
10 year yield to take on 2.396/402 resistance again
This is also supported by the development in 10 year yield. TNX's pull back from 2.402 is possibly completed at 2.273, comfortably above 55 day EMA. Focus is now back on 2.396/402 resistance zone. Decisive break there will confirm that whole medium term correction from 2.621 has completed at 2.034, ahead of 50% retracement of 1.336 (2016 low) to 2.621 (2017 high) at 1.978. In that case, TNX would target a test on 2.621 key resistance next. And such development would be Dollar positive and Yen negative.
DOW up trend accelerated further
The above development was accompanied by recent acceleration in US stocks. DOW made another record close at 23328.62. Based on current momentum, DOW should now target 100% projection of 20379.55 to 22179.11 from 21731.12 at 23530.68. There is prospect of hitting 161.8% projection at 24642.80 in medium term. Such development will be Dollar and yield positive, and Yen negative.
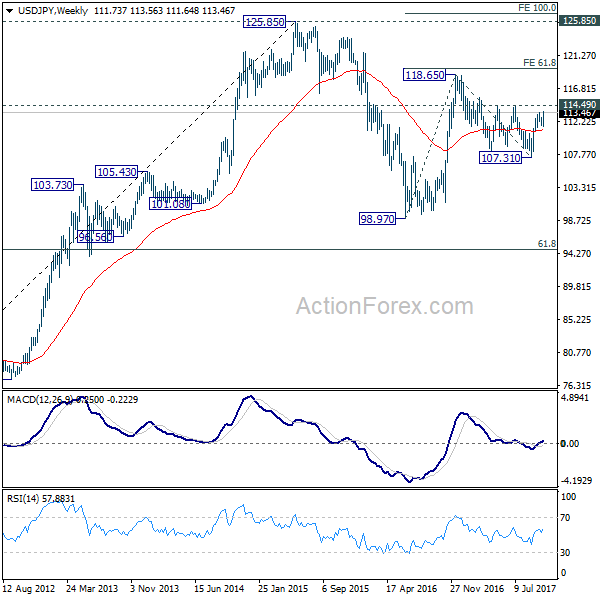
USD/JPY in bullish development
Taking a look at USD/JPY, last week's breach of 113.43 resistance suggests that rebound from 107.31 is resuming. More importantly, the development revives that case that correction from 118.65 has completed at 107.31 already. Immediate focus will be on 114.49 resistance this week. Sustained break there should at least send USD/JPY through 118.65 to 61.8% projection of 98.97 to 118.65 from 107.31 at 119.47. If the strength in yields and stocks carries on as noted above, USD/JPY should indeed break 125.85 to 100% projection at 126.99.
Trading strategies
Based on the above analysis on stocks, yield, Dollar index and USD/JPY, we'd buy USD/JPY at market this week with a stop at 112.50, slightly below 4 hour 55 EMA. Decisive break of 114.49 resistance will be the first affirmation of our bullish call. And, we'd initially look at 118.65 as first target, but keep an eye on the chance to hit 125.85 and above.
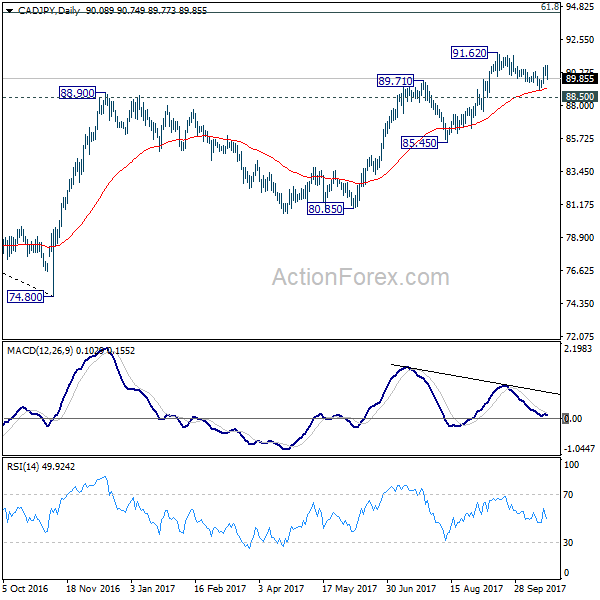
We're holding on to CAD/JPY long position (bought at 89.90). The cross hit as high as 90.76 but was weighed down by disappointing Canadian data. Still as price actions from 91.62 are corrective looking. And the cross did draw support from rising 55 day EMA. We're holding on to our bullish view and will keep the position, with stop at 88.50. Break of 91.62 will extend to the rise to our first target of 61.8% retracement of 106.48 to 74.80 at 94.37 and above.
USD/CHF Weekly Outlook
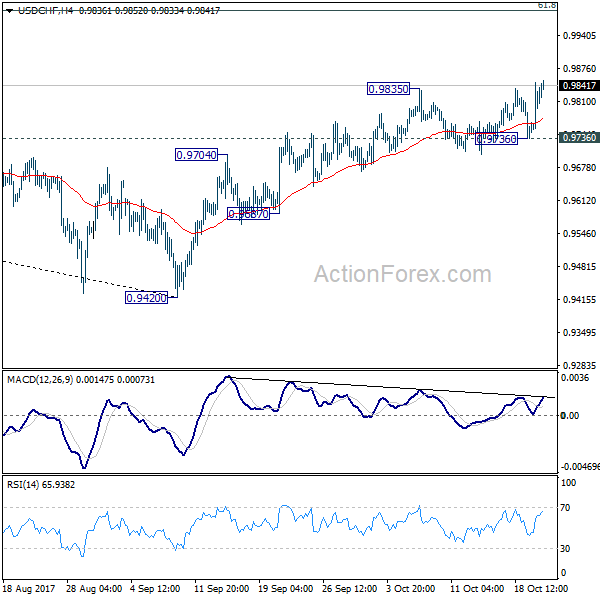
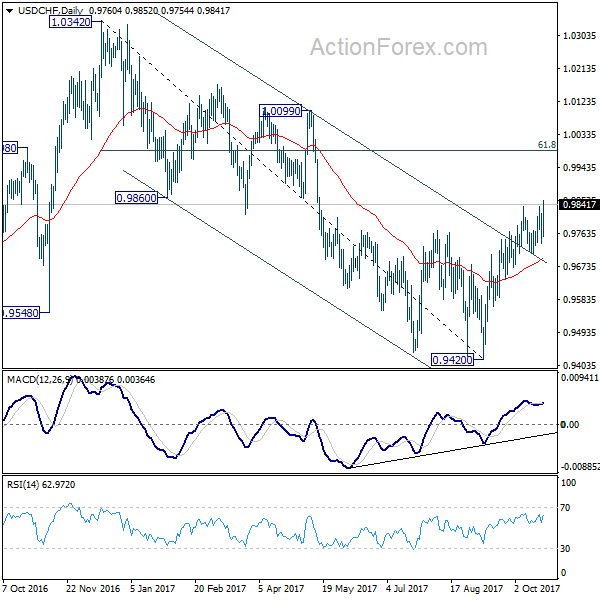
USD/CHF's break of 0.9835 resistance last week indicates that rebound from 0.9420 is resuming. More importantly, this affirmed the case that medium term fall from 1.0342 has finished at 0.9420. Initial bias stays on the upside this week for 61.8% retracement of 1.0342 to 0.9420 at 0.9990. Sustained break there will pave the way to retest 1.0342 high. However, break of 0.9736 support will mixed up the near term outlook and turn bias back to the downside for 0.9587 support instead.
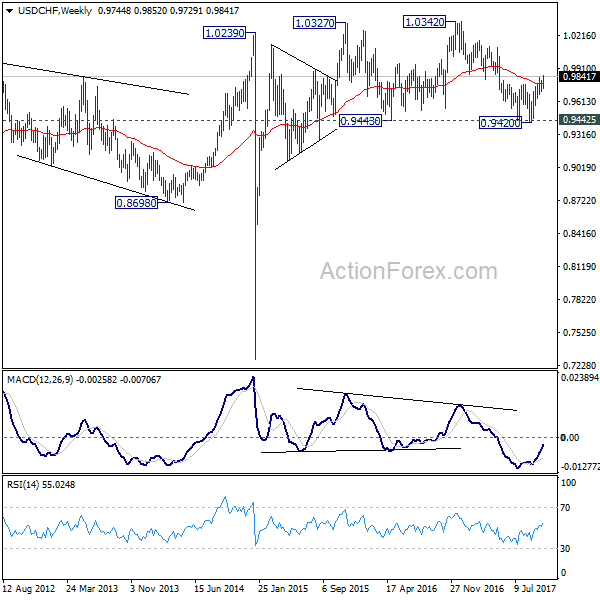
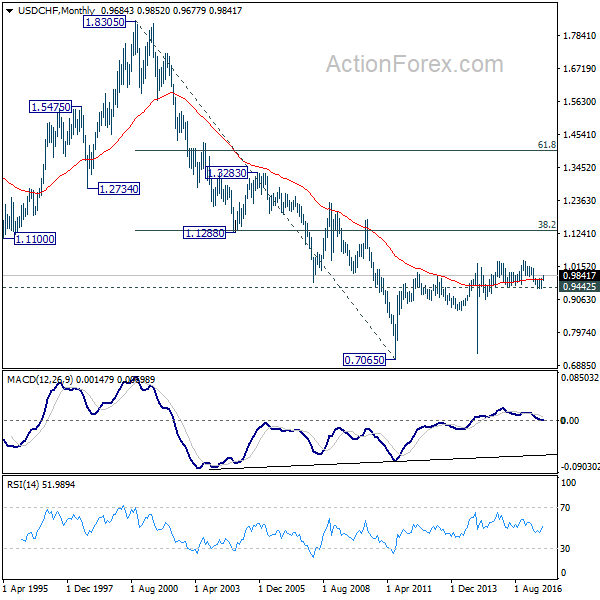
In the bigger picture, current development suggests that USD/CHF has defended 0.9443 (2016 low) key support level again. Rise from 0.9420 could develop into a medium term move and target a test on 1.0342 high. This represents the upper end of a long term range that started back in 2015. On the downside, break of 0.9587 support is now needed to indicate completion of the rise from 0.9420. Otherwise, further rally will remain in favor in medium term.
Eco Data 10/24/17
[php_everywhere] [/php_everywhere]
Eco Data 10/27/17
[php_everywhere] [/php_everywhere]
Eco Data 10/26/17
[php_everywhere] [/php_everywhere]
Eco Data 10/25/17
[php_everywhere] [/php_everywhere]
Eco Data 10/23/17
[php_everywhere] [/php_everywhere]
Summary 10/23 – 10/27
Monday, Oct 23, 2017
[php_everywhere] [/php_everywhere]
Tuesday, Oct 24, 2017
[php_everywhere] [/php_everywhere]
Wednesday, Oct 25, 2017
[php_everywhere] [/php_everywhere]
Thursday, Oct 26, 2017
[php_everywhere] [/php_everywhere]
Friday, Oct 27, 2017
[php_everywhere] [/php_everywhere].
Weekly Economic and Financial Commentary: Despite Hurricane Winds, Fed on Course for December
U.S. Review
Despite Hurricane Winds, Fed on Course for December
- Domestic economic data, unsurprisingly, continues to display the disruptive effects of the recent hurricanes. The Fed will likely look through the winds and stay the course for a December rate hike.
- Both industrial production and housing starts were muffled because of the storms, an indication that we may see payback in the next couple of months.
- Despite the relatively soft production and housing data, the Fed was likely encouraged by the rise in the better-thanexpected import price data.
Despite Hurricane Winds, Fed on Course for December
Domestic economic data, unsurprisingly, continue to display the disruptive effects of the recent hurricanes. Both industrial production and housing starts were muffled because of the storms, an indication that we may see payback in the next couple of months. Despite the relatively soft production and housing data, the Fed was likely encouraged by the rise in the better-thanexpected import price data. And while, yes, a jump in petroleum prices helped push prices higher in September, nonfuel import prices also continue to firm.
Hurricane Winds Still Disrupting Data
The modest 0.3 percent gain in industrial production for September would have likely been larger had it not been for the quarter percentage point drag from Hurricanes Harvey and Irma. Industrial production fell at a 1.5 percent annualized rate in the third quarter, but according to Fed estimates, this figure would have been an increase of at least 0.5 percent had it not been for the weather disruptions. Looking into the few remaining months of the year and assessing the outlook for 2018, we look for industrial production to accelerate modestly. The dollar's early strength in 2017 has largely reversed, which will likely boost investment plans for export-dependent producers. Moreover, energy prices have broadly stabilized, which has lifted mining output once again.
Housing starts were also unable to escape the wrath of the storms, declining 4.7 percent in September, much more severe than the consensus estimate of -0.4 percent. Likewise, permits fell 4.5 percent but remain nearly 8 percent above starts and set the table for a rebound in the coming months. While repairs on damaged homes are not counted as starts, they may impact starts by worsening labor shortages and driving material prices higher. It is likely that some projects may simply have been put on hold. September's drop in starts highlights the significance of Florida and Houston as huge housing growth markets. Housing starts in the South comprise nearly 50 percent of all starts in the nation. Existing home sales, released this morning, surprised to the upside, rising 0.7 percent month over month. However, sales in the South were -0.9 percent on the month, coming at the heels of a 5.7 percent contraction in August.
Weakening Dollar Putting Pressure on Import Prices
Import prices rose 0.7 percent in September, buoyed by a 4.5 percent increase in petroleum prices. Excluding fuel, prices rose 0.3 percent in September and are up 1.3 percent over the past year. The rise in nonfuel products was fairly broad, with industrial supplies, foods, capital goods and autos all posting gains. The firming in import prices can partially be traced to weakening in the broad trade weighted dollar over the past nine months. However, prices for U.S. exports also continued to move higher in September. The rebound over the past year has largely been driven by a recovery in commodity prices as well as capital goods exports as the global economy has strengthened.
While the Fed likely does not weigh import price inflation as heavily as the PCE deflator as a gauge of price growth in the economy, members of the FOMC are likely encouraged by the firming in nonfuel import price growth as they look to raise rates in December.
U.S. Outlook
Durable Goods • Wednesday
August's durable goods orders indicated continued strength in the manufacturing sector, beating expectations by rising 2.0 percent on the month. New aircraft orders led gains in the month, increasing by 44 percent. The strongest takeaway from August's reading, however, was in new orders for nondefense capital goods exaircraft, which grew by 0.9 percent over the month following a strong 1.1 percent gain in July. This "core" measure was at a 6.4 percent annualized growth rate over the past three months, signaling strength in the capital goods sector.
We maintain our call of solid equipment spending for Q3-2017 as we look ahead to September's report. We expect a gain of 6.9 percent in this component of fixed investment for the quarter, and the positive momentum of the core measure of durable goods orders indicates a strong Q4 as well.
Previous: 2.0% Wells Fargo: 1.0% Consensus: 1.0% (Month-Over-Month)
New Home Sales • Wednesday
New homes sales slipped 3.4 percent in August to a seasonally adjusted annual rate of 560,000 units. Much of this drop can be attributed to hurricanes Harvey and Irma that made landfall in the month in Houston and many parts of Florida. The impacted counties account for about 14 percent of single-family permits, therefore any disruption in that market will be felt in the national headline. While inventory of new homes for sale remain historically low, inventory did spike in August, however much of the increase was in homes not yet started or under construction. Lean inventories of completed homes and strong demand in higherpriced metro areas are keeping prices high.
We expect new home sales to be stronger in Q4 as demand, wages and household formation continue their upward momentum. For the full year, we expect to see new home sales of 610,000 units, with further strengthening in 2018 and 2019.
Previous: 560K Wells Fargo: 556K Consensus: 555K
GDP • Friday
Following a soft quarter of GDP growth of 1.2 percent in Q1, GDP rebounded to 3.1 percent in Q2-2017. The nearly 2 percentage point jump in GDP growth in Q2 can be at least partially attributed to seasonality, particularly in personal consumption, thanks to gains in disposable personal income of 3.3 percent.
We expect GDP growth of 2.1 percent in Q3 and 2.5 percent in Q4, which would amount to full year GDP growth of 2.1 percent in 2017. Storm disruptions in Houston and Florida slashed job gains and shut down business activity temporarily in important metro areas. While our call is below consensus, these hurricane effects bring heightened uncertainty to Q3 GDP, as some drivers of growth were pulled forward and some were pushed back. With output rebounding relatively quickly and expectations of some sort of tax cut enacted, we project GDP growth to increase to 2.4 percent in 2018.
Previous: 3.1% Wells Fargo: 2.1% Consensus: 2.6% (Annualized Quarter-Over-Quarter)
Global Review
Chinese Economic Growth Steady in Q3
- With the 19th Party Congress ongoing in China, data released this week on Chinese real GDP growth met expectations at 6.8 percent year-over-year growth. The deceleration in fixed investment spending in China continued, however, as a result of both secular and cyclical trends.
- Inflation in the United Kingdom remained above the Bank of England's target in September, while wage growth remained lackluster.
- Canadian CPI generally remained on trend in September and within the Bank of Canada's target band, while retail sales surprised to the downside.
Chinese Economic Growth Steady in Q3
Data released this week showed the Chinese economy growing 6.8 percent on a year-ago basis in Q3, matching the Bloomberg consensus forecast (see chart on front page). The print marks a 0.1 percentage point slowdown from the 6.9 percent pace registered through the first two quarters of the year. Economic growth in China has firmed in 2017 relative to last year's pace amid the stronger global growth environment. At present, we expect real global GDP growth to accelerate about half a percentage point in 2017, to 3.5 percent year over year.
Even with the faster growth at home and abroad, fixed investment spending in China has continued to decelerate (top chart). Growth in the secondary industry, which includes mining/quarrying, manufacturing, construction and utilities production, ticked lower by 0.1 percentage points to 6.3 percent this year through Q3, compared to the same period a year ago. Some of the slowdown has been the continuation of a secular trend; investment spending has decelerated for most of this cycle as the Chinese economy continues the steady transition towards a more consumption-oriented growth model. To that point, retail sales data released this week showed continued double-digit yearto- date growth through the month of September. More recently, investment spending growth has continued to slow as Chinese policymakers have moved to tighten policy amid concerns that the expansion in credit that occurred when the economy was slowing might lead to debt imbalances.
Elsewhere, economic data released out of the United Kingdom suggest that the woes facing the U.K. economy have remained in place. The consumer price index rose 0.3 percent in September and 3 percent over the year, while the core index held steady at 2.7 percent (middle chart). Both of these measures are in excess of the Bank of England's 2 percent inflation target, which has been exceeded largely due to the depreciation in the pound in the wake of last year's Brexit vote.
Despite the faster inflation, wages have failed to accelerate in tandem. Average weekly earnings data for August showed another flat reading of 2.2 percent year-over-year growth (bottom chart). Real wage growth, or nominal wage growth minus the inflation rate, has turned negative amid this acceleration in prices and stagnant wage growth, and the loss of purchasing power has weighed on consumers. Real retail sales excluding auto fuel in the U.K. fell 0.7 percent in September. Some of this decline was likely payback from August's large increase, but year-over-year real retail sales are up just 1.2 percent, hampering economic growth.
Canadian CPI rose 1.6 percent year-over-year in September, slightly below the consensus estimate of 1.7 percent. CPI excluding the more volatile food and energy components rose 0.2 percent on a monthly basis, rebounding after back-to-back flat monthly changes. While CPI was generally in line with expectations, Canadian retail sales for August declined 0.3 percent over the month versus the consensus estimate of a 0.5 percent increase. The August reading may be only a temporary pullback, as retail sales growth is in positive territory on a year-over-year basis.
Global Outlook
Mexico Economic Activity Index • Tuesday
Real GDP in Mexico rose only 1.8 percent on a year-ago basis in Q2- 2017. Growth in the tertiary sector of the economy (i.e., services) was resilient, but growth in the primary sector (agriculture) slowed significantly in Q2. Furthermore, growth in the secondary sector remained lackluster due to contractions in mining, construction and utilities production. The manufacturing sector continued to expand in Q2, albeit at a modest pace.
If the economic activity index is a useful proxy for overall real GDP growth, then the Mexican economy started the third quarter on a soft note as the index was up only 1.0 percent (year-over-year, not seasonally adjusted) in July. Analysts will get some more information on the state of the Mexican economy in Q3 with the release of the economic activity index for August (Tuesday) and retail spending data in August (Wednesday). Previous: 1.0% (Year-Over-Year)
U.K. GDP Growth • Wednesday
Contrary to some expectations at the time, the British economy remained largely resilient in the immediate aftermath of the Brexit referendum in June 2016. However, some of the effects that the surprising outcome put into train have had economic effects this year. Sterling fell sharply after the Brexit vote, which lifted consumer price inflation, thereby eroding growth in real income and weighing on personal consumption spending. Consequently, real GDP growth slowed to just 1.5 percent on a year-ago basis in the second quarter.
Preliminary GDP data for Q3 are on the docket on Wednesday, and we look for GDP to have risen 0.4 percent (not annualized) on a sequential basis. If our estimate of the sequential rate of growth is correct, it will represent some modest acceleration in the economy after two sluggish quarters in the first half of the year.
Previous: 0.3% Wells Fargo: 0.4% Consensus: 0.3% (Quarter-Over-Quarter)
ECB Policy Meeting • Thursday
The European Central Bank has administered an extraordinary degree of monetary accommodation to the Eurozone economy over the past few years. Not only did it take its deposit rate into negative territory in mid-2014, but it also embarked on a quantitative easing program in early 2015. At their peak, bond purchases by ECB totaled €80 billion per month, but the Governing Council pared back the monthly purchase rate to €60 billion earlier this year.
The Eurozone economy continues to gather momentum and most analysts, ourselves included, look for the Governing Council to announce another reduction in the bond purchase rate at the policy meeting on Thursday that likely will take effect early next year. In our view, the ECB will cease buying bonds altogether next year, although the exact timing in somewhat uncertain. We also look for the Governing Council to begin a slow process of rate hikes in late 2018.
Previous: €60 billion/mo. Wells Fargo: €40 billion/mo.
Point of View
Interest Rate Watch
The Race Is On
The Trump administration is nearing its decision on who will lead the Fed over the next four years. An announcement is expected before November 3, which would allow time for confirmation hearings prior to Yellen's term ending on February 1.
Trump has been meeting with potential candidates over the past month or so. Yet even as his decision approaches, there remains a wide degree of uncertainty surrounding his pick.
Odds makers currently have Governor Jerome Powell at the top of the list. Powell would offer continuity on the interest rate front, but is reported to favor a lighter regulatory touch—consistent with the Trump agenda.
Stanford University economist John Taylor looks to be another top contender. Taylor has been a critic of the Fed's large balance sheet and his namesake rule suggests the fed funds rate should be above its current level. While he has said that he wouldn't explicitly follow a rules based approach, he would be expected to be more hawkish than the current chair.
Also in the mix are former Fed governor Kevin Warsh and, to a lesser extent, National Economic Council Director Gary Cohn. Warsh is considered to be a hawk, having criticized the Fed for being too accommodative in recent years and paying too much heed to low inflation.
Still in the running, but a longer shot in our view, is current chair Yellen. While a "lowrate person", her commitment to tougher regulation since the crisis is at odds with the President's agenda. Moreover, following the president's lack of legislative victories, we wouldn't be surprised if he took the expiration of her term as an opportunity to put his own stamp on policy and appoint a new chair.
Whoever is chosen, the direction of the FOMC has tremendous potential to shift over the next year. There remain three open seats on the board even after Randall Quarles took office last week. In addition, 2018 will see two new first time voters with Atlanta Fed President Raphael Bostic and a new president at the Richmond Fed.
Credit Market Insights
Credit Card Debt Okay For Now
Consumer consumption growth outpaced disposable income growth for the past two years, and outstanding credit card debt is at an all-time high. Still, consumer confidence about future finances is high, according to recent surveys. We are starting to see an uptick in delinquent credit card accounts, but the level remains historically low. The credit card delinquency rate has risen to 2.5 percent from its trough of 2.1 percent in 2015. As long as incomes continue to rise, the current trend in credit card debt is likely sustainable.
Rising interest rates pose a downside risk to this outlook, however. The interest rate for credit card plans rose 0.5 percentage points over the past year to 13 percent. That rise is also likely manageable, as disposable income rose 2.7 percent over the past year. While the consumers' financial situation is far from precarious on aggregate, higher interest rates could push some more vulnerable households into delinquency.
An uptick in disposable income would help to alleviate some of that risk, though there is little reason to expect income growth to break out from its 2-3 percent range held in recent years. Moreover, while the stock market has played a large role in the recent rise in consumer confidence, proceeds from the bull market are less likely to be the main source of income growth for credit card debtholders close to delinquency.
Topic of the Week
Is Low Capacity Utilization a Cause for Concern?
As part of the industrial production data released on Tuesday, manufacturing capacity utilization increased slightly to 75.5 percent. However, throughout the current cycle, capacity utilization, or the share of actual output achieved relative to potential output, has yet to surpass its pre-recession peak (top graph). Capacity utilization has trended downward since the 1980s, while industrial production has accelerated. Should we be concerned about the slowdown in capacity utilization, or simply acknowledge that capacity utilization will likely remain lackluster in future cycles?
The answer to this question lies in the fundamental divergence between manufacturing industrial production and capacity utilization over the past few cycles. Until the most recent expansion, manufacturing industrial production has peaked at higher levels after each recession. However, these periods of strong manufacturing industrial production growth occurred alongside the opposite trend in capacity utilization. In every cycle since 1982, capacity utilization has peaked at a lower level than the previous cycle. In the current cycle, manufacturing capacity utilization is still 4 percent below its pre-recession peak.
Aside from a temporary peak in industrial production as low oil prices increased mining output in late 2014, manufacturing industrial production is also still 4 percent below its pre-recession peak (bottom graph). Manufacturing is the most heavily weighted industrial group, comprising more than three-quarters of total industrial production.
Although factory hiring has rebounded this year, the broader downward trend in the sector's output after the manufacturing boom of the 1970s will likely continue to weigh on growth. Manufacturing employment has declined from 21 percent of total nonfarm employment in 1980 to 8.5 percent today. Low capacity utilization rates alone may not be cause for concern, but depressed manufacturing output and slow employment growth could weigh on the Fed's 2 percent inflation target.