

Sample Category Title
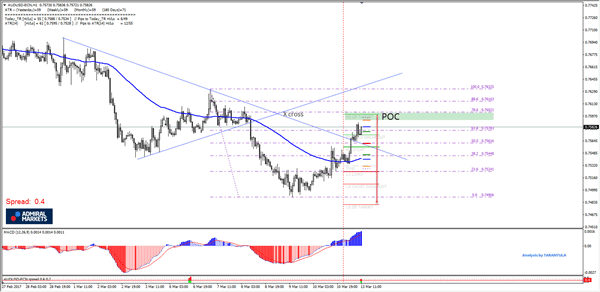
AUD/USD X Cross At POC Zone
The AUD/USD has formed an X cross (intersection of two trend lines or a trend line with a strong PP) exactly at the POC zone 0.7595-0.7605 (H5, ATR top, 78.6) and the pair might start to reject towards 0.7555 zone. If the pair breaks below 0.7545 (ATR, EMA89 support) we should see a continuation towards 0.7525, L3 support. Final target is 0.7480 for this move. Ideally for this scenario to succeed, the pair should stay below 0.7635 as the spike to 0.7635 would lead to a possible ascending scallop with a stronger correction to the upside.
Forex Technical Analysis
EUR/USD
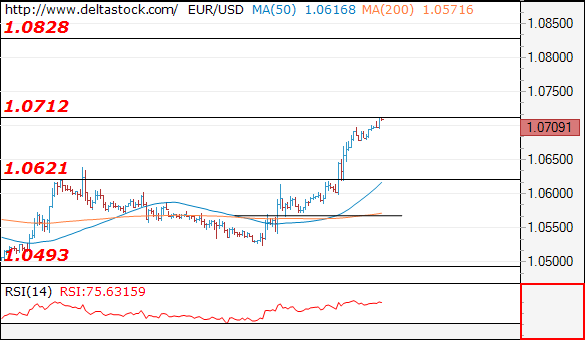
Current level - 10709
Despite the positive bias, my outlook is counter-trend, for a break through 1.0620 crucial support, towards 1.0490 lows.
| Resistance | Support | ||
| intraday | intraweek | intraday | intraweek |
| 1.0710 | 1.0710 | 1.0620 | 1.0450 |
| 1.0828 | 1.0870 | 1.0493 | 1.0350 |
USD/JPY
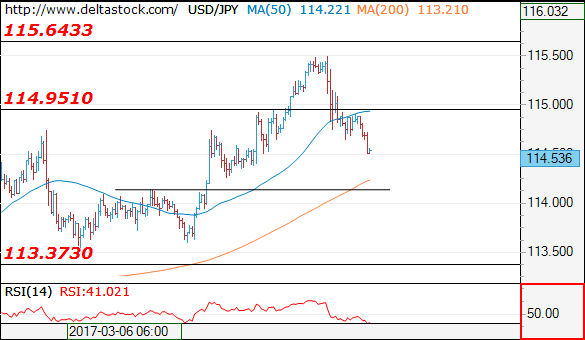
Current level - 114.53
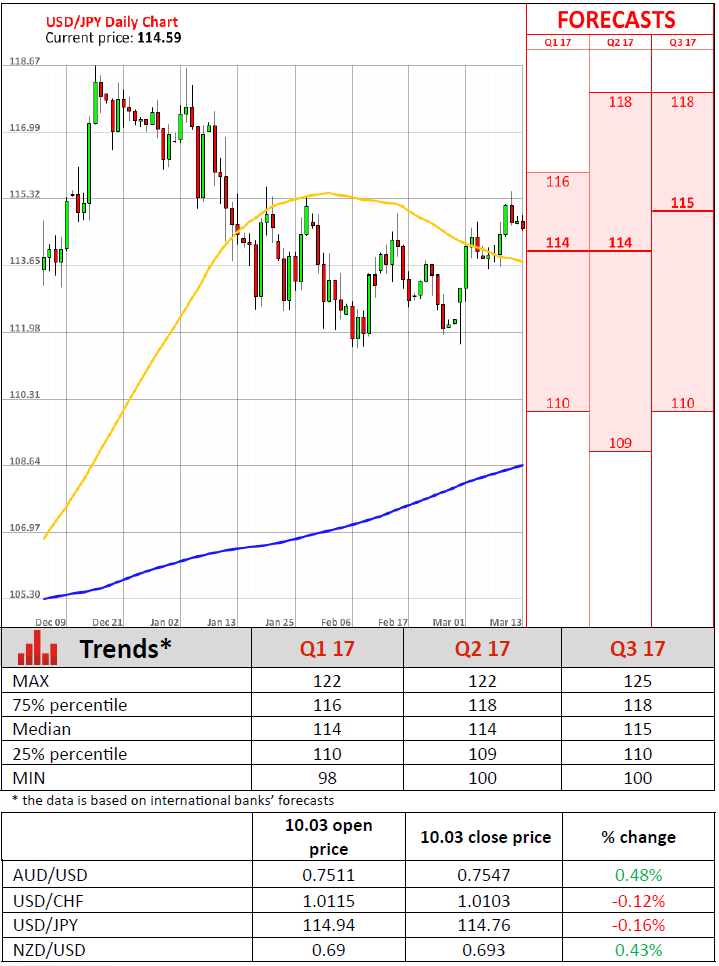
The recent reversal at 115.50 led to a corrective slide and the intraday bias is negative, for a possible test above 114.10 support zone. Initial intraday resistance lies at 114.95 and a break through the latter will signal a renewal of the general upmove, towards 115.65 area.
| Resistance | Support | ||
| intraday | intraweek | intraday | intraweek |
| 114.95 | 118.65 | 114.10 | 114.10 |
| 115.65 | 120.00 | 114.10 | 113.37 |
GBP/USD
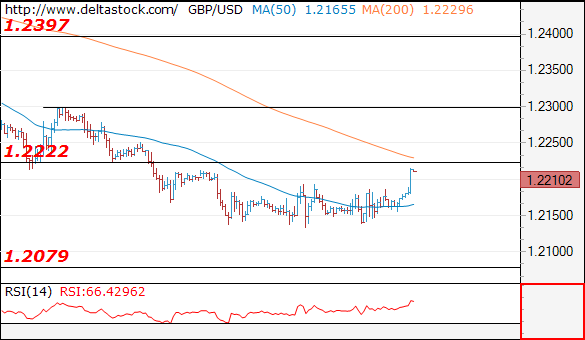
Current level - 1.2210
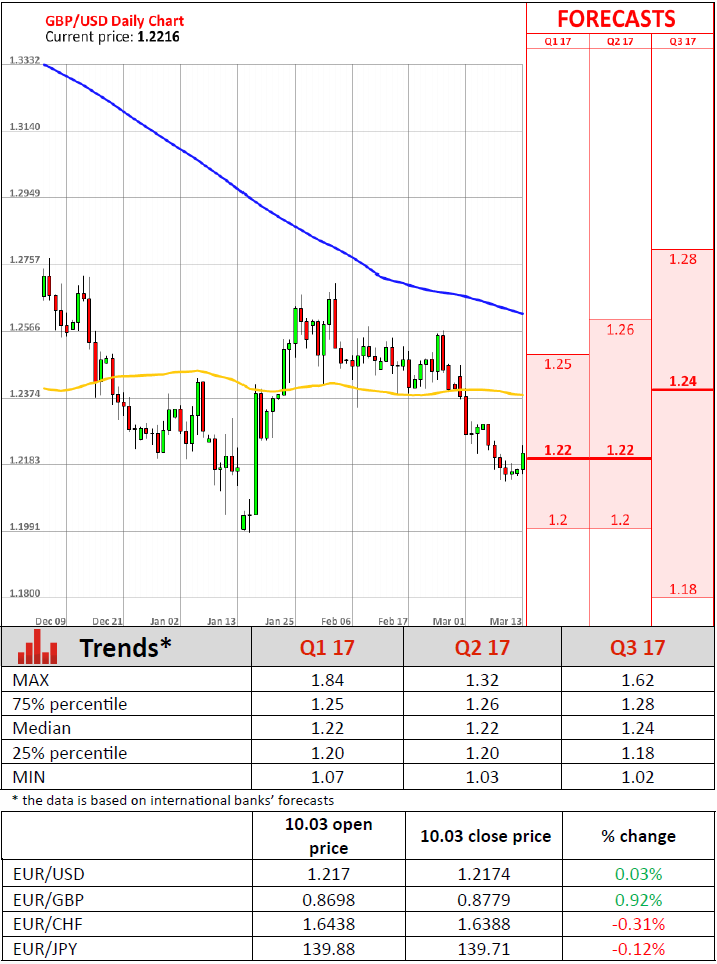
The intraday bias is positive above 1.2185 minor support, with a risk of an intraday rise towards 1.2300 major hurdle. A break through 1.2185 will signal a slid towards 1.2080 zone.
| Resistance | Support | ||
| intraday | intraweek | intraday | intraweek |
| 1.2220 | 1.2570 | 1.2130 | 1.2080 |
| 1.2300 | 1.2705 | 1.2080 | 1.1984 |
EUR/USD Surges Above 1.07 Mark
'Following the ECB's policy review on Thursday, President Mario Draghi refused to speculate on the possibility of rate increases before quantitative easing ends.' - Tanvir Sandhu, Bloomberg
Pair's Outlook
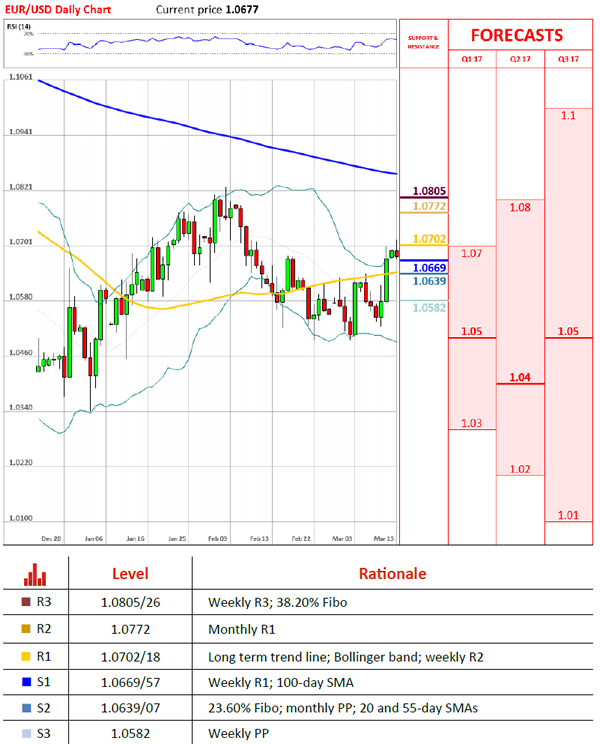
Due to comments from the president of the European Central Bank, Mario Draghi, the common European currency jumped against the US Dollar in the recent trading sessions. The currency exchange rate already reached the new second weekly resistance level at 1.0718. The last time the rate was at such level was on February 6. As Mario Draghi is set to speak also on Monday, it is likely that the Euro would continue the surge. In such case the weekly S2 would be broken, and the rate would surge up to the monthly R1, which is located at 1.0772 level.
Traders' Sentiment
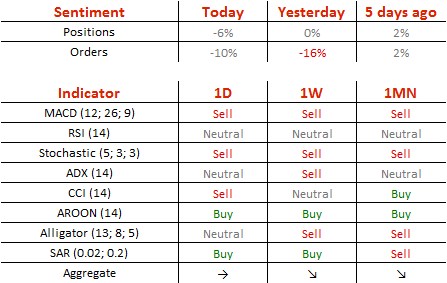
SWFX traders have become bearish regarding the pair, as 53% of open positions are short on Monday. Meanwhile, 55% of trader set up orders are set to sell the Euro.
GBP/USD Regains Bullish Momentum
'I am bearish on the pound and I think it will be lower a year from now. Similarly, while the U.K. economy will not unravel due to Brexit, I would expect the process to take a toll on growth for many years to come.' – Erik Wiesman, MFS Investment Management (based on Bloomberg)
Pair's Outlook
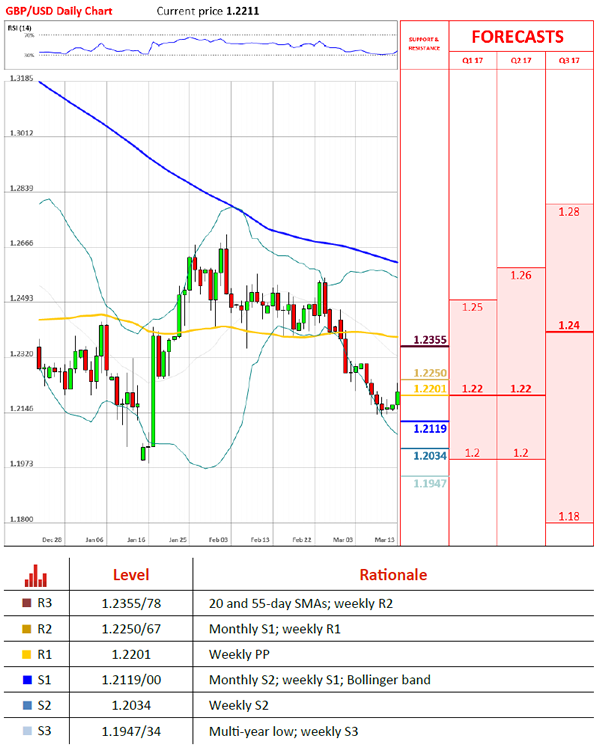
Even though the US NFP data came out strong on Friday, the earnings growth still disappointed, bringing doubts over a March rate hike, thus, turning the tide on the Greenback's rally. As a result, the Cable traded flat that day, but began edging higher today amid a corrective decline in the US Treasury bond yields. Consequently, the GBP/USD pair now has the potential to reclaim the 1.22 major level, where the weekly pivot point is the nearest resistance. The 1.2250 is the next target, but is likely to remain out of reach, as the monthly S1 and the weekly R1 form another strong supply area there.
Traders' Sentiment
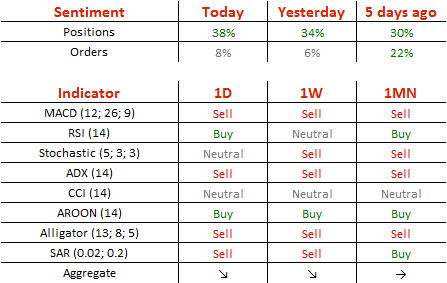
Bulls grew stronger over the weekend, as now 69% of all open positions are long, compared to 67% on Friday. At the same time, the portion of purchase orders barely changed, having risen from 53 to 54%.
USD/JPY Sets Eye On 116.00
'We believe the USD/JPY will edge upward to the ¥115-120 level not in a straight line but with some fluctuation over the coming 3-6 months.' – Deutsche Bank (based on FXStreet)
Pair's Outlook
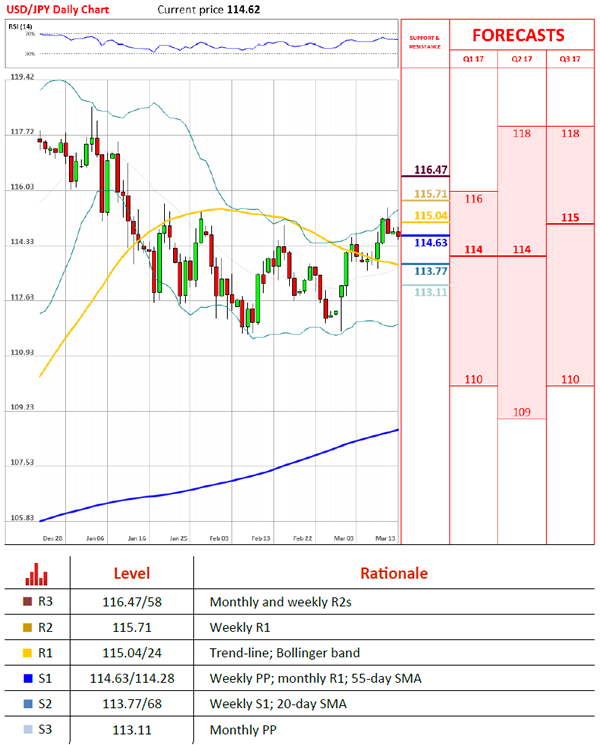
The Greenback failed to appreciate against the Japanese Yen on Friday, therefore, preserving the ascending channel's resistance line. The pair failed to reclaim the 115.00 major level, which suggests a possible retest of the channel's lower boundary within the next two weeks. Today the Buck is expected to weaken against the Yen, as the bearish momentum persists from the disappointment of Friday's earnings growth data. However, due to lack of any other market movers, the given pair could retain its position above the immediate demand area, namely the monthly R1 and the weekly PP around 114.63. Any slide further down is to be limited by the 55-day SMA circa 114.28.
Traders' Sentiment
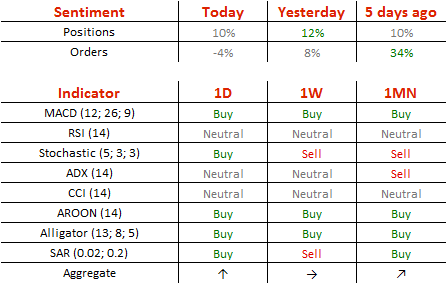
There are 55% of traders holding long positions today (previously 56%), while 52% of all pending orders are to sell the US Dollar.
Gold Continues To Rebound
'Looks like people are ready to buy gold below $1,200 and it is sort of a psychological level. Think people got confounded after Friday's move and the short ones are buying back now.' - Yuichi Ikemizu, Standard Bank (based on Reuters)
Pair's Outlook
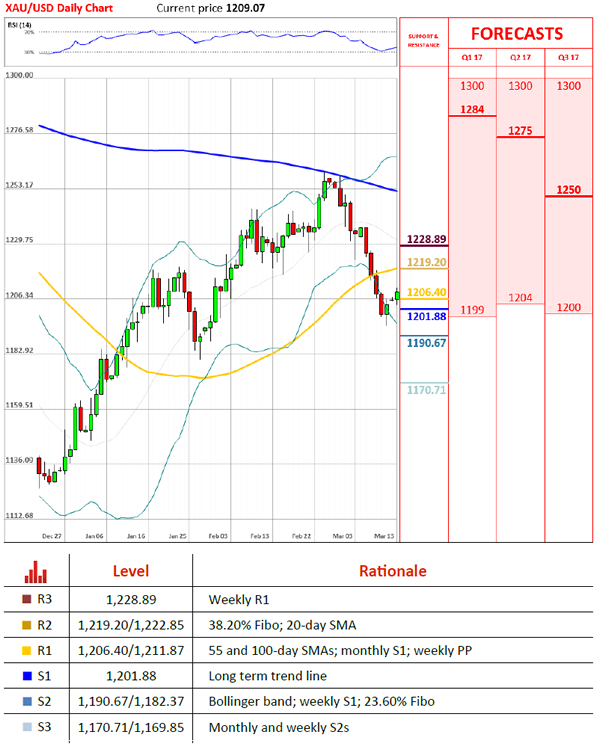
During the early hours of Monday's trading session the yellow metal's price had surged above the 1,210 mark, as the bullion continued the course of regaining its losses. The commodity price managed to pass a resistance cluster just below the 1,210 level, and the metal faced only the weekly PP at 1,211.87. The weekly PP is the last resistance level before the 1,219.20 mark, where the 38.20% Fibonacci retracement level is located at. Due to these factors combined, it is expected that the cluster below will provide enough support to push the metal's price higher.
Traders' Sentiment
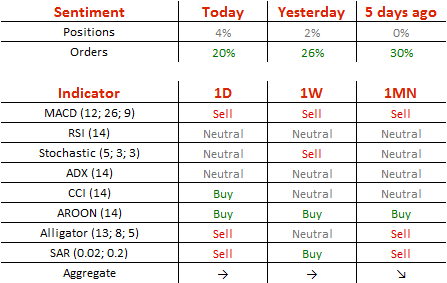
Traders are bullish on the metal, as 52% of open SWFX positions are long. In addition, 60% of trader set up orders are set to buy the bullion.
UK Production Index Experiences 0.4% Fall In January
'The monthly decline reflects a correction from December's sharp increase and the underlying trend is still for a solid underlying increase in output'. - Tim Clayton, EconomicCalendar.com
In January, British total production experienced a 0.4% decrease compared to the previous month, the Office for National Statistics revealed on Friday. This number was mostly attributed to declines in the water and manufacturing sectors, where production fell 0.7% and 0.9%, accordingly. The largest contribution to January's fall came from pharmaceutical products that posted a 13.5% drop, following growth of 8.2% in the previous month. However, this kind of change is not unusual for the pharmaceutical industry, as it can be highly volatile due to the timing of contracts. To certain extent, it was counterbalanced by production of transport equipment that increased 2.6% and reached the highest level since April 2016. This growth was supported by a 2.4% gain posted by the wood, paper and printing industry and a 2.3% increase posted by the textile, chemicals and machinery industries. Nevertheless, the largest month-to-month growth was seen in the other mining and quarrying sector, where production advanced 3.6%. Yet, this figure only partially allowed to offset a 8.6% drop in the coal and lignite sector. On an annual basis, the British Production Index increased 3.2% in January. Growth was seen in all four major sectors but the biggest contribution of 2.7% came from manufacturing.
Solid US Jobs Data Support March Fed Rate Hike
'We continue to expect the Fed to raise its policy rate by an above-consensus four times this year.' - Paul Ashworth, Capital Economics
The US private sector created more jobs than expected last month, providing support for a Fed interest rate hike on Wednesday. The Bureau of Labor Statistics reported on Friday that nonfarm payrolls rose 235,000 in February, while analysts expected nonfarm employment to climb 196,000 in the reported month. Meanwhile, January's gain of 227,000 was revised up to 238,000. The construction sector contributed most to the February gain, adding 58,000 jobs. Over the past six months, the sector created an average of 177,000 jobs per month Data also showed average hourly earnings advanced 0.2%, falling behind analysts' expectations for a 0.3% increase. January's rise of 0.1% was revised up to 0.1%. The jobless rate came in at 4.7% for February, marginally down from the prior month's 4.8% and in line with market forecasts. Over the past three months, the US private sector added an average of 209,000 jobs per month. The better-than-expected NFP report combined with rising inflation are likely to force the Federal Reserve to raise rates for the first time this year on Wednesday, during its policy meeting. Back in December 2016, the Central bank projected at least three rate hikes in 2017. Analysts suggest that the US labour market is at or close to full employment.
Statistics Canada Releases Strong Jobs Data For February
'Overall, this was a good news day for Canada's workers, but we're still well behind the U.S. in terms of getting back to full employment and more vibrant wage gains.' - Avery Shenfeld, CIBC World Markets
The Canadian unemployment rate fell unexpectedly last month, as employment rose more than expected. Statistics Canada reported on Friday that employment climbed 15,300 in February, following the preceding month's unrevised gain of 48,300 and surpassing analysts' expectations for a 600 rise. On an annual basis, employment advanced 288,000, with the largest gains posted in July 2016. Month-over-month and year-over-year, full-time employment rose 105,000 and 235,000, respectively, while the number of part-time workers declined 90,000 in February. In regional terms, the biggest employment gains were registered in British Columbia, Saskatchewan and Manitoba. The wholesale and retail trade industry contributed most to the February rise, with an increase of 35,000. Furthermore, following stronger-than-expected employment data, the Canadian jobless rate dropped to 6.6% last month, the lowest since June 2016. Analysts suggest that the Canadian economy has fully recovered from the oil price shock, which hit the economy in 2014, and the Alberta wildfires that took place in May 2016. Despite strong economic and employment growth, the Bank of Canada is unlikely to change its monetary policy.
Oil: “Meet the Frackers”
OPEC finds itself crossing its fingers that the price falls of last week are a washout of positioning and not a structural change.
Both Brent and West Texas Intermediate (WTI) ended down some 9% last week. An emotional fall from grace as record speculative long positioning in both was shown the door after three months of stagnation. The CFTC Commitment of Traders report released last Friday only captures positioning up to the previous Tuesday and thus will not have captured just how many oil bulls remain "committed" to their views as of Friday. This week's release on Friday the 17th will.
The Saudi's, in particular, will be casting a nervous eye on it. They have unfortunately ended up in the unwanted role of swing producer, wearing most of the pain of OPEC/NOPEC cuts to prop up prices. They will be hoping that the price action of last week is a washout of positioning and not a structural change to the market. It ends up being a lose-lose situation for them otherwise. Cutting production to prop up prices, losing market share, and now looking down the barrel of lower prices after a brief rally of a few months. OPEC's renewal meeting on the 25th of May could be emotional indeed, and one suspects the Saudi's will be looking to share the heavy lifting more equitably judging by media comments by officials.
One can't really blame them in all honesty; they've not had much help from their OPEC and non-OPEC allies. Producers such as Libya and Nigeria were given a leave pass from the deal altogether. The Iraqi's, Iranian's both ramped up production ahead of the cut start date and have signalled they have plenty of production ammunition ready to go when it rolls off. The Russian's, the world's largest producer daily at some 11 million barrels a day (bpd), have managed to cut a paltry 150,000 bpd of their target of 300,000 bpd and we are three months into the reduction period. Thanks for nothing guys.
But it is the ramp up in U.S. shale that has really caught the world and OPEC on the hop. The Baker Hughes Rig Count showed yet more of those fracking rigs (sic) added last week, with the U.S. rig count hitting 768, up from 480 a year ago. Baker Hughes Rig Count The ability of shale to be profitable above $50 a barrel despite the prices of the best shale acreage exploding in price is impressive. Given their pace of innovation, they may well be profitable at much lower levels than that. Something to cause sleepless nights at OPEC's HQ in Vienna.
The other factor is just how much of the other side of those record speculative longs in the futures markets was shale oil hedging future production. As I have said in the past, the new world of shale financing means they are obliged to forward hedge and lock in profits via the futures markets. For once the banks may have done them a favour as shale may have by luck or design, hedged out their downside risk to a certain extent giving them effectively even deeper pockets.
The whole situation must be a game theorists nightmare for the Saudi's and the UAE. Having led the charge to get the production cut deal across the line, they may not even have the prisoners dilemma option of "taking the deal first," as most of their competition seems to have taken it simultaneously already. OPEC/NOPEC can expect no help from U.S. shale in future production cut deals either even if they wanted to. The shale industry is fractured (pardon the pun), with many producers and no single dominant one. There is no government body as per so much of OPEC that controls the industry. Most importantly cartel-like behaviour is absolutely against the law in the United States. There is a reason the De Beers, for instance, has no corporate presence in the U.S.A.
Coming back to the here and now, the charts make for interesting reading today.
Brent Crude (spot)
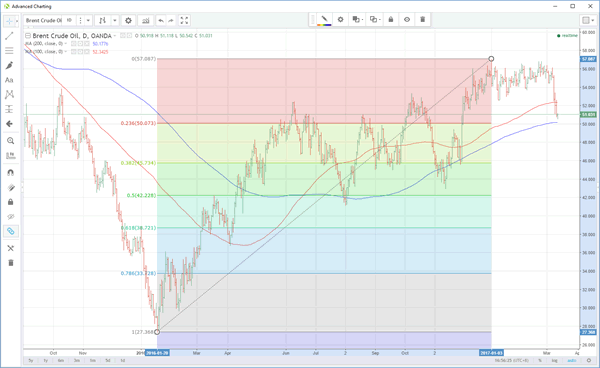
Brent has managed to catch some breath today but is still perched precariously just above $50. Resistance is above at the 100-day moving average (dma) at $52.34.
Support initially comes in at $50.1770, the 200-dma and then the 23.60% Fibonacci retracement at %50.07. (the move from the 2016 lows at $27.368 to the January 1st highs at $57.00)
For simplicity's sake lets just say that the $50.00 a barrel area, therefore, is an important support zone. A lot of clear air appear after this until the $45.75/$45.75 regions. The 38.2% fibo retrace and the low of 29th November.
Brent Daily
West Texas Intermediate (spot)
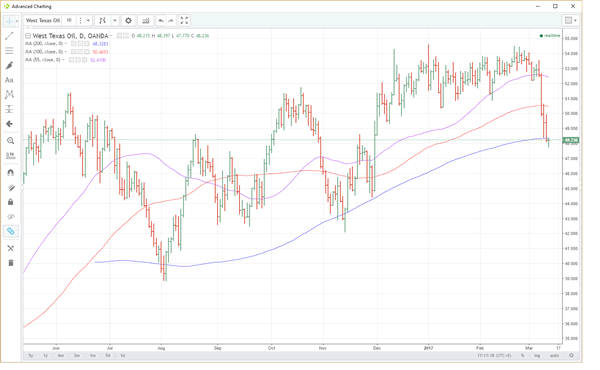
Broke $50.00 a barrel last week and is currently sitting around its 200-dma at $48.3300. A daily close above here is vital to give bulls a semblance of hope of some sort of correction from a technical basis. Above here resistance sits at $50.4700, the 100-dma.
Support is at the day's low at $47.7700 and then clear air until the 29th November low at $44.4300.
WTI Daily
Summary
Oil is not out of the woods from a technical perspective. Short-term the charts and the price action still appear to be quite bearish potentially. There is a lot of event risk this week, but the culmination will be the COT report on Friday. This will capture the price action of last week and go a long way to informing whether most of thge pain has been taken by speculators, or whether there are more tears ahead. In the bigger picture OPEC and particulalrly Saudi Arabia as the swing producer, could be in an undersirable position heading into the middle of the year.