Sample Category Title
EUR/CAD Elliott Wave Analysis
EUR/CAD – 1.4700
Although the single currency edged higher to 1.439 last week, the subsequent retreat suggests consolidation below this level would be seen and weakness to 1.4635 support cannot be ruled out, however, a daily close below there is needed to suggest the rebound from 1.4441 has ended there, bring further fall to 1.4550-55 and later towards support at 1.4488. Looking ahead, euro needs to penetrate this support to revive bearishness and signal early erratic decline from 1.5259 top has resumed for retest of 1.4441. An drop below this level would extend the fall from 1.5259 to 1.4400 and possibly towards 1.4345-50 (61.8% Fibonacci retracement of 1.3784-1.5259), however, reckon downside would be limited to 1.4290-95 (100% projection of 1.5259-1.4478 measuring from 1.5076) and 1.4190-00 should hold, price should stay above 1.4110-15 (1.236 times projection), bring rebound later.
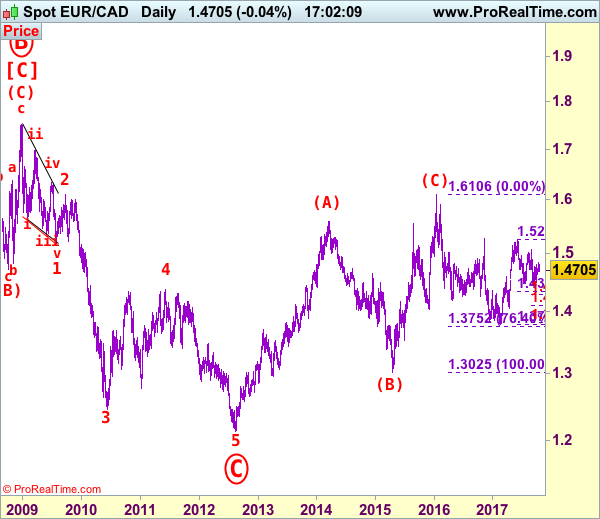
Our latest preferred count is that larger degree wave [C] from 1.3289 as well as circle wave B ended at 1.7509 in Dec 2008 with (A): 1.6325, (B): 1.4719 followed by wave (C) at 1.7509, hence circle wave C is unfolding with wave 1 ended at 1.5186 (diagonal wave 1), wave 2 at 1.6096, impulsive wave 3 has ended at 1.2451, followed by wave 4 at 1.4380, in view of recent strong rebound, we are now treating the wave 5 as well as larger degree circle wave C has ended at 1.2129, hence (A)-(B)-(C) correction has commenced from there with impulsive wave (C) now unfolding and indicated initial upside target at 1.6000 had been met and reckon 1.6500 would hold.
On the upside, whilst initial recovery to 1.4750-60 cannot be ruled out, reckon upside would be limited and said resistance at 1.4839 should hold, bring another retreat. Above said resistance would signal the rebound from 1.4441 is still in progress for further gain too 1.4900, having said that, price should falter below 1.5000 and bring another decline later.
Recommendation: Stand aside for tis week.
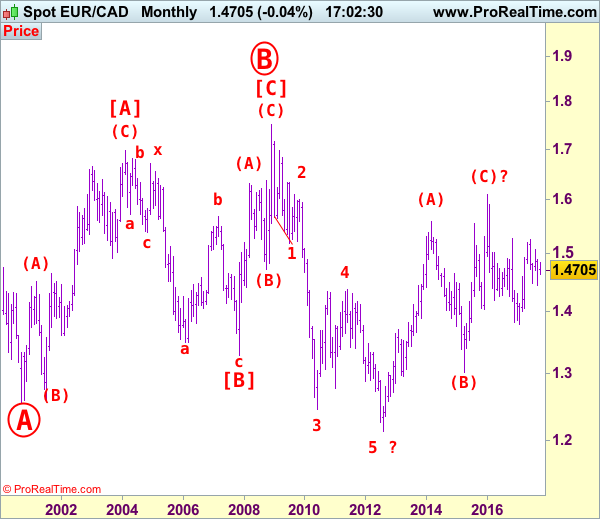
On the bigger picture, our long-term count on the monthly chart is that a big sideways consolidation from 2000 low of 1.2557 has possibly ended at 1.7509 as circle wave B with [A]: 1.6976 ( (A): 1.4513, (B): 1.2612, (C): 1.6976), wave [B]: 1.3289 is a double three with 1st a-b-c: 1.5384, x: 1.6709 and 2nd a-b-c: 1.3289. As indicated above, the wave [C] has ended at 1.7509. The selloff from there is now unfolding which itself should be labeled as an impulsive wave with wave 1: 1.5186 (diagonal wave 1), followed by wave 2: 1.6096 and wave 3: 1.2451, wave 4: 1.4380, wave 5 as well as larger degree circle wave C has possibly ended at 1.2129 and major correction has possibly commenced for retracement of recent decline towards 1.4000, then 1.4180-90 (38.2% Fibonacci retracement of 1.7509-1.2129). Below said support at 1.2129 would risk weakness to psychological support at 1.2000 and then 1.1851 (50% projection of 1.7509-1.2451 measuring from 1.4380) but reckon 1.1500 would remain intact, bring reversal later.
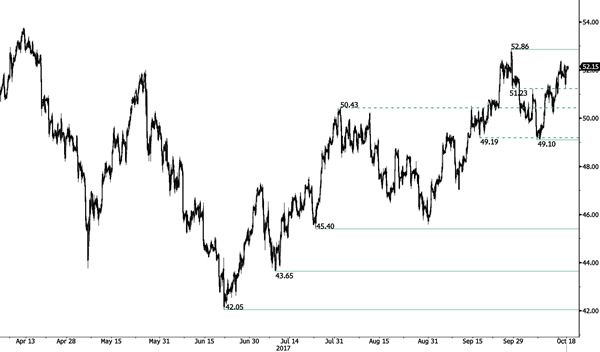
CRUDE OIL Monitoring Resistance At 52.86
Crude oil is pushing higher within a range defined by the support at 50.43 and the strong resistance lies at 52.86 (28/09/2017). Expected to show continued increase within this range.
In the long-term, crude oil has recovered after its sharp decline last year. However, we consider that further weakness are very likely. For the time being the pair lies in an upside momentum. Strong support lies at 35.24 (05/04/2016) while resistance can now be found at 55.24 (03/01/2017 high).
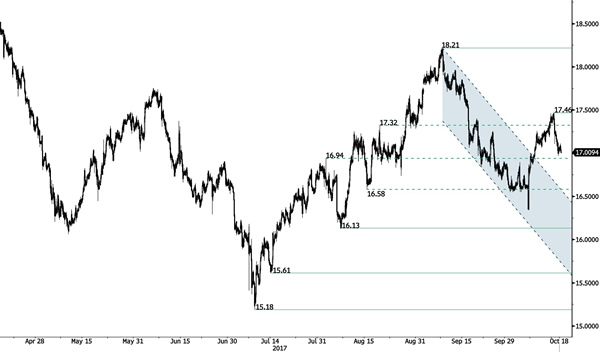
SILVER Approaching The Support At 16.94
Silver is weakening and is now close to the support at 16.94. Hourly resistance is given at 17.46 (13/10/2017 high). Additional support can be found at 16.13 (06/10/2017 low). Hourly resistance can be found at 17.10 (intraday high).
In the long-term, the trend is rater negative. Further downsides are very likely. Resistance is located at 25.11 (28/08/2013 high). Strong support can be found at 11.75 (20/04/2009).
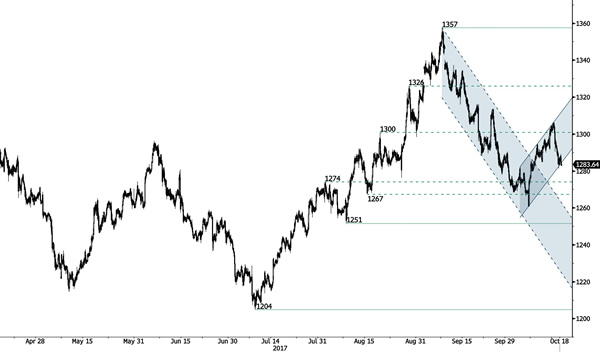
GOLD On The Edge Of Bullish Channel Floor
Gold has broken the support at 1284 confirming an underlying bearish trend. Strong support lies at a distance at 1204 (10/07/2017 high). Resistance is located at 1288 (intraday high).
In the long-term, the technical structure suggests that there is a growing upside momentum. A break of 1392 (17/03/2014) is necessary ton confirm it, A major support can be found at 1045 (05/02/2010 low).
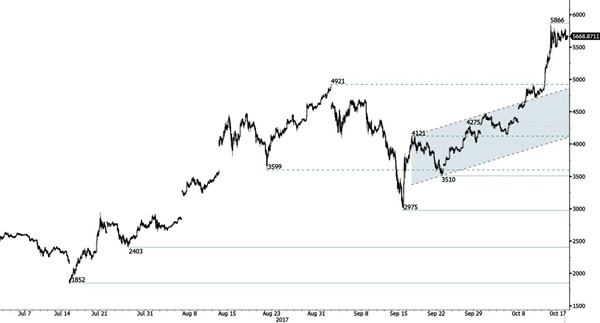
BITCOIN Bullish Drift
Bitcoin is definitely on a strong momentum. Strong support stands very far at 2975 (22/08/2017 low). Bitcoin si ready to set up new all-time high. The road is wide open for further increase. In the short-term, the digital currency should monitor $6000.
In the long-term, the digital currency has had an exponential growth. There are decent likelihood that the asset will reach $10'000.
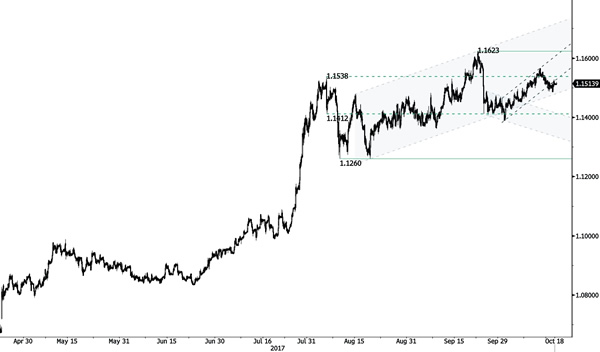
EUR/CHF Bearish Drift
EUR/CHF is drifting after breaking short-term bullish trend. Downside pressures are now likely to accelerate. Strong resistance lies at 1.1566 (12/10/2017 high). Support is given at 1.1388 (02/09/2017 low). Downside risk is very likely.
In the longer term, the technical structure has reversed. Strong resistance is given at 1.20 (level before the unpeg). Yet, the ECB's QE programme is likely to cause persistent selling pressures on the euro, which should weigh on EUR/CHF. Supports can be found at 1.0184 (28/01/2015 low) and 1.0082 (27/01/2015 low).
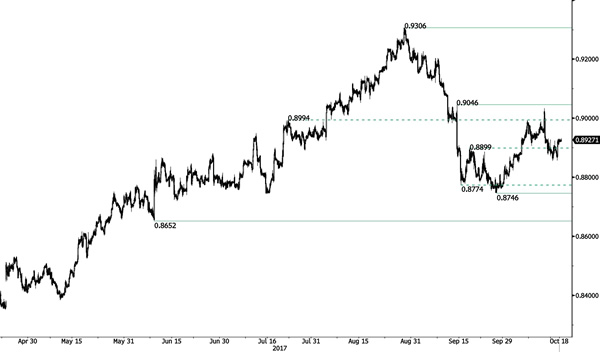
EUR/GBP Recovery Bounce
EUR/GBP continues to bounce higher yet not important resistances have been broken. The pair is back below former resistance at 0.8899 (19/09/2017 low). The very short-term technical structure is clearly biased to the downside. Hourly support is given at a distance at 0.8746 (27/09/2017 low).
In the long-term, the pair has largely recovered from recent lows in 2015. The technical structure suggests a growing upside momentum. The pair is trading above from its 200 DMA. Strong resistance can be found at 0.9500 (psychological level).
AUD/USD Elliott Wave Analysis
AUD/USD – 0.7827
Although aussie rebounded after finding support at 0.7733, as the pair met resistance at 0.7897 late last week and has retreated, retaining our bearishness and consolidation with mild downside bias remains for weakness to 0.7770-75, break there would signal the rebound from 0.7733 has ended, then retest of this level would follow. Once this support is penetrated, this would add credence to our view that top has been formed at 0.8125 earlier and extend this fall from there for retracement of recent rise to previous resistance at 0.7712, break there would bring further fall towards 0.7640-50 but oversold condition should limit downside and reckon support at 0.7570 would hold.
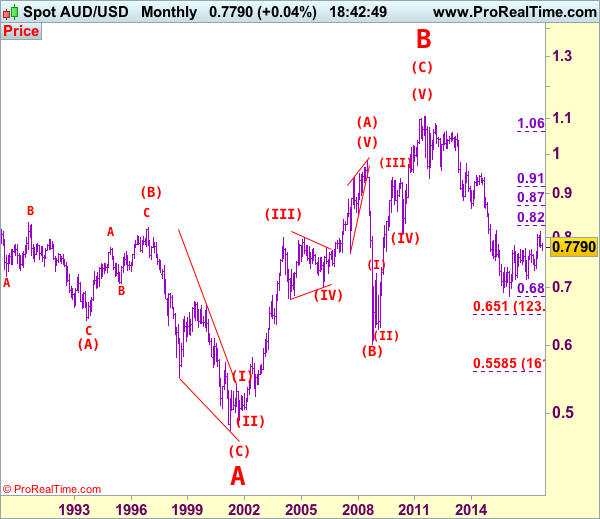
We are keeping our count that top has been formed at 1.1081 (wave 5 of V) and major correction (A-B-C-X-A-B-C) has commenced, indicated downside targets at 0.7945 (61.8% Fibonacci retracement of entire rise from 0.6007-1.1081) and 0.7750 had been met and downside bias is seen for further weakness to 0.6800, then 0.6700 but reckon 0.6500 would hold from here.
Our preferred count is that the rally from 0.6007 to 0.7270 (7 Jan 2009) is marked as wave A, the retreat to 0.6248 (2 Feb 2009) is wave B and the subsequent upmove is labeled as wave C with wave (iii) and wave (iv) ended at 0.8265 and 0.7700 respectively and wave (v) as well as 3 ended at 0.9407, then wave 4 ended at 0.8066 (instead of 0.8578). The wave 5 has met our indicated projection target of 1.1060 and could ended at 1.1081, this level is now treated as the peak of wave (C) as well as larger degree wave B, hence major fall in wave C has commenced, our initial downside target at psychological support at 0.7000 has just been met and further weakness to 0.6500 would be seen later.
On the upside, expect recovery to be limited to 0.7855-60 and said resistance at 0.7897 should remain intact, bring another decline later to aforesaid downside targets. Above previous support at 0.7908 would suggest first leg of decline from 0.8125 has ended instead, bring a stronger rebound to 0.7940-50 but upside should be limited to 0.8020 and bring another decline later. A daily close above 0.8020 would risk test of 0.8080 but only break of resistance at 0.8103 would signal correction from 0.8125 has ended, bring retest of this level first.
Recommendation: Hold short entered at 0.7870 for 0.7670 with stop above 0.7900.
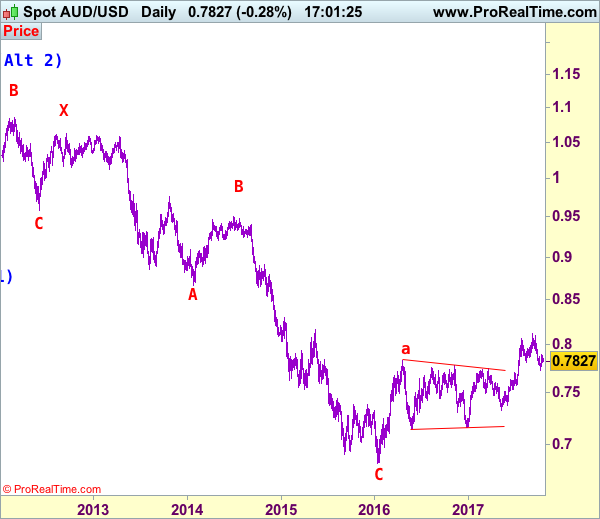
Our alternate count on the daily chart treated the top formed in 2008 at 0.9851 could be a larger degree wave I and was followed by a deep and sharp correction in wave II to 0.6007 and wave III is unfolding from there.
The long-term uptrend started from 0.4775 (2 Apr 2001) with an impulsive structure. Wave I is labeled as 0.4775 to 0.9851 (15 Jul 2008), wave II has ended at 0.6007 (Oct 2008) and wave III is still in progress which may extend further gain to 1.1265.
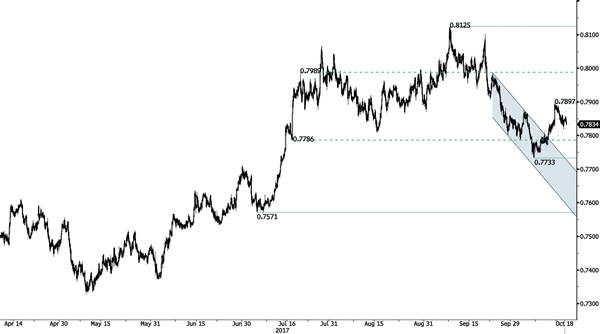
AUD/USD The Declining Channel Favors A Bearish Bias
AUD/USD bullish pressure has faded suggesting further downside risk. Hourly resistance is given at 0.7897 (13/10/2017 high). Support lies at at 0.7733 (06/10/2017 low). Expected to show continued consolidation.
In the long-term, the trend is turning positive. Key supports stands at 0.6009 (31/10/2008 low) . A break of the key resistance at 0.8164 (14/05/2015 high) is needed to invalidate our long-term bearish view.
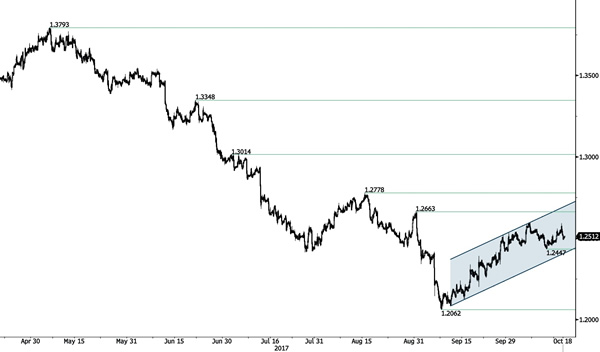
USD/CAD Drifting Higher In Channel
USD/CAD continues to bounce within uptrend channel. Strong support is located at a distance at 1.2062 (08/09/2017 low). Hourly support lies at 1.2331 (26/09/2017 high). Resistance is given at 1.2663 (31/08/2017 high). Expected to show continued short-term bullish pressures within uptrend channel.
In the longer term, the pair has broken longterm support that can be found at 1.2461 (16/03/2015 low). Strong resistance is given at 1.4690 (22/01/2016 high). The pair is likely to head further lower.