Sample Category Title
US Markets Steady Ahead of FOMC Minutes Release
- Further clarity of US interest rates unlikely;
- Rajoy requests clarity on Catalan independence declaration.
US equity markets are expected to open relatively flat, a day after having made fresh record highs once again, as traders await the release of the FOMC minutes from the September meeting.
The dollar is also steady ahead of the release of the minutes later on in the day, with traders seeking further clarity on interest rates going forward. The Fed surprised traders last month when it projected one more rate hike this year and three next, despite the fact that inflation has not recovered as expected despite the apparent tightness in the labour market. Still, policy makers since the meeting haven't given the impression that they are particularly confident when it comes to these interest rate projections which is creating doubt around them.
I'm not convinced the minutes will provide much additional detail on interest rates and will instead simply reiterate what we learned in the statement, economic projections and press conference with Chair Janet Yellen. Moreover, with vice Chair Stanley Fischer having now left the FOMC and Yellen's tenure as Chair expiring in February, we have to question just how useful they could be in anticipating the Fed's moves next year. A December rate hike now appears very likely – and is 98.6% priced in according to CME Group – but beyond that, a significant amount of uncertainty remains.
Relations between Catalonia and Madrid are showing no signs of improvement after Spanish Prime Minister Mariano Rajoy responded to Carles Puigdemont's request for talks by releasing a statement formally asking whether independence had been declared or not. Clearly talks is not on the agenda for the Spanish government, with Rajoy claiming that a declaration of independence is needed before any other measure can be taken under article 155 of the constitution.
With a peaceful resolution clearly not on the table it seems Puigdemont's options now are limited and these comments will only fuel the desire for independence to be officially declared, after which the situation will likely deteriorate rapidly. Still, the IBEX has given away very little of its early session gains and remains around 1.5% up on the day while the euro is behaving like nothing has happened, although this has broadly been the case throughout the entire process.
EURJPY Lacks Direction, Maintains Range But Near-Term Risk Tilted To Upside
EURJPY maintains a neutral short-term bias and has been trading in a range late September. The consolidation phase is expected to continue due to the lack of clear direction in the market.
Looking at the 4-hour chart, the recent uptick in RSI indicates the easing in downside pressure as EURJPY moved to the upper end of the range with resistance at 133. A break above this level would improve the odds for an extension to 134.40, a level not seen since November 2015.
A rejection at 133 would shift the focus back to the downside to target the bottom of the range at 131.80. Breaking to the downside of the range would see prices target the September 15 low of 130.60 ahead of the next major low at 129.36.
The broader bias is neutral and this is highlighted by the Ichimoku cloud moving sideways. But near-term risks are tilted to the upside, as suggested by the Tenkan-sen line rising above the Kijun-sen line.
A daily close for EURJPY near the top of the range would help strengthen upside momentum and put an end to the corrective move of the longer-term uptrend that started in April.
European Markets, US Futures & Euro Soar After Catalonian Independence Deferred
Investors have shown a positive reaction to the Catalonian leaders’ action
Catalonian situation isn’t going away, it is only delayed
The bitcoin price broke the $4900 mark yesterday
oday's FOMC minutes would provide us more detail about the Fed's stance towards its monetary policy
European markets and US futures are higher after Catalonian leaders hesitated to implement independence. Looking at the Euro, you would say that investors have shown a positive reaction to the Catalonian leaders’ action, especially the IBEX index which is exploding today. Catalan President Carles Puigdement did declare the independence yesterday but shortly after, he postponed the implementation. Perhaps, hoping for some sort of dialogue with Spain before it gets really ugly. The risk appetite has found its place among investors and they are less worried about this political drama or perhaps completely naive.
If the Catalonian President thinks that the referendum and its outcome were all legal, despite the fact that the country's biggest court decorated it illegal,, then you should not underestimate the power of such a President. Some form of meditation is expected or let's just say hoped for before the situation catches fire. Who blinks first would keep investors on their toes. The European Union preferred to stay out of this situation because they do consider this as a personal choice and a personal matter for the country.
The important thing to keep in mind is that the Catalonian situation isn’t going away, it is only delayed. Therefore, we do think there is clearly a big disconnect between the markets and the political storm which is taking place in Catalonia. Taking a clue from the Dow index, after it smashed through the previous record high, would give you a very misleading signal. Investors are simply confused or naive to the Catalonian situation.
The bitcoin price broke the $4900 mark yesterday and traded very close to its previous record highs because of Catalonians declaring a deferred implementation of independence is not a small event. The price has retraced from that level and bitcoin is down by -1.77% as the risk appetite builds. We do believe that investors are surely underestimating the strength of this event. The reason is that the independence is declared and only implementation is postponed. We do believe that investors are surely underestimating the strength of this event. The reason is that the independence is declared and only implementation is postponed.
Remember, if the independence becomes the reality, not only Spain would have to suffer a major debt crisis but recovery in the Eurozone would also be under a major threat. You can simply forget that the ECB would be stepping off the gas, the bank would have a brand new unexpected crisis on its door front.
The Fed last month announced their plan of reducing the size of their balance sheet with the runoff rats of $6 billion per month for US Treasury and $4 billion per month for the mortgage-backed securities. Today's FOMC minutes would provide us more detail about the Fed's stance towards its monetary policy given that the inflation hasn't improved. The dollar index lost it’s mojo as President Trump’s tax plan became cloudier yesterday following his feud with Senator Mr. Corker. What this shows is that the President is so ineffective that he can’t even convince his own party leaders. Without the proposed tax plan, there is little that the Fed can do to push the GDP growth. The President has failed on so many of his key plans that another failure on the tax overhaul could be the final nail in the coffin.
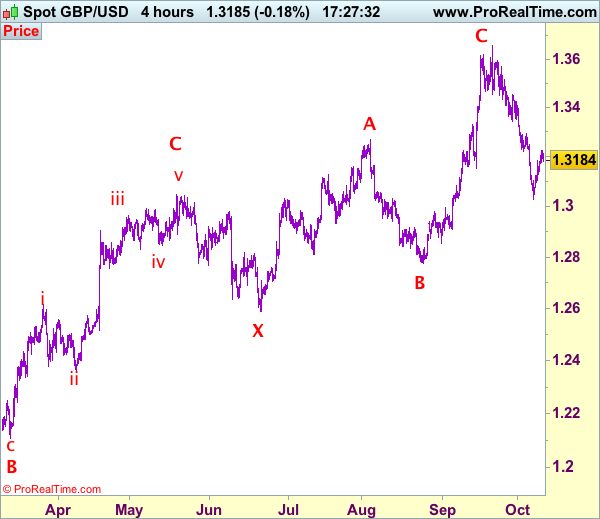
Trade Idea: GBP/USD – Sell at 1.3280
GBP/USD – 1.3187
Original strategy :
Sell at 1.3250, Target:1.3050, Stop: 1.3310
Position: -
Target: -
Stop: -
New strategy :
Sell at 1.3280, Target:1.3080, Stop: 1.3340
Position: -
Target: -
Stop:-
Although cable has eased from 1.3226, the rebound from 1.3027 (last week’s low) cable has edged higher again today, suggesting near term upside risk remains for the rebound from 1.3027 (last week’s low) to bring retracement of recent decline, hence gain to 1.3220-25 cannot be ruled out, however, reckon 1.3275-80 would limit upside and price should falter well below resistance at 1.3292, bring another decline later. Below 1.3125-30 would suggest the rebound from 1.3027 has ended and bring weakness to 1.3075, then retest of said support at 1.3027, break there would confirm the fall from 1.3658 top is still in progress, bring test of psychological support at 1.3000, then towards 1.2970 but reckon 1.2950 would hold on first testing due to loss of momentum.
In view of this, we are still looking to sell cable on further subsequent recovery as 1.3275-80 should limit upside, bring another decline later. Above resistance at 1.3292 would abort and signal low has been formed instead, bring at least a correction of the fall from 1.3658 top to another previous support at 1.3343. Our preferred count is that (pls see the attached chart) the wave IV is unfolding as a complex double three (ABC-X-ABC) correction with 2nd wave B ended at 1.2774, hence 2nd wave C could have ended at 1.3658.
Our preferred count on the daily chart is that cable's rebound from 1.3500 (wave (A) trough) is unfolding as a wave (B) with A ended at 1.7043, followed by triangle wave B and wave C as well as wave (B) has ended at 1.7192, the subsequent selloff is the larger degree wave (C) which is still unfolding with minor wave (III) of larger degree wave 3 ended at 1.1986, hence wave (IV) correction is in progress which could either be a triangle wave (IV) of a complex formation but upside should be limited to 1.3500 and price should falter well below 1.4000, bring another decline in wave (V) of 3 for weakness to 1.1500, then 1.1200.
DAX Unchanged As Catalonia Suspends Independence Proclamation
The DAX is showing little movement in the Wednesday session. Currently, the index is at 12,953.00, up 0.03% on the day. There are no eurozone or German indicators on the schedule, but the markets will be busy digesting events in Catalonia.
All eyes were on Catalonia on Tuesday, as President Carles Puigdemont addressed the Catalan parliament. Puigdemont and other regional lawmakers signed a proclamation of “full sovereignty” for Catalonia, but the Catalan leader immediately qualified the move, saying that no formal steps would be taken before talks were held with the Spanish government. The Catalan leader was under huge pressure not to make any irreversible moves, as Madrid warned it would not tolerate any unilateral moves, and the European Union also urged dialogue between the parties. Investors are relieved that Puigdemont has suspended independence for now, but the crisis is by no means over. The Spanish government continues its hard line towards any attempt at secession by Catalonia, saying it refuses to discuss the issue. Although Catalan leaders say they have a mandate for independence based on the referendum (in which 90% voted for independence), Catalans are deeply divided over the issue. Several banks and major companies have announced they will move their legal headquarters from Barcelona to Madrid, and the constitutional crisis could take a toll on the Spanish economy if the stalemate continues. The EU has said that Catalonia’s drive for independence is a domestic Spanish issue, and so far the euro and German stock markets have not been affected by the crisis.
Germany’s economy has performed well in 2017, and third quarter numbers continue to point upwards. There was positive news on Tuesday, as the trade surplus hit a 12-month high. Manufacturing numbers have impressed, as Industrial Production surged 2.7%, the second-highest gain in 2017. Last week, Factory Orders gained 3.6%, its best performance since December 2016. Strong global demand for German goods, in particular automobiles, has been a boon for German industrial and manufacturing output. September PMIs were also solid, as the services and manufacturing sectors continue to show expansion. It could be smooth sailing for the robust Germany economy, with projections that the economy will expand 1.9% in 2017 and 2.0% in 2018. Later on Wednesday, the German government will release its forecast for GDP growth, as well as employment and inflation forecasts.
Euro Steady As Catalonia Suspends Declaration Of Independence
The euro has ticked higher on Wednesday. Currently, EUR/USD is trading at 1.1837, up 0.07% on the day. There are no Eurozone events on the schedule. The US will release JOLTS Job Openings, which is expected to ease slightly to 6.13 million. Today’s highlight is the Federal Reserve minutes from the September policy meeting.
After much anticipation and tension, Catalan President Carles Puigdemont declared independence – sort of. Puigdemont did make a symbolic declaration, but immediately said that that no formal steps would be taken before giving a chance to negotiations with the Spanish government. The Catalan leader was under huge pressure not to make any irreversible moves, as Madrid warned it would not tolerate any unilateral moves, and the European Union also urged dialogue between the parties. Global stock markets rose after the news, and the euro has posted slight gains, as investors are clearly relieved. However, the crisis is by no means over, as the Spanish government continues its hard line towards any attempt at secession by Catalonia. Although Catalan leaders say they have a mandate for independence based on the referendum (in which 90% voted for independence), Catalans are deeply divided over the issue. Several banks and major companies have announced they will move their legal headquarters from Barcelona to Madrid, and the constitutional crisis could take a toll on the Spanish economy if the stalemate continues.
The Federal Reserve will release its minutes from the September meeting. As expected, the Fed did not raise interest rates, but did announce it would begin trimming its $4.2 billion balance sheet in October. This is seen as a vote of confidence in the US economy, which continues to show strong growth. At time of the September meeting, the odds of December rate hike were pegged around 50 percent. However, the odds have now surged to 91 percent. The primary reason for the huge shift in market sentiment can be attributed to Fed policymakers coming out in support of a rate hike, notably Fed Chair Janet Yellen. The lack of inflation remains the most significant impediment to raising rates, but Yellen and other FOMC members have insisted that strong economic conditions will lead to higher inflation levels. Even if inflation does not move higher before 2018, the Fed now appears ready to press the rate trigger.
Technical Outlook: SPOT GOLD – Bulls May Stay On Hold Before FOMC Minutes
Spot Gold holds positive tone on Wednesday but stays under Tuesday’s spike high at $1294, where three-day recovery rally was rejected at Fibo 61.8% of $1313/$1260 downleg / falling 20SMA.
The yellow metal benefited from weaker dollar and safe-haven buying in past couple of days. The price action today may stay on hold until release of FOMC last policy meeting minutes, which are expected to generate fresh direction signal.
Hawkish remarks from Fed’s September meeting would further boost expectations that the Fed will raise rates in December and put gold price under pressure.
Such scenario would trigger fresh weakness and pressure broken 10SMA ($1278) and 100SMA (1273) and turn near-term focus lower.
Softer tone from Fed would risk fresh advance through $1297 (Fibo 38.2% of $1357/$1260 descend) and daily cloud top ($1304).
Res: 1291, 1293, 1297, 1300
Sup: 1286, 1282, 1278, 1273
Elliott Wave Analysis: EURUSD Update
EURUSD is trading nicely bullish for the last couple of trading days and that is why we believe a new higher degree impulsive leg may be in progress. We see waves: one, two, three and now four finished, so the last one that can follow can be blue wave five. We see the former wave four completed at near the 1.1793 level, from where a new push higher followed recently, labeled as minor wave i). Ideally bulls will take price much higher in sessions to follow, hopefully towards the Fibonacci ratio of 61.8 and 1.18700 zone.
EURUSD, 1H
Technical Outlook: WTI OIL Extends Recovery Above $51 On Strong Bullish Sentiment
WTI Oil maintains firm tone for the third day and establishes above $51.00 per barrel. Oil price was up 3.07% on strong rally on Tuesday (the biggest one-day rally since 25 Sep) and closed well above psychological $50.00 barrier.
Strong bullish sentiment on signs that oil market is rebalancing after years of oversupply, inflated oil prices.
Fresh extension higher on Wednesday eyes pivotal barrier at $51.41 (Fibo 61.8% of $52.84/$49.09 pullback) close above which would generate bullish signal for further upside after higher low has been formed at $49.09 (06 Oct low).
Rally may extend to $51.96 (Fibo 76.4%) with final stretch towards $52.84 (28 Sep peak) also being in play.
Broken 20SMA ($50.67) is expected to keep the downside protected.
Focus is on API crude inventories report, due later today and EIA weekly crude stocks report tomorrow, which are expected to show further draw in oil inventories which would offer fresh support to oil prices.
Reports have been delayed one day due to US market holiday last Monday.
Res: 51.41, 51.96, 52.41, 52.84
Sup: 51.00, 50.85, 50.67, 50.52
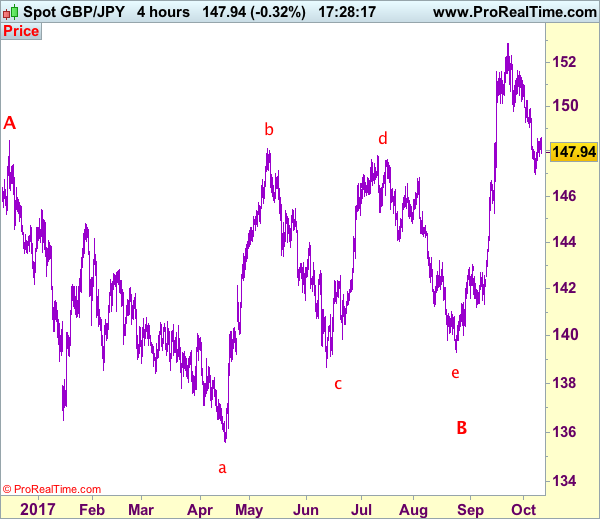
Trade Idea: GBP/JPY – Stand aside
GBP/JPY - 148.05
New strategy :
Stand aside
Position: -
Target: -
Stop:-
As sterling recovered after falling to 146.95 earlier this week, suggesting further consolidation above this level would be seen and although corrective bounce to 148.60 cannot be ruled out, reckon previous support at 149.00-05 would limit upside and price should falter well below 149.90-00 and bring another decline later.
On the downside, below 147.30-35 would bring retest of 146.95 but break there is needed to signal the fall from 152.85 top is still in progress for retracement of recent upmove to 146.60-65 and then 146.00, having said that, loss of momentum should limit downside and previous support at 145.25 should remain intact.
Our preferred count is that larger degree wave V with circle is unfolding from 251.12 with wave (I) 219.34, (II): 241.38 and wave (III) is subdivided into 1: 192.60, 2: 215.89 (23 Jul 2008) and wave 3 ended at 118.87 earlier in 2009. The correction from there to 162.60 is wave 4 which itself is a double three and is labeled as first a-b-c ended at 151.53, followed by wave x at 139.03, 2nd a ended at 162.60, 2nd b at 146.75 and 2nd c leg of wave 4 ended at 163.00. Therefore, the decline from 163.00 to 116.85 is now treated as wave 5 which also marked the end of larger degree wave (III), hence wave (IV) major correction has commenced for retracement of the wave (III) from 241.38 and upside target at 183.95-00 (50% Fibonacci retracement of the wave (II) from 241.38) had been met, a drop below 160.00 would suggest wave (IV) has ended at 195.85, bring decline in wave (V) for initial weakness to 130 (already met) and 120.