Sample Category Title
Elliott Wave Analysis: Triangle on DAX Pointing Higher
Good afternoon traders! Let's start the US sessions with German dax and its intra-day pattern.
On German dax, we see price trading at the end of a corrective wave four. This corrective wave looks more and more like a triangle correction. A triangle correction is an Elliott wave pattern, that unfolds prior to the final wave, meaning once fully unfolded a new and final push into the direction of the trend may follow. In our case this is to the upside. That said, a triangle pattern consist out of five waves and usually each of them have three minor legs. Once the upper swing high of sub-wave b at 12996 level gets breached, that is when corrective wave 4 will be acknowledged as completed and more upside will be in store for the DAX.
German DAX, 1H
Trade Idea: USD/CAD – Buy at 1.2415
USD/CAD - 1.2509
Trend: Down
Original strategy :
Buy at 1.2415, Target: 1.2600, Stop: 1.2355
Position: -
Target: -
Stop: -
New strategy :
Buy at 1.2415, Target: 1.2600, Stop: 1.2355
Position: -
Target: -
Stop:-
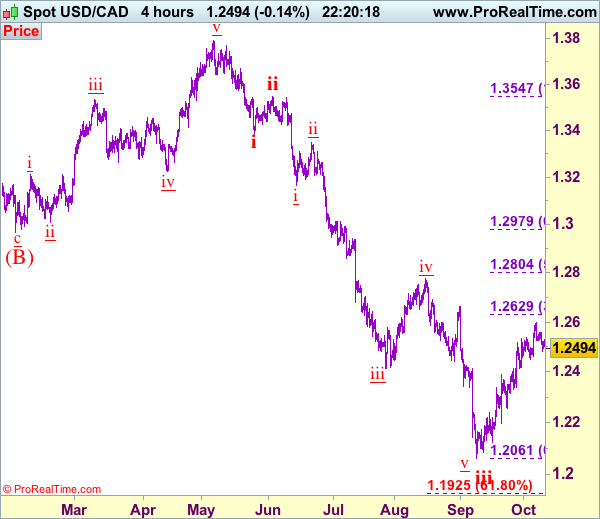
Although the greenback retreated after rising to 1.2599 late last week and consolidation below this level would be seen, reckon pullback would be limited to 1.2445-50 and previous support at 1.2415 would hold, bring another rise later, above 1.2555-60 would signal the pullback from 1.2599 has ended, bring retest of this level, break there would extend the rise from 1.2061 low (wave iii trough) towards previous resistance at 1.2663 but overbought condition should limit upside to 1.2700 and price should falter well below another previous resistance at 1.2778.
In view of this, would not chase this rise here and would be prudent to buy again on pullback as 1.2410-15 should limit downside. Below 1.2395-00 would bring correction back to 1.2350-55 but reckon indicated support at 1.2313 would hold. Only a drop below 1.2313 would abort and signal the aforesaid rise from 1.2061 has ended, bring further fall to 1.2254 support, however, reckon downside would be limited to another previous support at 1.2197, bring rebound later. We are keeping our count that wave v as well as wave (C) ended at 1.3794 and impulsive wave (i ii, i ii) is now unfolding with minor wave iii ended at 1.2414, followed by wave iv correction ended at 1.2778, wave v has reached our indicated downside target at 1.2100 and may extend to 1.2000.
To recap, wave B from 1.3066 is unfolding as an a-b-c and is sub-divided as a: 1.2192, b: 1.2716 and wave c is a 5-waver with i: 1.1983, ii: 1.2506, extended wave iii with minor iii at 1.0206, wave iv ended at 1.0781 and wave v as well as wave iii has ended at 0.9931, hence the subsequent choppy trading is the wave iv which is unfolding as (a)-(b)-(c) with (a) leg of iv ended at 1.0854, followed by (b) leg at 1.0108 and (c) leg as well as the wave iv ended at 1.0674. The wave v is sub-divided by minor wave (i): 0.9980, (ii): 1.0374, (iii): 0.9446, (iv): 0.9913 and (v) as well as v has possibly ended at 0.9407, therefore, consolidation with upside bias is seen for major correction, indicated target at 1.3700 and 1.4000 had been met and further gain to 1.4700 would be seen later.
Dollar in the Defensive. Euro Ignores Catalan Tensions
- European equities traded listless near opening levels with Spain outperforming. US equities open little changed.
- Spain's prime minister has opened the way for Madrid to use a constitutional "nuclear option" to suspend Catalonia's autonomy, demanding that the regional government makes clear whether it considers itself independent.
- UK Chancellor of the Exchequer Hammond said he will start releasing more money to help prepare for a "no deal" Brexit if there aren't clear signs of progress in talks with the European Union by early 2018.
- Chicago Fed Evans says he's a little nervous that unless inflation expectations start to move up in a way consistent with the Fed's target, the next couple of moves could not be constructive.
- Dallas Fed Kaplan said he wants to see more signs of upward inflation before raising interest rates again, but that low long-term borrowing costs may limit how far and fast rates can be raised.
- Contentious new US demands are set to hit NAFTA negotiating tables, threatening to push modernization talks toward collapse as Canadian Prime Minister Justin Trudeau again tries to remind U.S. President Donald Trump of the trade pact's merits.
- Several hundred supporters of Italy's 5-Star Movement chanted slogans and waved flags in front of parliament to protest an electoral law that is likely to penalise the maverick party ahead of next year's national election.
- The EC proposed softer measures to strengthen the EU banking sector against future crises, after two years of fruitless talks. The watered-down proposals are designed to win over Germany. But they could create frictions with the ECB over the pace of reduction of banks' exposure to bad loans.
- Opec expects stronger demand for its crude oil next year due to stronger consumption growth and lower estimates for supply from outside the cartel, as WTI prices near $50 a barrel boost driving and crimp output.
Rates
US Treasuries outperform Bunds
Global core bonds parted ways today with US Treasuries (higher) outperforming German Bunds (flat). Trump's administration made specific proposals to weaken NAFTA while two voting FOMC governors (Chicago Fed Evans and Dallas Fed Kaplan) sounded dovish on inflation, questioning a December rate hike. The Bund initially lost some ground as Spanish assets opened strong following Catalan President Puidgemont's speech, but the move never went far. Intraday, Spanish gains were partly reversed after PM Rajoy put the ball back in the Catalan camp after an emergency cabinet meeting. They issued a formal request to the Catalan government in Barcelona for confirmation of whether it has declared independence, amid "confusion created deliberately." A confirmation from Catalanya could cause Madrid to trigger article 155, stripping the region from its autonomy.
At the time of writing, the US yield curve bull flattens with yields 0.4 bps (2-yr) to 2.6 bps (30-yr) lower. The German yield curve bear steepens with yields 0.6 bps (2-yr) to 1.5 bps (30-yr) higher. On intra-EMU bond markets, 10-yr yield spread changes versus Germany are nearly unchanged with Spain (-3 bps) and Portugal (-4 bps, supply-related see below) outperforming and Italy (+4 bps, see headlines + upcoming supply) underperforming.
The Dutch debt agency launched a new 7-yr DSL (0% Jan2024) via Dutch direct auction. They raised €6.57B at 12 bps above the German DBR 1.75% Feb2024. The raised amount was near the upper end of the €5-7B target. The Portuguese Treasury successfully tapped two OT's for a combined €1.25B (€0.5B 2.2% Oct2022 & €0.75B 4.125% Apr2027). The auction bid/coverr was a strong 2.23. Auction yields declined significantly from previous taps thanks to S&P's rating upgrade to investment grade. The German Finanzagentur raised €3B via tapping the on the run Bobl (0% Oct2022). Total bids amounted to €4.52B, above the €3.83B at the previous 4 Bobl auctions and resulting in an official bid cover of 1.9. The Bundesbank set aside €0.61B for secondary market operations (real bid cover 1.5). The auction had no tale. The US Treasury starts its mid-month refinancing operation later today with a $24B 3-yr Note auction and a $20B 10-yr Note auction. The WI's currently trade around 1.65% and 2.34% respectively.
Currencies
Dollar in the defensive. Euro ignores Catalan tensions
The political developments in Catalonia dominated the news headlines, but had little impact on the markets outside Spain. EUR/USD extended the gradual rebound from past days, but this move also mirrored ongoing USD softness. USD/JPY also drifted back south in the 112 big figure as the US currency didn't receive any additional interest rate support.
Overnight, most Asian equities continued their uptrend with several indices nearing multi-year or even all-time record levels (Kospi), even as the positive momentum slowed later in the session. The dollar stabilized after the recent decline, but without an indication of a real comeback. Political bickering within the Trump administration raised questions on the ability to execute the tax reform plans. EUR/USD traded in the 1.1815 area. USD/JPY is little changed at 112.50.
The decision of the Catalan government to delay the declaration of independence had very little impact on the markets outside Spain. Spanish 10-year yield spreads narrowed 4-5bp and Spanish equities rebounded about 1.5%. Core European yields were little changed. EUR/USD extended the rebound from past days and touched the 1.1845 area. The relative calm in Spain was maybe a slight supportive. However, the move also mirrored USD softens. USD/JPY traded with a slight intraday negative bias.
At noon, Spanish PM Rajoy asked the Catalan government whether it has declared independence. If so, the central government could implement article 155 of the constitution and take over the powers from the regional government. Still, there was hardly any market reaction. EUR/USD stabilized around 1.1825.
There were no important data in the US. Despite uncertainty on Spain, the dollar was more in the defensive than the euro. We didn't see a specific reason. The positive USD momentum of last week has clearly worked out and there is no other additional good news to support further USD gains. Fed's Evens said he worried on low inflation and is in no hurry to raise rates right now. Friday's CPI and retail sales might be the next important data to trigger a directional USD move. If anything, the US/German interest rate differential narrows marginally. EUR/USD trades in the 1.1845 area. USD/JPY is drifting back south to the 112 area. Later this evening, FX traders will keep an eye at the minutes of the September Fed meeting.
Sterling still captured in technical trading
There were no important eco data in the UK. Sterling initially traded with a modest negative bias, especially against the euro . UK Chancellor of the Exchequer Hammond said he is considering to release more money to prepare for a 'No deal Brexit' scenario if there aren't clear signs of progress by early 2018. There was no reaction of sterling to the Hammond comments. However, they illustrate that the clock is ticking for the UK and that UK companies desperately need progress and clarity on the Brexit process. EUR/GBP trades in the 0.8970/75 area, nearing the recent correction top. Sterling also lost slightly marginal ground against a weakish dollar. Cable trades in the 1.3200 area.
Trade Idea Update: USD/CHF – Sell at 0.9760
USD/CHF - 0.9720
Original strategy :
Sell at 0.9780, Target: 0.9680, Stop: 0.9815
Position : -
Target : -
Stop : -
New strategy :
Sell at 0.9760, Target: 0.9660, Stop: 0.9795
Position : -
Target : -
Stop : -
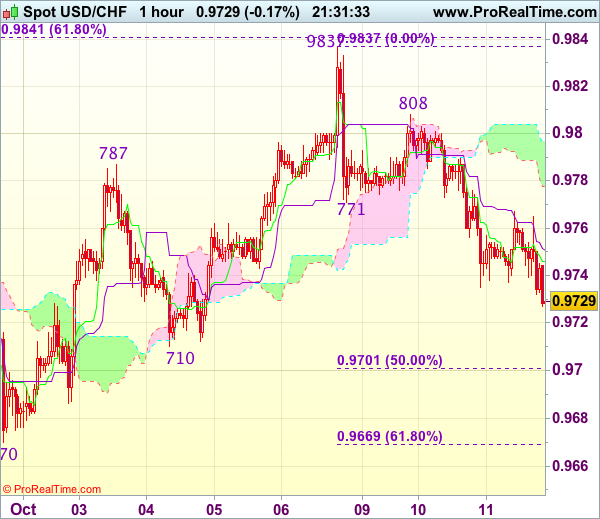
As the greenback has remained under pressure, adding credence to our view that top has possibly been formed at 0.9837 last week and consolidation with mild downside bias is seen for weakness to previous support at 0.9710, however, break there is needed to retain bearishness for further decline towards 0.9669-70 (61.8% Fibonacci retracement of 0.9565-0.9837 and previous support) which is likely to hold on first testing.
In view of this, would not chase this fall here and we are looking to sell dollar on recovery as previous support at 0.9771 should turn into resistance and limit upside. Only break of resistance at 0.9808 would signal an intra-day low is formed and indicate the pullback from 0.9837 has ended, bring retest of this level later.
Trade Idea Update: GBP/USD – Stand aside
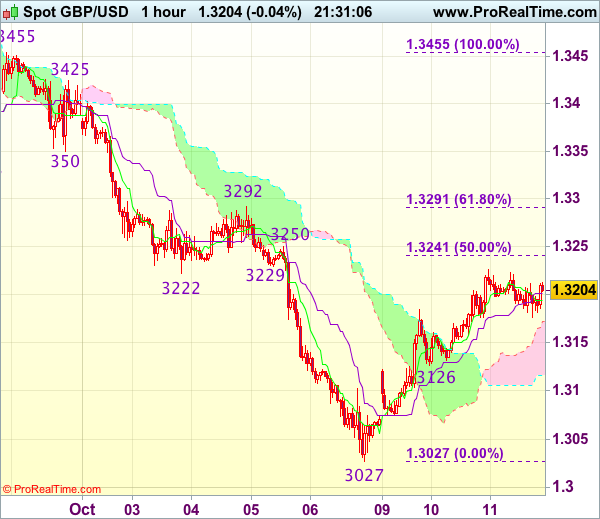
GBP/USD - 1.3211
New strategy :
Stand aside
Position : -
Target : -
Stop : -
As cable has eased after faltering below resistance at 1.3226 (yesterday’s high), suggesting consolidation below this level would be seen and pullback to the upper Kumo (now at 1.3146) cannot be ruled out, however, break of support at 1.3126 is needed to signal the rebound from 1.3027 (last week’s low) has ended, bring weakness towards 1.3070-75 first.
On the upside, above said resistance at 1.3226 would extend the corrective rise from 1.3027 to 1.3240-50 (50% Fibonacci retracement of 1.3455-1.3027 and previous resistance), however, further sharp move beyond 1.3270 should not be repeated and price should falter below 1.3291-92 (61.8% Fibonacci retracement and previous resistance), bring retreat later. As near term outlook is mixed, would be prudent to stand aside for now.
Trade Idea Update: EUR/USD – Buy at 1.1780
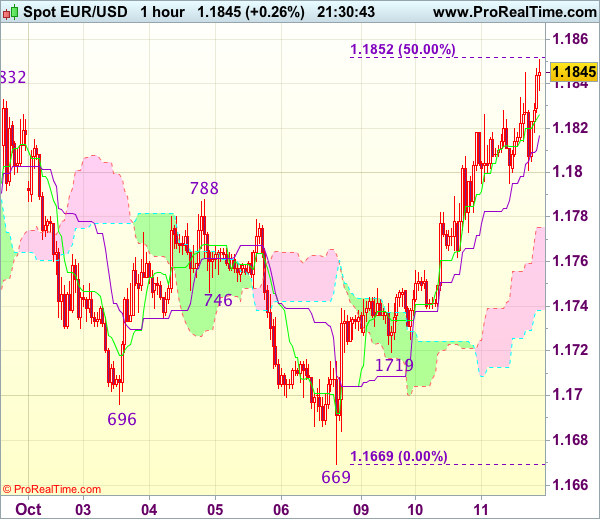
EUR/USD - 1.1850
Original strategy :
Buy at 1.1765, Target: 1.1865, Stop: 1.1730
Position : -
Target : -
Stop : -
New strategy :
Buy at 1.1780, Target: 1.1880, Stop: 1.1745
Position : -
Target : -
Stop : -
As the single currency has risen again today, adding credence to our view that the rise from 1.1669 temporary low (formed last week) is still in progress and mild upside bias remains for this move to bring retracement of recent decline to 1.1861-62, however, reckon upside would be limited to 1.1895-00 (61.8% Fibonacci retracement of 1.2035-1.1669) and bring retreat later.
In view of this, would not chase this rise here and we are still looking to buy euro on subsequent pullback as 1.1780-85 should limit downside and bring another rebound. Below 1.1745-50 would defer but only break of indicated support at 1.1719 would abort and signal top is formed, risk weakness to 1.1695-00 first.
USDCHF Pressures Further Downside On Correction Weakness
USDCHF: With the pair selling off on Tuesday and seen following through lower on Wednesday, more weakness is envisaged in the days ahead. On the downside, support lies at the 0.9700 level. A turn below here will open the door for more weakness towards the 0.9650 level and then the 0.9600 level. On the upside, resistance resides at the 0.9800 level where a break will clear the way for more strength to occur towards the 0.9850 level. Further out, resistance comes in at the 0.9900 level. Above here if seen will turn attention to 0.9950. All in all, USDCHF faces downside pressure on price weakness
Trade Idea Update: USD/JPY – Sell at 112.80
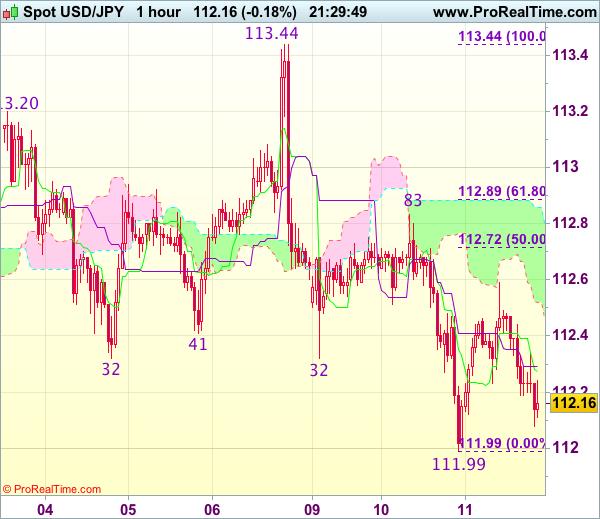
USD/JPY - 112.18
Original strategy :
Sell at 112.80, Target: 111.80, Stop: 113.15
Position : -
Target : -
Stop : -
New strategy :
Sell at 112.80, Target: 111.80, Stop: 113.15
Position : -
Target : -
Stop : -
Although dollar rebounded after falling to 111.99 yesterday and initial upside risk is for recovery to 112.70-75 (50% Fibonacci retracement of 113.44-111.99), reckon 112.83-89 (yesterday’s high and 61.8% Fibonacci retracement) would limit upside and bring another decline later, below said support at 111.99 would add credence to our view that top has been formed at 113.44 and extend weakness to 111.75-80, then towards 111.47 support but oversold condition would limit downside and reckon 111.11 support would remain intact.
In view of this, we are looking to sell dollar on recovery as 112.83 resistance should limit upside and bring another decline. A break of indicated level at 112.83-89 would abort and signal low is formed, bring a stronger rebound to 113.10-20 but price should falter well below said last week’s high at 113.44.
US Dollar Index – Near-term Action Remains in Red ahead of FOMC Minutes
Pullback from $94.08 peak (06 Oct recovery high) extends in the fourth day and hit key support at $92.90 (Fibo 38.2% of $90.97/$94.08 correction/base of thick ascending 4-hr cloud). Bears faced headwinds here and may pause recent acceleration lower as slow stochastic is entering oversold territory on daily chart. Daily studies are bullishly aligned and favor reversal at this point, as a plethora of supports, consisting of 55; 20 and 30 SMA's lay just below and underpins. The dollar is awaiting FOMC minutes later today for fresh signals, with hawkish stance which would further boost expectations for rate hike in December, expected to inflate the greenback and sideline risk of deeper pullback. Conversely, break below $92.90/50 support zone (which includes 55; 20; 30SMA's and daily cloud base) would signal further downside and expose supports at $92.16/00 (Fibo 61.8% of $90.97/$94.08/round-figure support.
Res: 93.17; 93.43; 93.82; 94.08
Sup: 92.79; 92.62; 92.52; 92.16
World Stock Index Has Much More Upside
The Hang Seng Stock Index is a free float, adjusted market capitalization, weighted stock Market Index in Hong Kong. The Index records and monitors daily changes of the largest companies of the Hong Kong Stock Market. It is the main indicator of the overall market performance in Hong Kong. These 50 constituent companies represent about 58% of the capitalization of the Hong Kong Stock Exchange. At Elliottwave-Forecast, we have been tracking the Index sequences together with the FTSE 100 (The Financial Times Stock Exchange 100 Index). FTSE 100 is the share Index of the 100 companies listed on the London Stock exchange with higher market capitalisation.
The Hang Seng Index and FTSE 100 both are showing the same sequences since the all-time lows and both are showing an incomplete sequence since the lows at 2008-2009 range. Today, the Market today can advance in 2 types of sequences. The first type is 5-9-13 or motive sequence and the second type is 3-7-11 or corrective sequence. Both the Hang Seng Index and the FTSE 100 advance in a corrective sequence and both have not reached the 100% from all-time low.
The Market by nature will always runs in one of the 2 sequences above. Both Hang Seng and FTSE 100 are showing the same outcome which is an extension to the upside within the cycle since 2008-2009 low. The charts below show the extension target in both indices, and the upside in both indices will drive the rest of the World Indices higher. This means that SPX 500 (The Standard & Poor's 500), which is the market capitalizations of the 500 large companies in the United States, has scope to rally into levels which not many people are expecting such as 3245 or even the 4000 levels.
The rally in SPX 500 from all-time low can become a 5 waves impulse if SPX 500 can break above 3245 before the Hang Seng and FTSE 100 reach the 100% from all time low and finish the blue sequence as charts below show. At the end of the day, the world indices are here to extend and contrary to many popular street opinion, they will remain a buy in the dips in all time frames until Hang Seng and FTSE 100 reach their target.
Hang Seng Stock Index Monthly and Weekly
The Hang Seng Index is showing 5 swings from 2008 lows, which should result in more upside within the blue sequence into the all time 100%. The invalidation for this view in daily degree is the blue 4 low (18278.80) while the invalidation in weekly degree is the black 4 low (10676.29).
FTSE 100 Stock Index
The Index took the 2000 peak, which suggests the bullish sequence from all-time lows is incomplete. In addition, we could also see 5 swing bullish sequence in blue degree from 2009 low, which favors more upside.
The following chart below shows that both Hang Seng and SPX 500 have the same trend