Sample Category Title
Trade Idea Wrap-up: USD/CHF – Stand aside
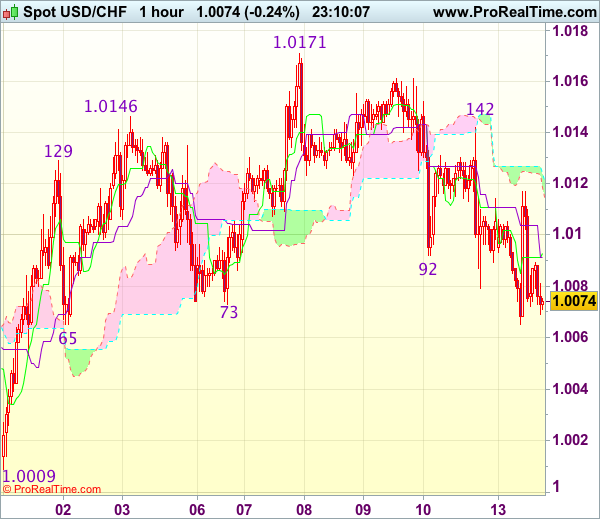
USD/CHF - 1.0072
Most recent candlesticks pattern : N/A
Trend : Sideways
Tenkan-Sen level : 1.0093
Kijun-Sen level : 1.0091
Ichimoku cloud top : 1.0124
Ichimoku cloud bottom : 1.0119
New strategy :
Stand aside
Position : -
Target : -
Stop : -
The greenback met renewed selling interest at 1.0114 earlier today and has dropped again, suggesting the erratic fall from 1.0171 top is still in progress, however, break of support at 1.0065 is needed to retain bearishness and signal recent erratic rise from 0.9861 has ended and bring further fall to 1.0035-40 but support at 1.0009 should remain intact, bring rebound later.
In view of this, would not chase this fall here and would be prudent to stand aside in the meantime. Above 1.0114 would bring test of indicated resistance at 1.0142 but break there is needed to signal low is formed instead, bring further gain towards last week’s high at 1.0171.
Trade Idea Wrap-up: GBP/USD – Hold long entered at 1.2215
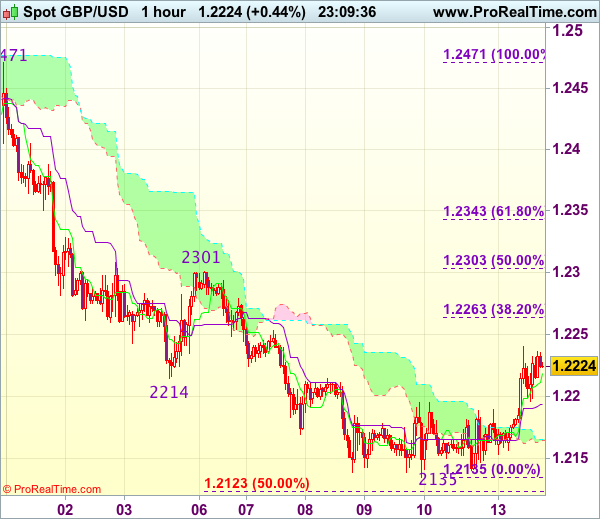
GBP/USD - 1.2225
Most recent candlesticks pattern : N/A
Trend : Near term down
Tenkan-Sen level : 1.2218
Kijun-Sen level : 1.2194
Ichimoku cloud top : 1.2165
Ichimoku cloud bottom : 1.2165
Original strategy :
Bought at 1.2215, Target: 1.2320, Stop: 1.2180
Position : - Long at 1.2215
Target : - 1.2320
Stop : - 1.,2180
New strategy :
Hold long entered at 1.2215, Target: 1.2320, Stop: 1.2180
Position : - Long at 1.2215
Target : - 1.2320
Stop : - 1.2180
Current rally above indicated resistance at 1.2195 suggests a temporary low is possibly formed at 1.2135 last week and consolidation with upside bias is seen for retracement of recent decline, hence further gain to 1.2260-65 (38.2% Fibonacci retracement of 1.2471-1.2135) would be seen, however, break of 1.2301-03 (previous resistance and 50% Fibonacci retracement) is needed to signal low is formed, bring a stronger rebound to 1.2340-45 (61.8% Fibonacci retracement) later.
In view of this, we are holding on to our long position entered at 1.2215. Below the Kijun-Sen (now at 1.2194) would defer and risk weakness to 1.2170 but said support at 1.2135 should hold. Only break there would abort and signal recent decline has resumed and extend weakness to 1.2100.
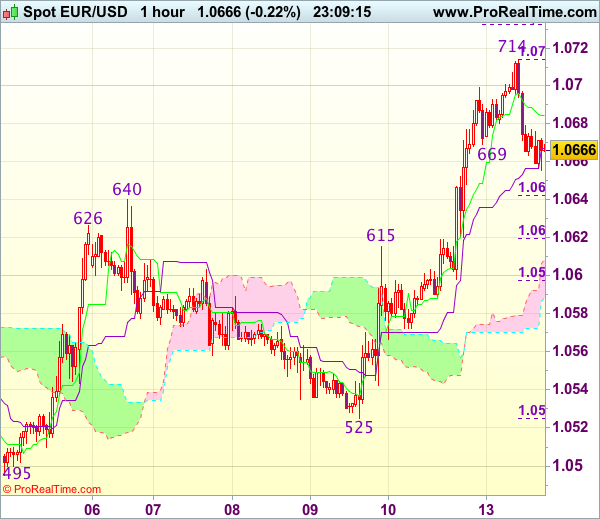
Trade Idea Wrap-up: EUR/USD – Buy at 1.0640
EUR/USD - 1.0668
Most recent candlesticks pattern : N/A
Trend : Near term up
Tenkan-Sen level : 1.0685
Kijun-Sen level : 1.0667
Ichimoku cloud top : 1.0609
Ichimoku cloud bottom : 1.0589
Original strategy :
Buy at 1.0640, Target: 1.0740, Stop: 1.0610
Position : -
Target : -
Stop : -
New strategy :
Buy at 1.0640, Target: 1.0740, Stop: 1.0610
Position : -
Target : -
Stop : -
As the single currency has retreated after rising to 1.0714 earlier today, suggesting consolidation below this level would be seen and pullback to 1.0640 (previous resistance now support) cannot be ruled out, however, reckon downside would be limited and bring another rise later, above 1.0714 would signal the erratic rise from 1.0493 low is still in progress and may extend gain to 1.0740-45 (1.5 times projection of 1.0495-1.0640 measuring from 1.0525) but loss of near term upward momentum should prevent sharp move beyond 1.0760 (1.618 times projection of 1.0495-1.0640 measuring from 1.0525).
In view of this, we are looking to buy euro on further pullback as 1.0540 should limit downside, bring another rise later. Below another previous resistance at 1.0615 would abort and signal top has been formed, risk further fall to 1.0575-80 first.
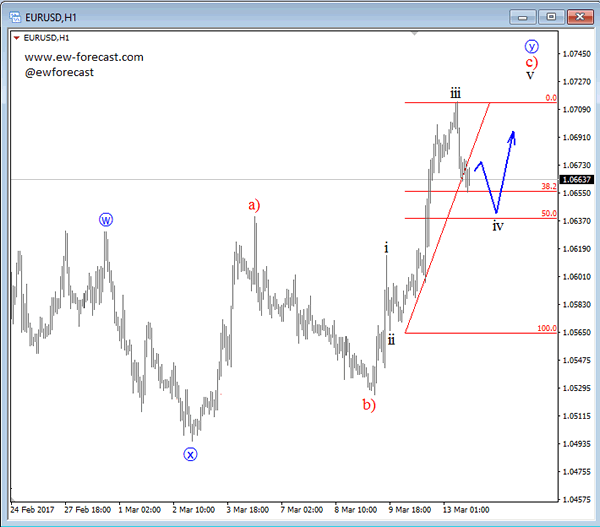
Elliott Wave Analysis: EURUSD Intraday View
Intraday price action on EURUSD is looking quite impulsive to the upside. We see this bullish run as part of a more complex correction, a W-X-Y that may be in final stages. That said, current price activity is pointing nicely to the upside within wave Y, after sub wave iv finds a base around the 38.2 or 50.0 Fibonacci ratio.
EURUSD, 1H
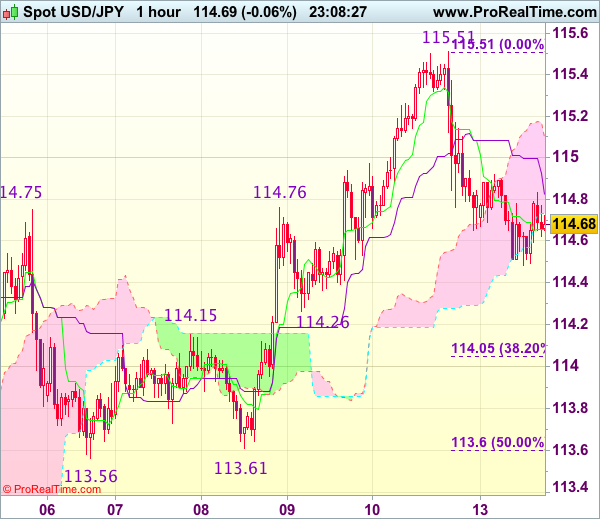
Trade Idea Wrap-up: USD/JPY – Stand aside
USD/JPY - 114.68
Most recent candlesticks pattern : N/A
Trend : Near term up
Tenkan-Sen level : 114.66
Kijun-Sen level : 114.83
Ichimoku cloud top : 115.10
Ichimoku cloud bottom : 114.73
New strategy :
Stand aside
Position : -
Target : -
Stop : -
Although the greenback recovered after finding support at 114.48 and minor consolidation is in store, reckon upside would be limited to 115.00 and near term downside risk remains for the fall from 115.51 top (last week’s high) to bring at least a retracement of recent upmove to 114.26 support but downside should be limited to 114.00-05 (38.2% Fibonacci retracement of 111.69-115.51) and price should stay well above strong support at 113.56-61), bring rebound later.
In view of this, would be prudent to stand aside for now. Above 115.00 would suggest an intra-day low is formed, bring a stronger rebound to 115.25-30 but still reckon said resistance at 115.51 would cap upside. Only break there would revive bullishness and extend recent upmove to previous resistance at 115.62, then towards 115.90-00.
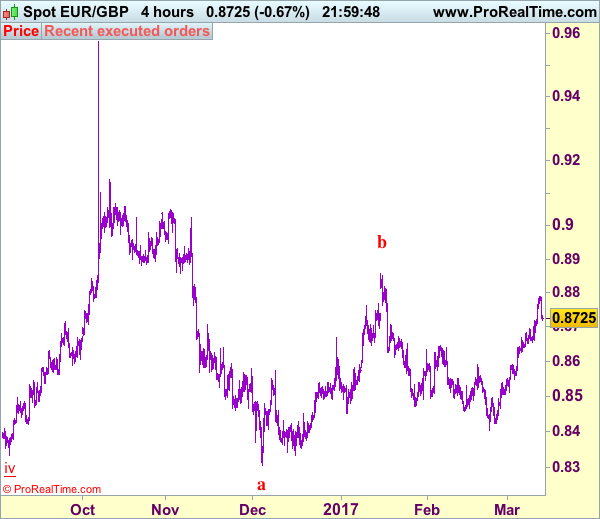
Trade Idea: EUR/GBP – Buy at 0.8660
EUR/GBP - 0.8719
Recent wave: Major double three (A)-(B)-(C)-(X)-(A)-(B)-(C) is unfolding and 2nd (A) has possibly ended at 0.6936.
Trend: Near term down
Original strategy :
Buy at 0.8660, Target: 0.8760, Stop: 0.8620
Position : -
Target : -
Stop : -
New strategy :
Buy at 0.8660, Target: 0.8760, Stop: 0.8620
Position : -
Target : -
Stop : -
As the single currency has finally retreated after rising to 0.8788 last week, suggesting consolidation below this level would be seen and pullback to 0.8690-00 cannot be ruled out, however, reckon downside would be limited to 0.8655-60 and bring another rise later, break of said resistance at 0.8788 would extend the rise from 0.8403 low to 0.8800, however, loss of near term upward momentum should prevent sharp move beyond 0.8825-30 and price should falter well below 0.8850.
In view of this, would not chase this rise here and we are looking to buy euro on further subsequent pullback as 0.8655-60 should limit downside. Below 0.8620-25 would defer and suggest top is possibly formed, risk test of 0.8600 but support at 0.8547 should remain intact.
Our preferred count is that, after forming a major top at 0.9805 (wave V), (A)-(B)-(C) correction is unfolding with (A) leg ended at 0.8400 (A: 0.8637, B: 0.9491 and 5-waver C ended at 0.8400. Wave (B) has ended at 0.9413 and impulsive wave (C) has either ended at 0.8067 or may extend one more fall to 0.8000 before prospect of another rally. Current breach of indicated resistance at 0.9043 confirms our view that the (C) leg has ended and bring stronger rebound towards 0.9150/54, then towards 0.9240/50.
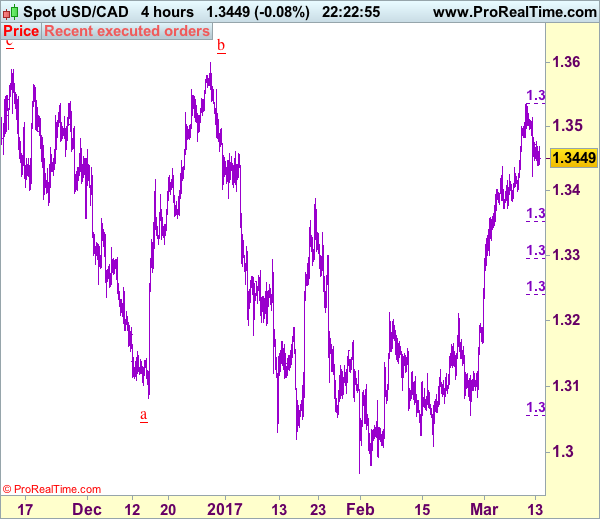
Trade Idea: USD/CAD – Buy at 1.3350
USD/CAD - 1.3451
Recent wave: Only wave v of c has ended at 0.9407 and wave C of major A-B-C correction is underway for headway to 1.4700
Trend: Near term up
Original strategy :
Buy at 1.3350, Target: 1.3550, Stop: 1.3290
Position: -
Target: -
Stop: -
New strategy :
Buy at 1.3350, Target: 1.3550, Stop: 1.3290
Position: -
Target: -
Stop:-
Although the greenback rose to as high as 1.3535 last week, the subsequent retreat has retained our view that consolidation below this level would be seen and initial downside risk is for pullback to 1.3400, however, reckon downside would be limited to 1.3370-75 support and renewed buying interest should emerge around 1.3350-55 (38.2% Fibonacci retracement of 1.3056-1.3535) and bring another rise later, above said resistance at 1.3535 would extend recent upmove for further gain to 1.3570-75 and possibly towards 1.3600 but near term overbought condition should prevent sharp move beyond 1.3640-50, bring retreat later.
In view of this, would not chase this rise here and would be prudent to buy on further pullback as 1.3350 should limit downside. Only below 1.3295-00 (50% Fibonacci retracement of 1.3056-1.3535) would signal top is formed, risk correction to 1.3250-60 but price should stay well above indicated previous resistance at 1.3212 (now support), bring another rise later.
To recap, wave B from 1.3066 is unfolding as an a-b-c and is sub-divided as a: 1.2192, b: 1.2716 and wave c is a 5-waver with i: 1.1983, ii: 1.2506, extended wave iii with minor iii at 1.0206, wave iv ended at 1.0781 and wave v as well as wave iii has ended at 0.9931, hence the subsequent choppy trading is the wave iv which is unfolding as (a)-(b)-(c) with (a) leg of iv ended at 1.0854, followed by (b) leg at 1.0108 and (c) leg as well as the wave iv ended at 1.0674. The wave v is sub-divided by minor wave (i): 0.9980, (ii): 1.0374, (iii): 0.9446, (iv): 0.9913 and (v) as well as v has possibly ended at 0.9407, therefore, consolidation with upside bias is seen for major correction, indicated target at 1.3700 and 1.4000 had been met and further gain to 1.4700 would be seen later.
Yen Steady as Japanese Inflation Improves
USD/JPY is almost unchanged in the Monday session. Currently, the pair is trading at 114.70. In Japan, PPI climbed to 1.0%, matching the forecast. This marked a second straight gain after a long string of declines. Core Machinery Orders disappointed with a sharp decline of 3.2%, well short of the forecast of 0.0%. In the US, there is one minor event on the schedule. On Tuesday, the US releases PPI, with the index expected to slip to 0.1%.
Japanese manufacturing numbers were mixed last week. After over a year of declines, Preliminary Machine Tool Orders has posted two straight gains, including a strong gain of 9.1% in February. The BSI Manufacturing Index, based on a survey of large manufacturers, disappointed in the first quarter, dropping to 1.1 points. The markets had predicted a much stronger reading of 8.4 points.
The US economy continues to steam ahead at full speed, buoyed by a red-hot labor market. On Friday, Nonfarm Payrolls sparkled with a gain of 235 thousand. This easily beat the estimate of 196 thousand. The strong release makes it a virtual certainty that the Fed will raise rates by a quarter-point on Wednesday. Although a rate hike has been priced in by the markets, there have been disappointments in the past, so a rate move will likely give the dollar a boost against its major rivals, such as the euro. The solid job numbers also give President Trump a much-needed boost. Trump is under pressure to present an economic agenda, but the markets won't mind giving him some additional breathing room with the economy performing well.
Scottish Referendum Shocker Rattles Sentiment
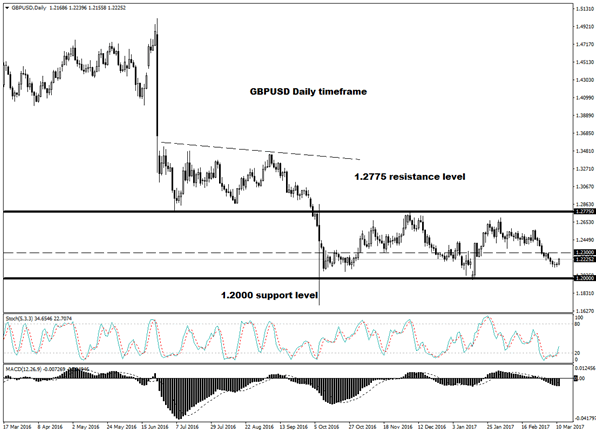
A fresh layer of uncertainty was added to the Brexit woes on Monday following reports of Scottish First Minister Nicola Sturgeon demanding a new Scottish independence referendum between autumn of 2018 and spring 2019. This bombshell development comes at a time where speculations have heightened over UK Prime Minister Theresa May potentially triggering Article 50 on Tuesday. With Sturgeon on a quest to obtain permission from the Scottish Parliament for a second referendum via the Section 30 process, the rising anxiety may expose Sterling to downside shocks. It should be kept in mind that the live threat of an independence vote in Scotland, destabilizing the United Kingdom, while it is in the critical process of leaving the European Union could weigh heavily on sentiment.
With the Brexit launch around the corner participants most likely will remain edgy from the terrible cocktail of uncertainty, revived hard Brexit fears and concerns of a Scottish referendum. Markets will be paying very close attention to how the Brexit negotiations take place with any early complications exposing the unstable Sterling to further losses. Sentiment remains bearish towards the Pound and with the Brexit developments repeatedly limiting gains, the sharp appreciation on the GBPUSD during early trading on Monday was likely attributed to Dollar weakness. The current technical bounce on the pair could provide a foundation for sellers to attack with targets stretching back towards 1.2100.
WTI gripped by oversupply concerns
The recent bearish reports of U.S crude inventories surging to record highs have renewed the oversupply concerns ultimately exposing oil prices to downside risks this month. Oil markets remain vulnerable to losses moving forward with gains limited as optimism starts to wane over the effectiveness of OPEC's production cut. Although OPEC members may be commended on their attempt to stabilizing the oil markets by cutting production, the fact that oil prices are almost where they were when the initial production cut deal was announced is a major cause for concern. Sentiment towards oil is firmly bearish and the threat of OPEC not renewing its production cut deal for the second half of the year could spell further depreciations for oil in the medium to longer term. Oil market weakness should remain a dominant theme with the current price action suggesting that supply continues to outweigh demand and fears heightening over U.S shale destabilizing the OPEC production cut deal. From a technical standpoint, WTI Crude is bearish on the daily charts as there have been consistently lower lows and lower highs. Previous support at $50 could transform into a dynamic resistance that encourages a further decline lower towards $47.
Dollar regains some ground
The rising prospects of higher US interest rates this year have supported the Greenback with bulls propelling the Dollar Index back above 101.00 during Monday's trading session. Expectations have solidified over the Federal Reserve raising US interest rates this week following February's solid NFP figure with investors seeking clarity on future rate hike timings. If the economic projections of the FOMC members are bullish and suggest further US rate hikes this year then the Greenback may charge back above 102.00 in the short to medium term. From a technical standpoint, although the Dollar Index is slightly pressured on the daily charts, a breakout back above 101.50 could encourage an incline higher towards 102.00.
EUR/USD Mid-Day Outlook
Daily Pivots: (S1) 1.0595; (P) 1.0647 (R1) 1.0723; More.....
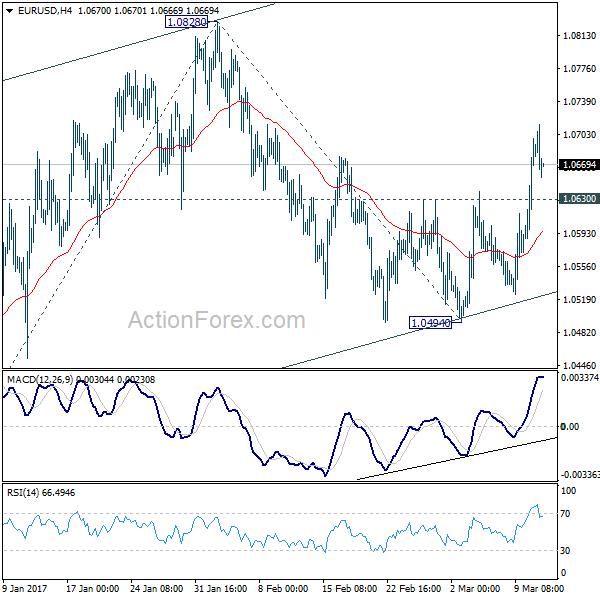
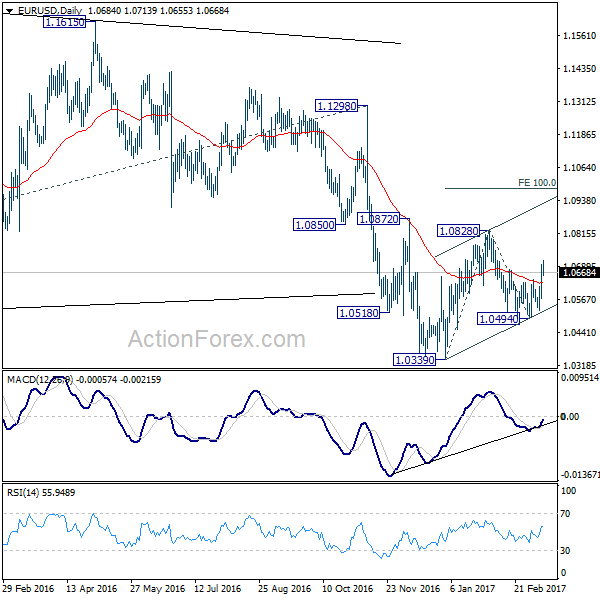
With 1.0630 minor support intact, intraday bias in EUR/USD remains on the upside. Rise from 1.0494 is expected to extend to 1.0828 resistance and above. Note again that rise from 1.0339 low is seen as a corrective move. Hence, we'd expect upside to be limited by 100% projection of 1.0339 to 1.0828 from 1.0494 at 1.0983. The larger down trend is still expected to resume later. On the downside, break of prior resistance at 1.0630 will turn bias back to the downside for retesting 1.0494 low.
In the bigger picture, as long as 1.1298 key resistance holds, whole down trend from 1.6039 (2008 high) is still expected to continue. Break of 1.0339 low will send EUR/USD through parity to 61.8% projection of 1.3993 to 1.0461 from 1.1298 at 0.9115.