Sample Category Title
Crude Struggling at 14-Week Lows on Oversupply Concerns
West Texas crude has steadied in the Monday session, following sharp losses last week. In North American trade, WTI crude futures are trading at $48.38. Brent Crude is trading at $51.36, as the Brent premium stands at $2.98. It's a quiet start to the week, with no releases on Monday. On Tuesday, the sole release is US PPI, with the markets expecting a weak gain of 0.1%.
Last week was one to forget for WTI crude, as the commodity plunged 8.7 percent. On Monday, WTI crude briefly dropped below the $48, for the first time since November 30. Will the downturn continue this week? Crude is under strong pressure as crude stockpile reports continue to point to surpluses. Last week, the Crude Inventories soared to 8.2 million barrels, well above the forecast of 1.1 million. US crude has posted surpluses in 11 of the past 12 weeks, reflective of increasing US shale production. Most of the surpluses have been much higher than the forecasts, as the markets continue to underestimate the level of crude stockpiles. The ongoing surplus has put a damper on OPEC's hopes to raise prices, as the cartel cut production levels at the beginning of January. Compliance with the agreement stands at an impressive 94% and OPEC had high hopes of pushing crude to $60 or more, but oil prices have actually declined in 2017.
It's full steam ahead for the US economy, buoyed by a red-hot labor market. On Friday, Nonfarm Payrolls sparkled with a gain of 235 thousand. This easily beat the estimate of 196 thousand. The strong release makes it a virtual certainty that the Fed will raise rates by a quarter-point on Wednesday. Although a rate hike has been priced in by the markets, there have been disappointments in the past, so a rate move will likely give the dollar a boost against its major rivals, such as the euro. The solid job numbers also give President Trump a much-needed boost. Trump is under pressure to present an economic agenda, but the markets won't mind giving him some additional breathing room with the economy performing well.
Pound Pushes Higher on Brexit Speculation
GBP/USD has started the week with gains. In Monday's North American session, the pair is trading at 1.2230. There are no economic events in the US or the UK. On Tuesday, the sole release is US PPI, with the markets expecting a weak gain of 0.1%.
There is increasing speculation that Theresa May's government may pull the Brexit trigger on Tuesday and invoke Article 50, the mechanism for initiating Britain's departure from the European Union. The government still has some house tidying to do, as the House of Lords made some changes to the government's Brexit legislation. Prime Minister May, who has repeated that she will trigger Article 50 in March, has argued that the government needs to be free of any restrictions in order to obtain the best possible deal for the UK. Under Article 50, the negotiations are slated to take up to two years. Relations between Britain and the EU have nosedived since the stunning Brexit vote in June. The timing of invoking Article 50 comes at a particularly delicate time for Europe, as the Netherlands holds elections this week and France goes to the polls in April. If Tuesday is Article 50 Day, the pound could post strong gains against its major rivals.
It's full steam ahead for the US economy, buoyed by a red-hot labor market. On Friday, Nonfarm Payrolls sparkled with a gain of 235 thousand. This easily beat the estimate of 196 thousand. The strong release makes it a virtual certainty that the Fed will raise rates by a quarter-point on Wednesday. Although a rate hike has been priced in by the markets, there have been disappointments in the past, so a rate move will likely give the dollar a boost against its major rivals, such as the euro. The solid job numbers also give President Trump a much-needed boost. Trump is under pressure to present an economic agenda, but the markets won't mind giving him some additional breathing room with the economy performing well.
Elliott Wave Trade Ideas Performance Update
The short position entered earlier in aussie at 0.7690 finally met our indicated downside target at 0.7550 and scored 140 points profit. We then entered another short position at 0.7605, however, the pair found good support at 0.7491 and has rebounded, the position stopped profit at 0.7585.
A long position was entered in EUR/JPY at 120.95 and euro did find renewed buying interest at 120.86 and rallied in line with our bullish expectation, upside target at 122.55 was met quite quickly, price rose to 122.89 earlier today before retreating.
No position was entered in other currency pairs last week.
In short, 3 positions were entered in the past two weeks with total profit of 320 points and the positions are listed below.
22 Feb : AUD/USD - Short at 0.7690, exited at 0.7550 (+ 140 points)
8 Mar : AUD/USD - Short at 0.7605, exited at 0.7585 (+ 20 points)
10 Mar : EUR/JPY - Long at 120.95, exited at 122.55 (+ 160 points)
| AUD EUR/JPY EUR/GBP CAD
Jan - 15 -275 - 35 -120
Feb + 140 -17 - 40 +11
Mar + 20 +160
Apr
May
Jun
Jul
Aug
Sep
Oct
Nov
Dec
Y-T-D + 145 - 132 - 75 + 57
Candlesticks and Ichimoku Trade Ideas Performance Update
Two long positions were entered in Swissy, the first long position entered at 1.0065 were stopped profit at 1.0095, as the greenback rose again after finding support at 1.0073, we entered another long position at 1.0100 but dollar topped out at 1.0171 and the retreat from there turned out to be deeper than expected, the position was stopped at 1.0070.
A short position was entered in EUR/USD and the position was exited at 1.0575. We also entered at long position in USD/JPY at 114.70 and in view of the retreat happened today, we exited the position with small losses.
We bought cable earlier today at 1.2215 and the position is still holding at the moment.
In short, 5 positions were entered among all 4 currency pairs with total loss of 13 points and the positions are listed below:
3 Mar : EUR/USD - Short at 1.0570, exited at 1.0575 (- 5 points)
3 Mar : USD/CHF - Long at 1.0065, exited at 1.0095 (+ 30 points)
10 Mar: USD/CHF - Long at 1.0100, exited at 1.0070 (- 30 points)
13 Mar: USD/JPY - Long at 114.70, exited at 114.62 (- 8 points)
13 Mar: GBP/USD - Long at 1.2215,
| JPY EUR CHF GBP
Jan + 167 - 85 - 10 + 50
Feb + 200 +150 +93 - 59
Mar -8 - 5 0
Apr
May
Jun
Jul
Aug
Sep
Oct
Nov
Dec
Y-T-D + 359 + 60 +83 - 9
GBP USD Elliott Wave View: Bounce Started
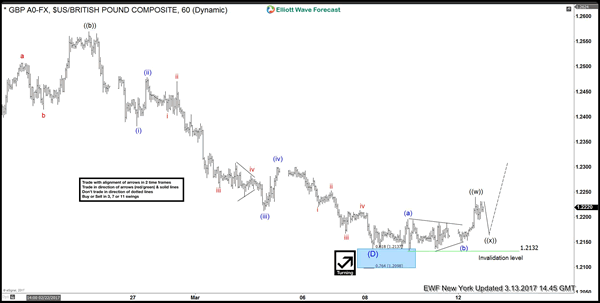
Last week , GBP USD ended the cycle from 02/02/2017 peak which unfolded as a double three Elliott wave structure with a FLAT in the Y leg. Pair slightly exceeded 123.6 Fibonacci extension (1.2145) of the first 3 swings lower from 2/2 peak before making a push higher today. With the bounce seen today, it has become more clearer that pair has ended the cycle at least from 2/24 (1.2570) high at least and as dips hold above 1.2132 low, pair can extend into the bounce . In the near-term , the pair ended 3 waves bounce and it's expected to pullback lower against the recent low 1.2132 . The pair should hold above that level for 1 more leg higher at least and could reach as highs as 50 – 61.8 Fibonacci retracement area that comes around 1.2420 – 1.2486 area.
If GBP USD makes another low, it should still be in the same cycle from 2/2 (1.2706) and decline could then be labelled as an ABC from 02/02 peak and the new low will be part of wave (( v )) of C New low, if seen, should be short-lived and we can see the pair bouncing again from 1.2100 – 1.2009 are.
GBP USD 1 Hour Chart
CAD (USDCAD) Elliott Wave Forecasting the Rally
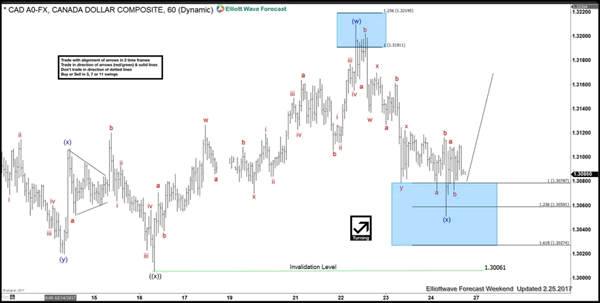
In this technical blog we are going to take a quick look at the USD CAD Elliott wave structure from January 31 cycle (1.2967), in which the pair was expected to do a double three Elliott wave, where wave Minute wave ((w)) ended at 1.3209 & Minute wave ((x)) at 1.3006, up from there Minutte wave (w) ended at 1.3208. Thus pair was expected to trade higher while short term dips remained above 1.3006 low. Below is the 1 hour weekend updated chart from Feb 25, showing correction of cycle from 1.3006 low in Minutte wave (x) pullback as 11 swings sequence Triple three structure towards 1.3078-1.3027 blue box area.
USD CAD 1 Hour weekend chart from Feb 25
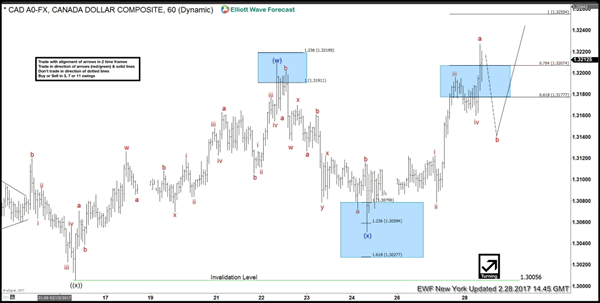
Afterwards pair was expected to resume higher from the blue box area as far as pivot from 1.3006 low remains intact or was expected to see a 3 wave bounce at least. Since then pair has rallied nicely from the blue box area (1.3078-1.3027) and broke above 1.3208 peak suggesting the next leg higher has started as shown below the February 28 1 hour NY updated chart.
USD CAD 1 Hour NY chart from February 28
The proposed pullback in Minutte wave (x) ended at 1.3051 low, while above there & more importantly above 1.3006 low, pair was expected to resume higher towards (1.3256-1.3306) 100%-123.6% fib ext area of first 3 swings to end the cycle from January 31 low. But then, pair exceeded the 1.618% Fibonacci extension area (1.3382) area & move from 1.3051 looks extended thus favoring the idea of 5 swings up from 1.3070 (2/16) low at least and possible become a FLAT from 1/31 low (1.2965). Area between 1.3382-1.3460 was expected to end wave ((iii) before pair pulled back in wave ((iv)) to correct the cycle from 1.3051 low and turned higher again in wave ((v)) of C as the updated chart from March 3 2017 below is showing.
USD CAD 1 hour NY chart from March 3
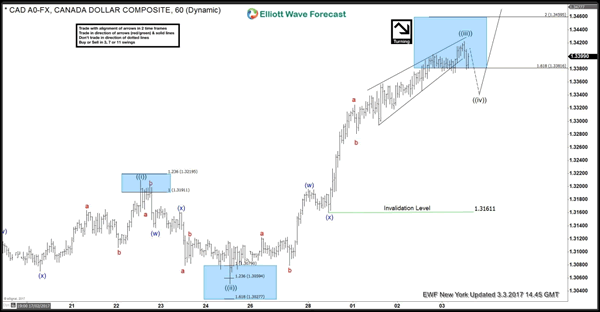
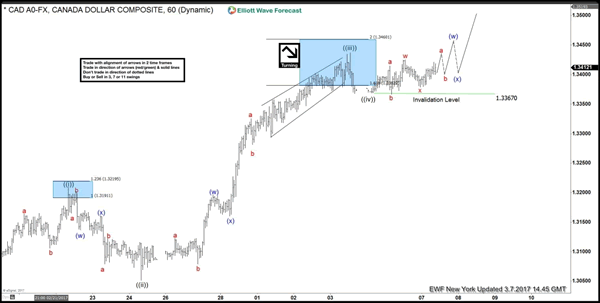
Pair made the 3 swing pullback in Minute wave ((iv)) & resumed higher again as expected for final push higher, The pullback in Minute wave ((iv)) ended in the pair at 1.3367 low, although pair has reached the minimum extension area already & have enough number of swings in placed to suggest the cycle from 1/31 lows could be done but while above 1.3367 low pair has scope to see another leg higher towards 1.3635 area approximately before pair ends the cycle from 1/31 lows & does the 3 wave pullback at least. Cycle from 1/31 low is already mature and can end soon which is why we do not like chasing longs at this stage.
USD CAD 1 hour chart from March 07
Trade Idea Wrap-up: USD/CHF – Stand aside
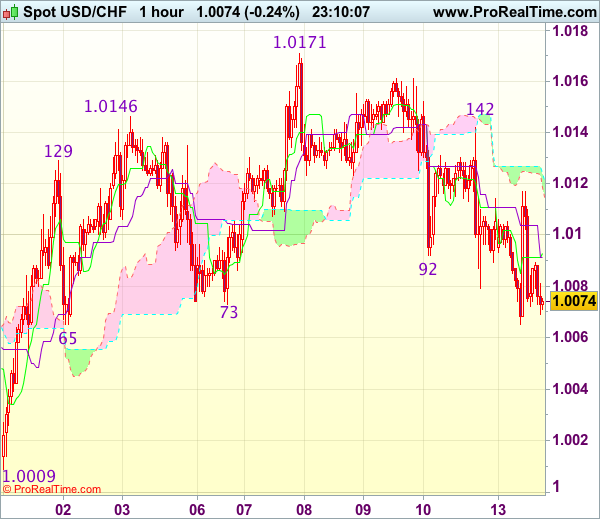
USD/CHF - 1.0072
Most recent candlesticks pattern : N/A
Trend : Sideways
Tenkan-Sen level : 1.0093
Kijun-Sen level : 1.0091
Ichimoku cloud top : 1.0124
Ichimoku cloud bottom : 1.0119
New strategy :
Stand aside
Position : -
Target : -
Stop : -
The greenback met renewed selling interest at 1.0114 earlier today and has dropped again, suggesting the erratic fall from 1.0171 top is still in progress, however, break of support at 1.0065 is needed to retain bearishness and signal recent erratic rise from 0.9861 has ended and bring further fall to 1.0035-40 but support at 1.0009 should remain intact, bring rebound later.
In view of this, would not chase this fall here and would be prudent to stand aside in the meantime. Above 1.0114 would bring test of indicated resistance at 1.0142 but break there is needed to signal low is formed instead, bring further gain towards last week’s high at 1.0171.
Trade Idea Wrap-up: GBP/USD – Hold long entered at 1.2215
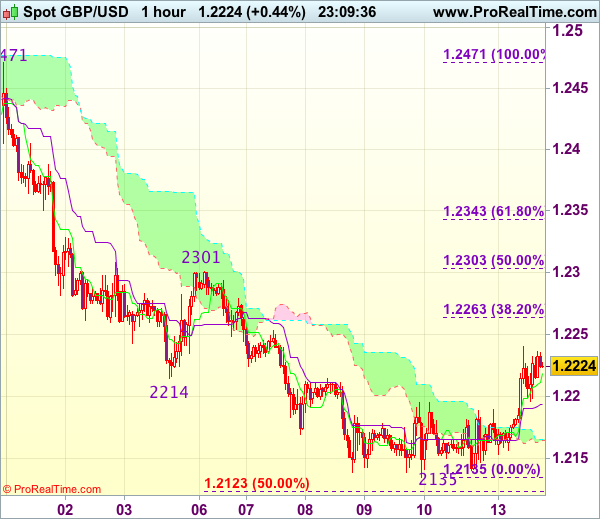
GBP/USD - 1.2225
Most recent candlesticks pattern : N/A
Trend : Near term down
Tenkan-Sen level : 1.2218
Kijun-Sen level : 1.2194
Ichimoku cloud top : 1.2165
Ichimoku cloud bottom : 1.2165
Original strategy :
Bought at 1.2215, Target: 1.2320, Stop: 1.2180
Position : - Long at 1.2215
Target : - 1.2320
Stop : - 1.,2180
New strategy :
Hold long entered at 1.2215, Target: 1.2320, Stop: 1.2180
Position : - Long at 1.2215
Target : - 1.2320
Stop : - 1.2180
Current rally above indicated resistance at 1.2195 suggests a temporary low is possibly formed at 1.2135 last week and consolidation with upside bias is seen for retracement of recent decline, hence further gain to 1.2260-65 (38.2% Fibonacci retracement of 1.2471-1.2135) would be seen, however, break of 1.2301-03 (previous resistance and 50% Fibonacci retracement) is needed to signal low is formed, bring a stronger rebound to 1.2340-45 (61.8% Fibonacci retracement) later.
In view of this, we are holding on to our long position entered at 1.2215. Below the Kijun-Sen (now at 1.2194) would defer and risk weakness to 1.2170 but said support at 1.2135 should hold. Only break there would abort and signal recent decline has resumed and extend weakness to 1.2100.
Trade Idea Wrap-up: EUR/USD – Buy at 1.0640
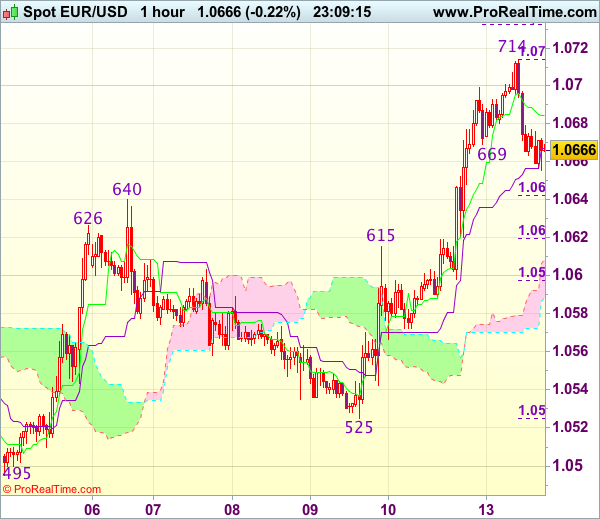
EUR/USD - 1.0668
Most recent candlesticks pattern : N/A
Trend : Near term up
Tenkan-Sen level : 1.0685
Kijun-Sen level : 1.0667
Ichimoku cloud top : 1.0609
Ichimoku cloud bottom : 1.0589
Original strategy :
Buy at 1.0640, Target: 1.0740, Stop: 1.0610
Position : -
Target : -
Stop : -
New strategy :
Buy at 1.0640, Target: 1.0740, Stop: 1.0610
Position : -
Target : -
Stop : -
As the single currency has retreated after rising to 1.0714 earlier today, suggesting consolidation below this level would be seen and pullback to 1.0640 (previous resistance now support) cannot be ruled out, however, reckon downside would be limited and bring another rise later, above 1.0714 would signal the erratic rise from 1.0493 low is still in progress and may extend gain to 1.0740-45 (1.5 times projection of 1.0495-1.0640 measuring from 1.0525) but loss of near term upward momentum should prevent sharp move beyond 1.0760 (1.618 times projection of 1.0495-1.0640 measuring from 1.0525).
In view of this, we are looking to buy euro on further pullback as 1.0540 should limit downside, bring another rise later. Below another previous resistance at 1.0615 would abort and signal top has been formed, risk further fall to 1.0575-80 first.
Elliott Wave Analysis: EURUSD Intraday View
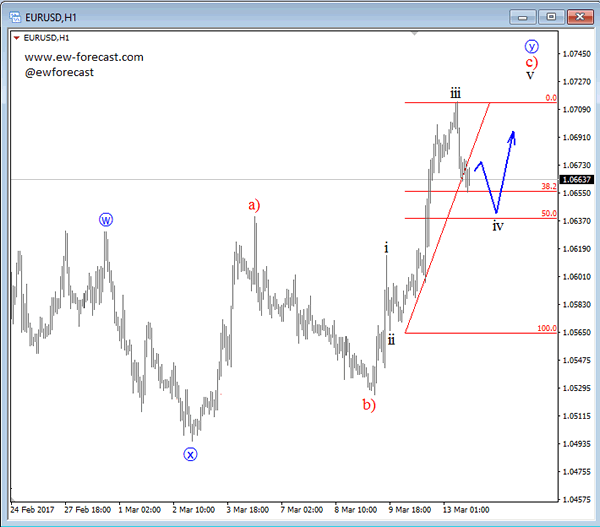
Intraday price action on EURUSD is looking quite impulsive to the upside. We see this bullish run as part of a more complex correction, a W-X-Y that may be in final stages. That said, current price activity is pointing nicely to the upside within wave Y, after sub wave iv finds a base around the 38.2 or 50.0 Fibonacci ratio.
EURUSD, 1H