Sample Category Title
Down This Beaten Path, Again
Down this beaten path. again
A sense of deja-vu is setting in as the market danced around yet another European worst-case risk scenario while inflation or the lack thereof becomes an overriding preoccupation for global markets., once again
Inglorious uncertainty has set in over the course of the Federal Reserve Board path to interest rate normalisation as the FOMC minutes indicated that the board was still profoundly divided about the slow pick up in prices and by all accounts, and as always, the Fed will continue to watch the data as we move into December. Indeed the Fed is back on inflation watch but just how much inference can be gleaned from the next sets of inflation data is questionable given the hurricane impact on perishables and energy prices.
The USD traded weaker on the initial post minutes knee-jerk, but with last Friday’s stronger AHE reading fresh in their minds, traders were reluctant to press their dollar bearish view given that many Fed officials are making a case for another hike in 2017.
It’s not like we haven’t been down this road before as the Feds continue to err on the dovish side. And while the dollar struggles there’s no indication that equity markets are backing down as Wall Street continues to surge to record levels on the back of insatiable investor appetite. In my view, the Fed debate is not so about a December hike, which is more or less priced in, but instead whether the dovish fringe exerts enough power to influence the 2018 dot plots.
The focus will now shift to tomorrow critical CPI print, but as with last weeks data prints, the market may discount the anticipated inflation surge due to the influence of increased gasoline prices. Instead, trading desks will remain focused on the next Fed chair.
Musical chairs continue to be the flavour of the day as we near Fed Chair nominee decision time. But realistically, there is absolutely no room for error or bipartisan wrangling in this decision more so as the FOMC is now starting the daunting task of balance reduction. Indeed, Jerome Powell, the only Republican currently serving at the FOMC, would most certainly fit the bill for an extension of the Fed gradual process of monetary normalisation and would represent continuity.
The Euro
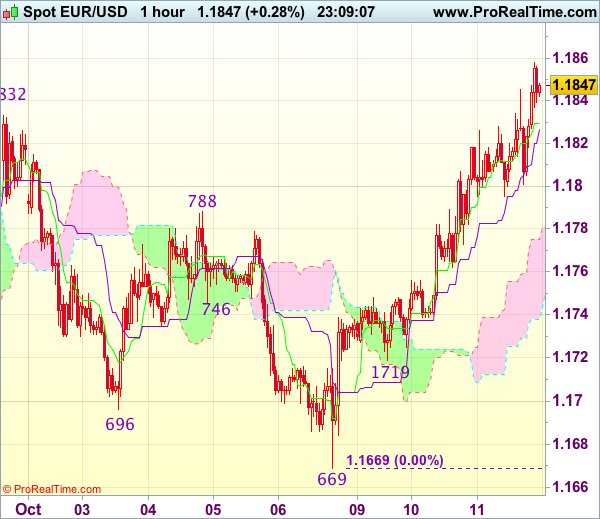
US Treasuries are still the primary focus and driver of FX. Not sure whether its FX desks are watching the Bond desk or vice versa but we’ve retraced from some extended positions pre-NFP build up. The Euro feels comfortable after regaining the 1.1800 handle, but I still view this as more of a relief rally as EU risk has tentatively settled. At current levels, there are just too many risk surrounding the Fed chair and tax reform, not to mention the Fed curve to make a solid case for a Euro rally extension.Rather caution, prudence and discretion should be the preferred course in what is likely to be a very choppy market for the next few weeks.
Japanese Yen
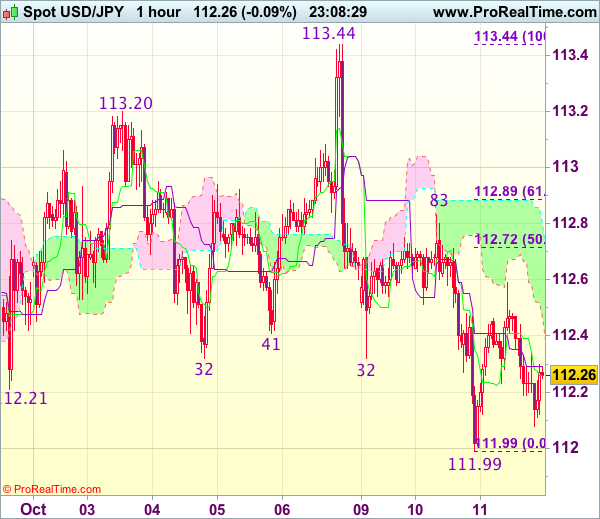
Lower US treasury yields saw USDJPY test 112.35 support overnight and indeed threatened to break lower. What appeared a no-brainer long USD trade last week is proving to be a game frustration as the risk-reward for an extension of the previous week USD rally looks fleeting.Also, some scuttlebutt about North Korea repositioning 30 SCUD missiles weighed on sentiment
Australian Dollar
OK, so the Aussie dollar is not down for the count just yet and despite the rebound in consumer sentiment, local price action is currently driven by USDCNH. But given the uncertainties of Fed Pricing and an arguably dovish FOMC minutes, it should underpin sentiment. But whether the AUDUSD has enough moxie to bridge the fundamental .7830 level, I think this more or less comes down to an extension of the Yuan rally.
Asia EMFX
The USD is looking tired again, with geopolitical risk abating, global stock market surging and getting little support from tax reform.
Asian currencies should continue to strengthen on the broad-based USD weakness and resilient equity markets
USD/CAD Canadian Dollar Higher After Predictable Fed Minutes
The Canadian dollar appreciated after the release of the Federal Open Market Committee (FOMC) September meeting minutes. The U.S. Federal Reserve announced the details of its balance sheet reduction plans at the September meeting and voted unanimously to keep rates unchanged but the big question mark remained on the internal debate on inflation. There are mainly two camps at the US central bank. Those who believe inflation is too low and therefore it is wrong to hike rates. In the other hand the second group believes that waiting for inflation to catch up could be a mistake.
So far the hawks have been in the lead with two interest rate advances already in 2017. A third and final rate hike could happen in December with inflation having a big say. Many policymakers still see another rate move as a positive and the market seems to agree pricing the move in December with a 87 percent probability. Inflation data will be key with the upcoming US consumer price index (CPI) release on Friday potentially the biggest economic indicator this week.
The USD continues to struggle with the Trump campaigns failure to pass a strong reform. The political capital that was spent in the first three quarters of the year has left the White House exhausted and depleted with little to show. The tax reform was supposed to be part of a one-two punch along with infrastructure spending.
NAFTA comments from US President Donald Trump were not too optimistic on the renegotiation of the trade deal. Trump offered Canada a chance to negotiate a free trade directly if talks fail.
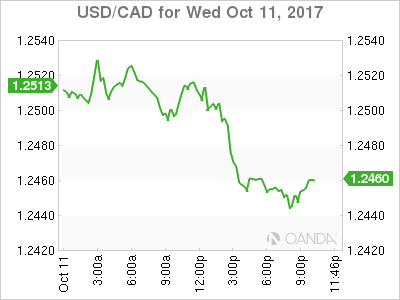
The USD/CAD lost 0.40 percent since the Asian market open. The currency pair is trading at 1.2455 after touching daily lows with the release of the FOMC September minutes. The Fed is still expected to lift rates in December but the USD could not take advantage as that move has already been priced into the currency. Political uncertainty in the US has kept the greenback grounded.
New House prices in Canada will be released with a small gain of 0.3 percent expected. While real estate has been a concern for the Bank of Canada (BoC) due to inflated prices and high levels of debt to service mortgages it seems that higher rates and stringent regulation have cooled the market. BoC deputy governor Carolyn Wilkins will speak on Thursday, October 12 at 3:15 pm at the Institute of International Finance Annual meeting in Washington. Communication might be one of the areas the central bank wishes to improve after staying mum ahead of the September meeting that took the market by surprise with the second rate hike in 2017.
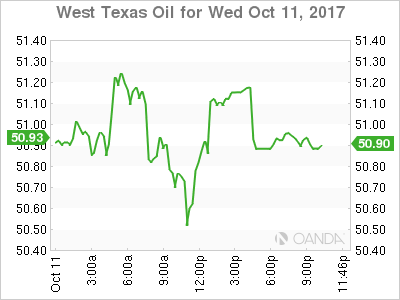
Energy prices closed nearly flat on Wednesday. The price of West Texas Intermediate close above $51 with the Organization of the Petroleum Exporting Countries (OPEC) positive outlook on global demand. The group announced a 200,000 barrel jump in demand and with the efforts alongside Russia and other major producers the market is close to rebalancing.
Oil prices have risen since rumours are circling about an extension of the production cut agreement. Weather and geopolitical disruptions to supply have also lifted prices higher. The black stuff remains range bound as every effort by OPEC and Russia is met with rising production out of the US, Canada and Brazil.
US crude inventories will be released on Thursday, at 11:00 am EDT. The weekly data was pushed one day later due to the Columbus Day holiday. Crude stocks are forecasted to remain in negative territory with a 1.9 drawdown.
Market events to watch this week:
Thursday, October 12
8:30am USD PPI m/m
8:30am USD Unemployment Claims
10:15am EUR ECB President Draghi Speaks
11:00am USD Crude Oil Inventories
Friday, October 13
8:30am USD CPI m/m
8:30am USD Core CPI m/m
8:30am USD Core Retail Sales m/m
8:30am USD Retail Sales m/m
Dollar Dives ahead of Fed Meeting Minutes; Euro Rallies as Catalonia-Related Risk Eases
The dollar was the worst performer during the European session on Wednesday as both geopolitical risks and uncertainty over Trump's fiscal policy dragged the currency lower against other major currencies. Comments by the Chicago Fed President, Charles Evans, and disappointing readings on JOLTS job openings added further losses to the greenback. On the other hand, the euro was performing the best as the absence of a formal Catalan independence declaration relieved markets which feared possible negative political implications. The Spanish government, though, accused the Catalan leader of causing confusion with his actions.
With the North Korean story getting more complicated and investors worrying that Trump's feud with Senator Bob Corker would harm his tax plans, the dollar extended its slide against its peers during the session after JOLTS job openings came in below expectations and the Chicago Fed President, Charles Evans, questioned the path of inflation.
US job vacancies increased by 6.082 million in August, below the 6.140 million seen in July and the 6.125 million anticipated by analysts. It is worth noting that the figure was probably affected by the hurricanes. This comes a few hours before the release of the Fed's September meeting minutes at 1800GMT with market watchers looking for insights on the future path of monetary policy.
Earlier, the Chicago Fed President, Charles Evans, speaking at a Bloomberg event in Zurich today, claimed that factors weighing on inflation might not be temporary and it makes him "nervous" when such factors are cited as explanations in inflation forecast surveys. He also said that there is no "harm in waiting longer to take more stock of the inflation situation". Yet he acknowledged the strength of the US as well as of the global economy.
The dollar index dropped to a two-week low of 92.96 before it edged up to 93.07, being down by 0.23% on the day. Dollar/yen moved down by 0.18% to 112.25, whilst dollar/swissie declined by 0.30% to 0.9723. The safe-haven gold stood 0.10% higher at $1,288.70 per ounce.
A day after the Catalan leader, Carles Puigdemont, signed the sovereignty of Catalonia but decided to freeze implementation in order to initiate dialogues with the Spanish government, the Spanish Prime Minister, Mariano Rajoy, called Puigdemont on Wednesday to clarify whether Catalonia is considered now independent. This action was said to be the first step over the course of phases (Article 155 or "nuclear option") needed for the Spanish government to suspend Catalonia's autonomy and therefore intervene in the running of the region – a measure never been used in Spain or in other European countries.
Euro/dollar extended its uptrend by 0.40% during the day, making a fresh two-week high of 1.1857. Euro/pound was also 0.40% up at 0.8976, while euro/yen gained 0.15%, rising to 132.96.
In the UK, the British Finance Minister, Philip Hammond, spoke in front of a parliamentary committee on Brexit on Wednesday, admitting that the government is making plans for all possibilities including the "no deal" prospect regarding Britain's departure and its future relations with the block. Moreover, he argued that he would not make any financial commitments related to a "hard" Brexit scenario at the moment unless there is evidence on that outcome. Besides that, he suggested for discussions on the transitional period to speed up, supporting transitional arrangements have an important value probably until the start of the new year but as the time moves through 2018 "its value to everybody will diminish significantly".
The pound was moving sideways around $1.3204.
Turning to energy markets, the monthly OPEC report released today increased the demand projections for 2018 for the third consecutive time, stating that demand for crude oil would be 33.06 million bpd next year, 230,000 bpd up from the previous forecast. In addition, the report reiterated the high degree of compliance between OPEC and non-OPEC members to curb the oil supply glut. However, oil prices retreated after the statement mentioned that OPEC's production in September rose to the highest monthly level this year. WTI crude fell from a one-week high of $51.92 reached today to $50.81 per barrel, being 0.22% down on the day, while Brent declined by 0.41% to $56.38.
Easing Tensions in Spain Led to Euro Strengthening
The euro reacted positively to the speech by Catalan leader Carles Puigdemont where he commented that negotiations with the Spanish authorities are required. The Spanish Prime minister, Mariano Rajoy, demanded the Catalan leader clarify his position but tensions eased and optimism returned to European markets. Some pressure on the dollar came from the decline in JOLTS Job Openings to 6.08 million in August versus the 6.13 million forecasted. One of the main events during this week will be the FOMC meeting minutes' release at 18:00 GMT today. If the probability of the third rate hike for this year increases then the EUR/USD may resume negative dynamics.
The greenback is losing positions against other major world currencies due to a lack of confidence in the ability of President Trump to pass tax reforms through Congress. Pressure on the USD/JPY quotes also came from the report on core machinery orders in Japan which increased by 3.4% in August which is much better than the 0.8% forecasted. Trader sentiment may be impacted today following the statistics from Japan on bank lending and the producer price index which will be published at 23:50 GMT.
The British pound stopped growing after seeing confident growth based on the expected tightening in monetary policy by the Bank of England. Investors are not in a hurry to accumulate long positions because of uncertainty surrounding the outcome of negotiations on the Brexit terms.
EUR/USD
The single currency keeps growing, and breaking through the 1.1825 resistance line may become a stimulus for continued rising movements to 1.1925 and 1.2000. The RSI on the 15-minute chart reached the overbought territory which points to a possible rollback with potential targets in the 1.1800-1.1825 range.
USD/JPY
The USD/JPY quotes have left the limits of the rising channel and are testing the 112.00 level. Breaking through the 111.70 support may become the basis for further drops to 110.00 and 109.60. A potential increase is likely to be restrained by resistance at 113.00. The RSI being near the oversold zone shows the possibility of the rebound soon.
GBP/USD
The GBP/USD price is consolidating after a confident rising movement during the previous trading session. In order to continue growth, the quotes need to break through 1.3250. The targets in this case will be located at 1.3400 and 1.3600. The immediate goals in case of the fall resuming are 1.3050 and 1.3000.
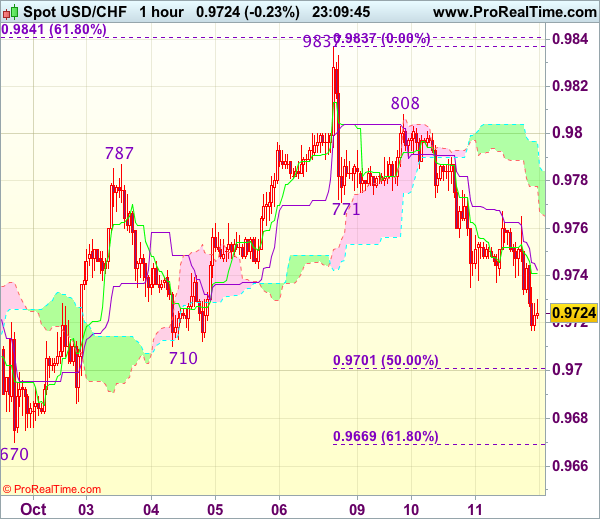
Trade Idea Wrap-up: USD/CHF – Sell at 0.9760
USD/CHF - 0.9727
Most recent candlesticks pattern : N/A
Trend : Near term up
Tenkan-Sen level : 0.9741
Kijun-Sen level : 0.9742
Ichimoku cloud top : 0.9797
Ichimoku cloud bottom : 0.9778
Original strategy :
Sell at 0.9760, Target: 0.9660, Stop: 0.9795
Position : -
Target : -
Stop : -
New strategy :
Sell at 0.9760, Target: 0.9660, Stop: 0.9795
Position : -
Target : -
Stop : -
As the greenback has remained under pressure, adding credence to our view that top has possibly been formed at 0.9837 last week and consolidation with mild downside bias is seen for weakness to previous support at 0.9710, however, break there is needed to retain bearishness for further decline towards 0.9669-70 (61.8% Fibonacci retracement of 0.9565-0.9837 and previous support) which is likely to hold on first testing.
In view of this, would not chase this fall here and we are looking to sell dollar on recovery as previous support at 0.9771 should turn into resistance and limit upside. Only break of resistance at 0.9808 would signal an intra-day low is formed and indicate the pullback from 0.9837 has ended, bring retest of this level later.
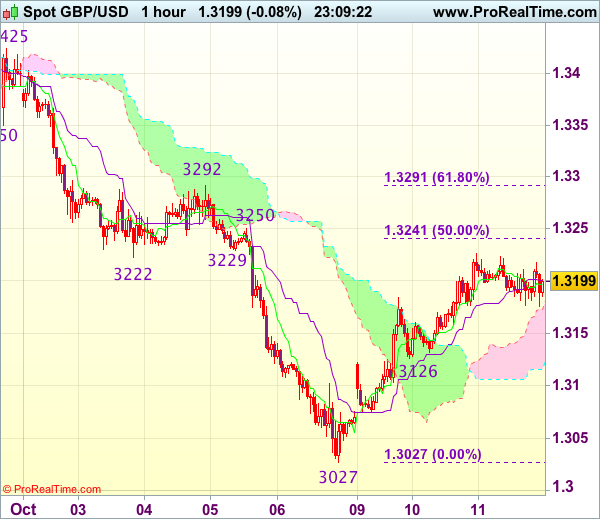
Trade Idea Wrap-up: GBP/USD – Stand aside
GBP/USD - 1.3196
Most recent candlesticks pattern : N/A
Trend : Down
Tenkan-Sen level : 1.3197
Kijun-Sen level : 1.3201
Ichimoku cloud top : 1.3173
Ichimoku cloud bottom : 1.3116
New strategy :
Stand aside
Position : -
Target : -
Stop : -
As cable has eased after faltering below resistance at 1.3226 (yesterday’s high), suggesting consolidation below this level would be seen and pullback to 1.3145-50 cannot be ruled out, however, break of support at 1.3126 is needed to signal the rebound from 1.3027 (last week’s low) has ended, bring weakness towards 1.3070-75 first.
On the upside, above said resistance at 1.3226 would extend the corrective rise from 1.3027 to 1.3240-50 (50% Fibonacci retracement of 1.3455-1.3027 and previous resistance), however, further sharp move beyond 1.3270 should not be repeated and price should falter below 1.3291-92 (61.8% Fibonacci retracement and previous resistance), bring retreat later. As near term outlook is mixed, would be prudent to stand aside for now.
Trade Idea Wrap-up: EUR/USD – Buy at 1.1780
EUR/USD - 1.1854
Most recent candlesticks pattern : N/A
Trend : Near term up
Tenkan-Sen level : 1.1830
Kijun-Sen level : 1.1827
Ichimoku cloud top : 1.1775
Ichimoku cloud bottom : 1.1738
Original strategy :
Buy at 1.1780, Target: 1.1880, Stop: 1.1745
Position : -
Target : -
Stop : -
New strategy :
Buy at 1.1780, Target: 1.1880, Stop: 1.1745
Position : -
Target : -
Stop : -
As the single currency has risen again today, adding credence to our view that the rise from 1.1669 temporary low (formed last week) is still in progress and mild upside bias remains for this move to bring retracement of recent decline to 1.1861-62, however, reckon upside would be limited to 1.1895-00 (61.8% Fibonacci retracement of 1.2035-1.1669) and bring retreat later.
In view of this, would not chase this rise here and we are still looking to buy euro on subsequent pullback as 1.1780-85 should limit downside and bring another rebound. Below 1.1745-50 would defer but only break of indicated support at 1.1719 would abort and signal top is formed, risk weakness to 1.1695-00 first.
Trade Idea Wrap-up: USD/JPY – Sell at 112.80
USD/JPY - 112.26
Most recent candlesticks pattern : N/A
Trend : Up
Tenkan-Sen level : 112.26
Kijun-Sen level : 112.29
Ichimoku cloud top : 112.80
Ichimoku cloud bottom : 112.47
Original strategy :
Sell at 112.80, Target: 111.80, Stop: 113.15
Position : -
Target : -
Stop : -
New strategy :
Sell at 112.80, Target: 111.80, Stop: 113.15
Position : -
Target : -
Stop : -
Although dollar rebounded after falling to 111.99 yesterday and initial upside risk is for recovery to 112.70-75 (50% Fibonacci retracement of 113.44-111.99), reckon 112.83-89 (yesterday’s high and 61.8% Fibonacci retracement) would limit upside and bring another decline later, below said support at 111.99 would add credence to our view that top has been formed at 113.44 and extend weakness to 111.75-80, then towards 111.47 support but oversold condition would limit downside and reckon 111.11 support would remain intact.
In view of this, we are looking to sell dollar on recovery as 112.83 resistance should limit upside and bring another decline. A break of indicated level at 112.83-89 would abort and signal low is formed, bring a stronger rebound to 113.10-20 but price should falter well below said last week’s high at 113.44.
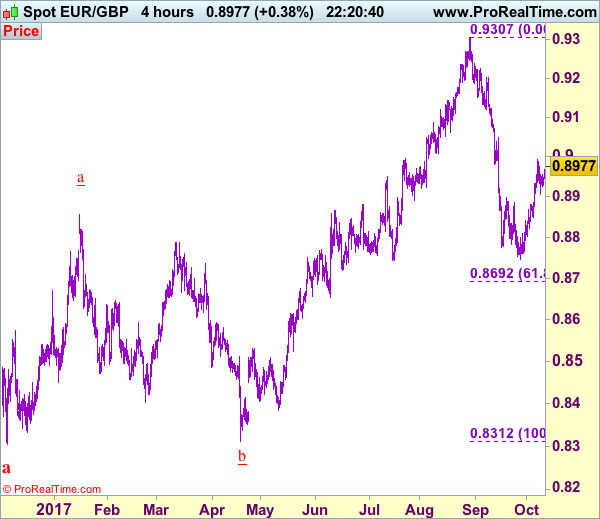
Trade Idea: EUR/GBP – Stand aside
EUR/GBP - 0.8982
Original strategy :
Sold at 0.8930, stopped at 0.8970
Position : - Short at 0.8930
Target : -
Stop : - 0.8970
New strategy :
Stand aside
Position : -
Target : -
Stop : -
The single currency has rebounded after finding support at 0.8906 earlier this week, suggesting the pullback from 0.8993 has ended and retest of said resistance is likely, break there would extend the rise from 0.8746 low for retracement of recent decline to 0.9020-25 and later towards resistance at 0.9048 which is likely to hold from here due to loss of upward momentum.
In view of this, would not chase this rise here and would be prudent to stand aside for now. Below 0.8935-40 would bring another test of said support at 0.8906 but break there is needed to revive bearishness and signal top has been formed at 0.8993, bring further fall to 0.8870-75, then test of support at 0.8850, only break there would provide confirmation and extend weakness to 0.8820-25 but the single currency needs to penetrate 0.8800-05 to signal the rebound from last month’s low at 0.8746 has ended, then subsequent decline to 0.8770 would follow.
Our preferred count is that, after forming a major top at 0.9805 (wave V), (A)-(B)-(C) correction is unfolding with (A) leg ended at 0.8400 (A: 0.8637, B: 0.9491 and 5-waver C ended at 0.8400. Wave (B) has ended at 0.9413 and impulsive wave (C) has either ended at 0.8067 or may extend one more fall to 0.8000 before prospect of another rally. Current breach of indicated resistance at 0.9043 confirms our view that the (C) leg has ended and bring stronger rebound towards 0.9150/54, then towards 0.9240/50.
EURUSD – Extended Recovery Eyes Daily Cloud Top; FOMS Minutes in Focus
Recovery rally from last Friday's low at 1.1669 extends through converged 20/55SMA's and emerges above 4-hr cloud, on acceleration after break above pivot at 1.1830 (Fibo 38.2% of 1.2092/1.1669 descend/former high of 29 Sep). Bulls eye daily Kijun-sen at 1.1880 (also 50% retracement), which lies just ahead of next pivotal barrier at 1.1894 (daily cloud top). The pair needs close above daily cloud to confirm reversal. Weaker dollar and easing tensions over Catalonia work in favor of the single currency. Broken Fibo 38.2% point at 1.1830 now acts as good support, followed by daily low at 1.1795. Return below daily Tenkan-sen at 1.1763 will be bearish. Near-term focus shifts towards the minutes of Fed's September meeting for fresh signals, with high expectations in the markets for rate hike in Fed's December policy meeting.
Res: 1.1880; 1.1893; 1.1930; 1.1992
Sup: 1.1830; 1.1795; 1.1763; 1.1737