Sample Category Title
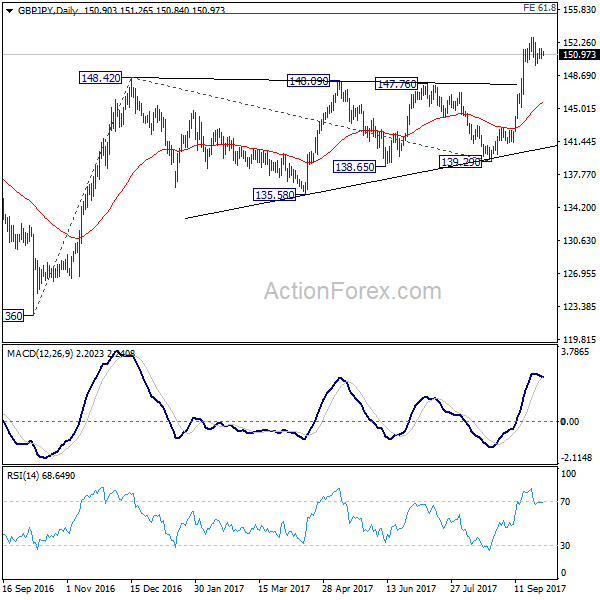
GBP/JPY Daily Outlook
Daily Pivots: (S1) 150.44; (P) 151.00; (R1) 151.55; More
Consolidation from 152.82 is still in progress and intraday bias remains neutral first. In case of deeper pull back, downside is expected to be contained by 38.2% retracement of 141.17 to 152.82 at 148.36 to bring rally resumption. Break of 152.82 will extend the larger rise from 122.36 to 61.8% projection of 122.36 to 148.42 from 139.29 at 155.39 next.
In the bigger picture, medium term rebound from 122.36 is in progress. Firm break of 38.2% retracement of 196.85 to 122.36 at 150.43 will carry long term bullish implications. In that case, GBP/JPY could target 61.8% retracement at 167.78. For now, the bullish scenario is preferred as long as 139.29 support holds.

Trade Idea : EUR/USD – Sell at 1.1855
EUR/USD - 1.1793
Most recent candlesticks pattern : N/A
Trend : Down
Tenkan-Sen level : 1.1787
Kijun-Sen level : 1.1763
Ichimoku cloud top : 1.1790
Ichimoku cloud bottom : 1.1747
Original strategy :
Sell at 1.1830, Target: 1.1730, Stop: 1.1865
Position : -
Target : -
Stop : -
New strategy :
Sell at 1.1855, Target: 1.1735, Stop: 1.1890
Position : -
Target : -
Stop : -
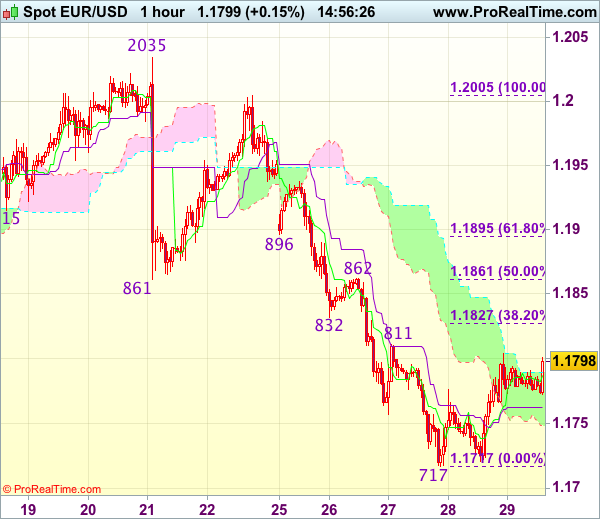
Euro’s rebound after holding above support at 1.1717 has retained our view that consolidation above this level would be seen and recovery towards resistance at 1.1811 cannot be ruled out, however, reckon upside would be limited to 1.1825-30 (38.2% Fibonacci retracement of 1.2005-1.1717) and renewed selling interest would emerge below 1.1861-62 (50% Fibonacci retracement and previous resistance), bring another decline later, below 1.1740-45 would bring retest of said support at 1.1717, break there would signal the decline from 1.2093 top has resumed and extend weakness to 1.1700 but loss of downward momentum should prevent sharp fall below previous support at 1.1662 and reckon 1.1625-30 would hold, bring rebound later.
In view of this, we are looking to sell euro on recovery as 1.1850-55 should limit upside and bring another decline. A firm break above previous support at 1.1832-38 (now resistance) should hold and bring another decline later. Above resistance at 1.1862 would abort and signal low is formed instead, bring a stronger rebound to 1.1896 (another previous support).
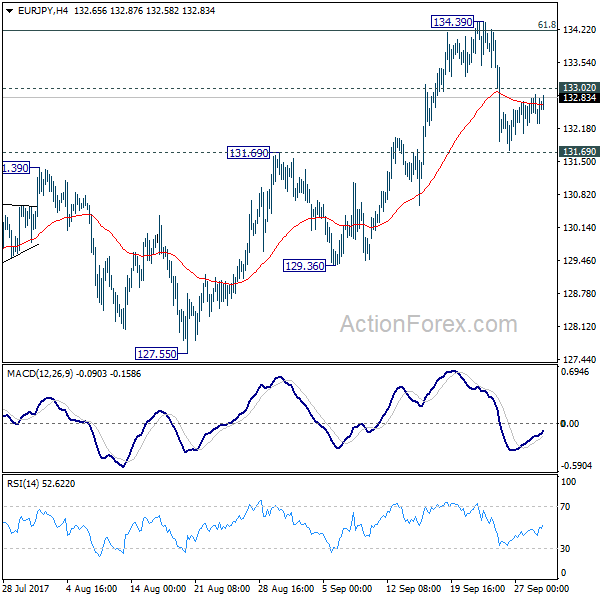
EUR/JPY Daily Outlook
Daily Pivots: (S1) 132.16; (P) 132.52; (R1) 132.76; More...
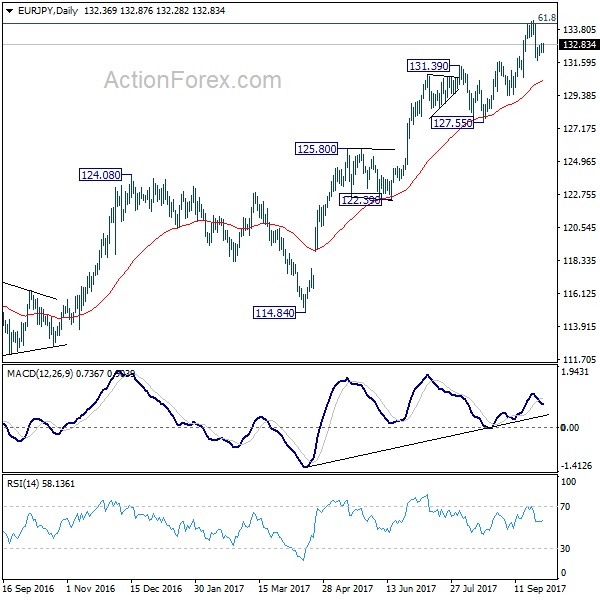
Intraday bias in EUR/JPY remains neutral as corrective trading from 134.39 is still in progress. Outlook stays bullish as long as 131.69 support holds. Above 133.02 minor resistance will turn bias back to the upside. Sustained break of 134.20 fibonacci level will extend larger up trend to 141.04 resistance next. However, break of 131.69 will be an early sigh of medium term reversal and will target 127.55 key support level instead.
In the bigger picture, current rise from 109.03 is seen as at the same degree as the down trend from 149.76 (2014 high) to 109.03 (2016 low). 61.8% retracement of 149.76 to 109.03 at 134.20 is already met. Sustained break there will pave the way to key long term resistance zone at 141.04/149.76. On the downside, break of 127.55 support is needed to be the first signal of medium term reversal. Otherwise, outlook will remain bullish.
Trade Idea : EUR/USD – Sell at 1.1855
EUR/USD - 1.1793
Most recent candlesticks pattern : N/A
Trend : Down
Tenkan-Sen level : 1.1787
Kijun-Sen level : 1.1763
Ichimoku cloud top : 1.1790
Ichimoku cloud bottom : 1.1747
Original strategy :
Sell at 1.1830, Target: 1.1730, Stop: 1.1865
Position : -
Target : -
Stop : -
New strategy :
Sell at 1.1855, Target: 1.1735, Stop: 1.1890
Position : -
Target : -
Stop : -
Euro’s rebound after holding above support at 1.1717 has retained our view that consolidation above this level would be seen and recovery towards resistance at 1.1811 cannot be ruled out, however, reckon upside would be limited to 1.1825-30 (38.2% Fibonacci retracement of 1.2005-1.1717) and renewed selling interest would emerge below 1.1861-62 (50% Fibonacci retracement and previous resistance), bring another decline later, below 1.1740-45 would bring retest of said support at 1.1717, break there would signal the decline from 1.2093 top has resumed and extend weakness to 1.1700 but loss of downward momentum should prevent sharp fall below previous support at 1.1662 and reckon 1.1625-30 would hold, bring rebound later.
In view of this, we are looking to sell euro on recovery as 1.1850-55 should limit upside and bring another decline. A firm break above previous support at 1.1832-38 (now resistance) should hold and bring another decline later. Above resistance at 1.1862 would abort and signal low is formed instead, bring a stronger rebound to 1.1896 (another previous support).
EUR/GBP Daily Outlook
Daily Pivots: (S1) 0.8748; (P) 0.8778; (R1) 0.8798; More...
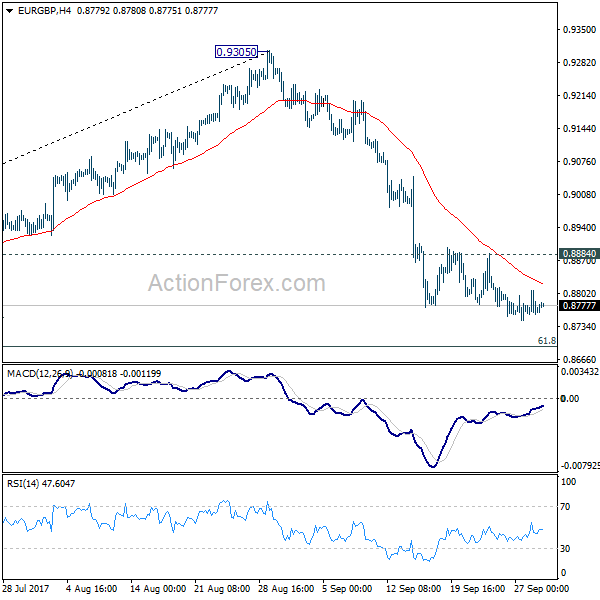
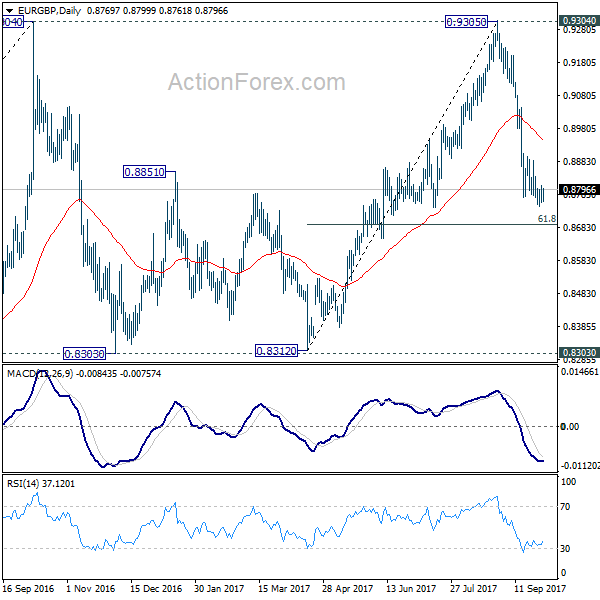
With 0.8884 minor resistance intact, deeper decline is expected in EUR/GBP for 61.8% retracement of 0.8312 to 0.9305 at 0.8691 and below. Fall from 0.9305 is seen as the third leg of consolidation pattern from 0.9304. We'll look for bottoming signal again at it approaches 0.8303 support. Meanwhile, break of 0.8884 will indicate short term bottoming and turn intraday bias back to the upside for 55 day EMA (now at 0.8951).
In the bigger picture, price actions from 0.9304 are viewed as a medium term corrective pattern. It's still in progress with fall from 0.9305 as the third leg. Break of 0.8303 could be seen. But we'd expect strong support from 0.8116 cluster support (50% retracement of 0.6935 to 0.9304 at 0.8120) to contain downside. Whole up trend from 0.6935 is expected to resume after consolidation from 0.9304 completes.
Elliott Wave View: AUDJPY
AUDJPY Short Term Elliott Wave view suggests that the rally to 90.31 ended Intermediate wave (W). Intermediate wave (X) pullback remains in progress as a double three Elliott Wave structure. Down from 90.31, Minor wave W ended at 88.44 and Minor wave X ended at 89.68. Minor wave Y is unfolding also as a double three Elliott Wave structure. Minute wave ((w)) of Y ended at 88.23 and Minute wave ((x)) of Y is proposed complete at 88.89. Near term, while bounces stay below 9/25 peak at 89.69, expect pair to extend lower towards 87.37 – 87.8` area to complete Intermediate wave (X). Afterwards, pair should resume the rally to a new high or at least bounce in 3 waves. We don’t like selling the proposed pullback.
AUDJPY 1 Hour Elliottwave Chart
Double three ( 7 swings) is the most important pattern in Elliott wave’s new theory. It is also probably the most common pattern in the market these days. Double three is also known as a 7-swing structure. It is a very reliable pattern that gives traders a good opportunity to trade with a well-defined level of risk and target areas. The image below shows what Elliott Wave Double Three looks like. It has labels (W), (X), (Y) and an internal structure of 3-3-3. This means that all 3 legs has corrective sequences. Each (W) and (Y) is formed by 3 wave oscillations and has a structure of A, B, C or W, X, Y of smaller degrees.
Trade Idea : USD/JPY – Stand aside
USD/JPY - 112.59
Most recent candlesticks pattern : N/A
Trend : Up
Tenkan-Sen level : 112.52
Kijun-Sen level : 112.73
Ichimoku cloud top : 112.84
Ichimoku cloud bottom : 112.38
New strategy :
Stand aside
Position : -
Target : -
Stop : -
Despite falling to 112.38 yesterday, lack of follow through selling and the subsequent rebound suggest further consolidation would take place and recovery to 112.85-90 cannot be ruled out, however, price should falter below indicated resistance at 113.26, bring another retreat later, below said support at 112.38 would signal top has been formed at 113.26, bring retracement of recent rise to 112.00, then 111.75-80 but previous support at 111.47 should remain intact.
On the upside, whilst recovery to 112.85-90 cannot be ruled out, reckon said resistance at 113.26 would hold and bring further consolidation. Only a break of said this week’s high at 113.26 would revive bullishness and signal recent upmove has resumed, then further gain to previous resistance at 113.58 would follow but loss of upward momentum should prevent sharp move beyond 113.75-80 and reckon 114.00-10 would remain intact. As near term outlook is mixed, would be prudent to stand aside for now.

Euro Area HICP Figures For September
Market movers today
The final day of the week brings a packed calendar, with several tier-1 releases both globally and in the Scandies. Also, we might get news on the next Riksbank governor. In addition, quarter-end volatility will be a theme today in many markets.
In the Scandies, focus turns to the labour market and retail sales in Norway. Also, in Sweden reports suggest that the next Riksbank governor will be announced today. See Scandi markets on page 2 for more details.
In the euro area, euro area HICP figures for September are set for release. Following yesterday's inflation release in Spain and Germany, we still look for euro area inflation at 1.6% but with the weak service price inflation release in Germany, there is some downside risk to our euro area core inflation forecast of 1.3%. Instead, the increase to 1.6% in September might be driven more by the volatile components energy and food, if similar inflation trends are observed as in Germany. We also get data on German retail sales in August and the German unemployment rate.
In the US, we get the most important release of the week namely PCE inflation for August . We estimate a slight uptick in the monthly increases of both PCE headline and PCE core following the release of the surprisingly high increase in CPI (CPI and PCE numbers tend to follow each other). The monthly increase in the CPI numbers leads us to believe the PCE headline will increase 0.3% m/m (1.5% y/y versus 1.4% in July) and PCE core 0.2% m/m (1.4% y/y versus 1.4% in July). Note that although this relatively strong monthly print in the PCE core does not lead to increases in the yearly rate, this has to do with a very large monthly increase in August 2016. We also get the final University of Michigan consumer confidence. The preliminary number showed a fall compared with August but the index is still at a high level, pointing to solid growth in private consumption. The Chicago manufacturing PMI for September is also due for release.
In the UK, focus turns to Bank of England Governor Mark Carney speaking alongside the final release of second-quarter GDP.
Selected market news
No clear direction on Asian equity markets this morning, despite the move higher in most European and US indices yesterday. Japanese equit ies are trading in the ‘red', amid Japanese inflation moving higher (CPI excluding fresh food at 0.5% y/y). However, there are still no indications of inflation reaching the Bank of Japan's inflation target any time soon , suggesting a continuation of current policy should the forthcoming elections not challenge ‘Abenomics'.
There is still a lot of market focus on a potential tax reform in the US. Meanwhile, we still think the most likely outcome will be a smaller tax reform or no deal at all. We also emphasise that any easier fiscal policy could well be offset by tighter monetary policy . This is so even if uncertainty remains high on what the Fed Board of Governors will look like next year, with President Donald Trump potentially having to nominate five members
Market Update – Asian Session: US Sept Chicago PMI Data And Central Bank Speak In Focus
Asia Summary
Asian equities have traded mixed on today's session. Overall, trading has been fairly quiet amid the batch of data seen out of Japan and South Korea. Looking ahead, Euro Zone Sept Preliminary CPI is due to be released along with the US Sept Chicago PMI data. Central bank speak is also on the agenda with comments expected from the BoE's Carney, ECB's Draghi and Fed's Harker.
China offshore yuan (CNH) money market rates rise sharply ahead of upcoming National Day Golden Week holidays, as Chinese markets will be closed next week.
Key economic data
(AU) AUSTRALIA AUG PRIVATE SECTOR CREDIT M/M: 0.5% V 0.5%E; Y/Y: 5.5% V 5.5%E
(JP) JAPAN AUG NATIONAL CPI Y/Y: 0.7% V 0.6%E; CORE (EX-FRESH FOOD) Y/Y: 0.7% V 0.7%E
(JP) JAPAN SEPT TOKYO CPI Y/Y: 0.5% V 0.6%E; CORE (EX-FRESH FOOD) Y/Y: 0.5% V 0.5%E
(JP) JAPAN AUG PRELIM INDUSTRIAL PRODUCTION M/M: 2.1% V 1.8%E; Y/Y: 5.4% V 5.2%E
(JP) JAPAN AUG JOBLESS RATE: 2.8% V 2.8%E; JOB-TO-APPLICANT RATIO: 1.52 V 1.53E
(JP) JAPAN AUG RETAIL SALES M/M: -1.7% V -0.5%E; RETAIL TRADE Y/Y: 1.7% V 2.5%E
(JP) JAPAN AUG OVERALL HOUSEHOLD SPENDING: 0.6% V 0.9%E
(KR) SOUTH KOREA AUG INDUSTRIAL PRODUCTION M/M: 0.4% V 0.5%E; Y/Y: 2.7% V 1.3%E
(KR) SOUTH KOREA AUG BOP CURRENT ACCOUNT BALANCE: $6.06B V $7.26B PRIOR; GOODS BALANCE: $9.31B V $10.7B PRIOR
(KR) South Korea Aug Cyclical Leading Index: 0.0 v 0.2 prior
(KR) South Korea Oct Business Manufacturing Survey: 79 v 83 prior; Non-Manufacturing Survey: 78 v 78 prior
(NZ) New Zealand Aug Building Permits m/m: 10.2% v 1.7% prior
(NZ) RBNZ 2017 Annual Report: New Zealand's economy and financial system are sound
(UK) UK SEPT GFK CONSUMER CONFIDENCE: -9 V -11E
(UK) UK Sept Lloyds Business Barometer: 23 v 17 prior
Speakers and Press
China
(CN) China Premier Li Keqiang said to stay for another term - HK Press
(CN) China Investment Corp (CIC) said to end Aug with assets over $900B - Chinese Press
(CN) China said to raise fuel prices from Sept 30th
Other
(JP) BoJ Sept Meeting Minutes: One member said more easing is necessary to stimulate demand**Note: At the Sept BoJ meeting, the incoming member Kataoka was the lone dissenter (8 to 1 vote). The official said then that the yield curve control is not enough to meet the inflation target; Also, the official saw a low chance of CPI increasing from 2018.
(JP) Japan Fin Min Aso: Confirms need to delay FY2020 primary balance target ‘a bit'
(KR) South Korea Finance Ministry: Affirms sees 2017 GDP growth at 3%; To continue to monitor global financial markets during 10-day holidays; Uncertainty high ahead of North Korea's party foundation day on Oct 10th.
(KR) South Korea Financial Regulator: Bans all forms of initial coin offerings in the country
Asian Equity Indices/Futures (00:30ET)
Nikkei -0.1%, Hang Seng +0.2%, Shanghai Composite +0.3%%, ASX200 +0.2%, Kospi +0.7%
Equity Futures: S&P500 flat; Nasdaq +0.1% , Dax flat , FTSE100 flat
FX ranges/Commodities/Fixed Income (00:30ET)
EUR 1.1776-1.1791; JPY 112.27-112.69; AUD 0.7839-0.7858; NZD 0.7208-0.7238
Aug Gold -0.1% at 1,287/oz; Aug Crude Oil -0.1% at $51.51/brl; Sept Copper -0.1% at $2.975/lb
GLD SPDR Gold Trust ETF daily holdings flat at 864.7 metric tons
(CN) China PBOC sets yuan reference rate at 6.6369 v 6.6285 prior
(CN) PBOC OMO: SKIPS V INJECTED CNY70B IN 14 AND 28-DAY REVERSE REPOS PRIOR; net drain CNY160B
(AU) Australia sells A$800M in 2028 Bonds, avg yield 2.8913%, bid to cover 5.43x
(NZ) New Zealand sells NZ$150M in 3.5% April 2033 Bonds, avg yield 3.2958%, implied bid to cover 3.33x
Equities notable movers
Australia
Pilbara Minerals, PLS.AU China's Great Wall Motor to give update on plan to buy up to 3.5% stake; +18%
Japan
Yamato Holdings, 9064.JP Some disappointment with medium term outlook; -5.5%
US markets on close: Dow +0.2%, S&P500 +0.1%, Nasdaq flat, Russell +0.3%
Best Sector in S&P500: Real Estate +0.7%
Worst Sector in S&P500: Consumer Discretionary -0.1%
At the close: VIX 9.55 (-0.32 pts); Treasuries: 2-yr 1.459% (-2bps), 10-yr 2.312% (flat), 30-yr 2.871% (+1bp)
US Market Summary
US stocks rallied off of opening lows to end the day about flat, after US GDP and jobless claims data were largely in line with expectations and as Republicans continued to make their case for tax cuts. Treasury yield curves saw steepening trades remain entrenched, with long rates extending modestly higher after a strong 7-year note sale. The Dollar index broke a three-day winning streak but the giveback was benign. The US IPO market heated up with four NASDAQ issues opening for trade including a 50% pop for Roku. Materials and healthcare names were outperformers on the day, while consumer discretionary and industrials lagged slightly.
US Afterhours Movers
ATEN Raises Q3 Rev $59-60M v $55.6Me (prior $53-57M); EVP sales to leave company; +24.8% afterhours
SGH Reports Q4 $0.79 v $0.64e, Rev $223.0M v $211Me; Guides Q1 $0.79-0.83 v $0.68e, Rev $225-240M v $211Me, gross margin 21-22%; +6.7% afterhours
TSN Raises FY17 $5.20-5.30 v $5.09e (prior $4.95-5.05); plans to reduce headcount by ~450 positions; +4.9% afterhours
HLT Files to sell 14.6M shares by holder Blackstone (4.5% of shares outstanding) via GS: -1.4% afterhours
PRTA Reports results from Phase 1b multiple ascending dose study of PRX003 in patients with Psoriasis; Prerequisites were not met; -5.5% afterhours
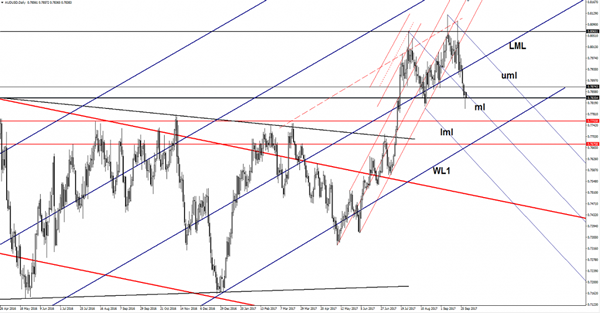
AUD/USD More Downside In View
Price drops again after the yesterday’s rebound. The pair had come back to retest the median line (ml) of the minor descending pitchfork and now tries to resume the bearish movement. A further drop will be confirmed after a valid breakdown below the 0.7835 static support. The major downside target will be at the WL1, it could also be attracted by the lower median line (lml) of the descending pitchfork.