
Sample Category Title
USD/JPY Daily Outlook
Daily Pivots: (S1) 112.17; (P) 112.44; (R1) 112.75; More...
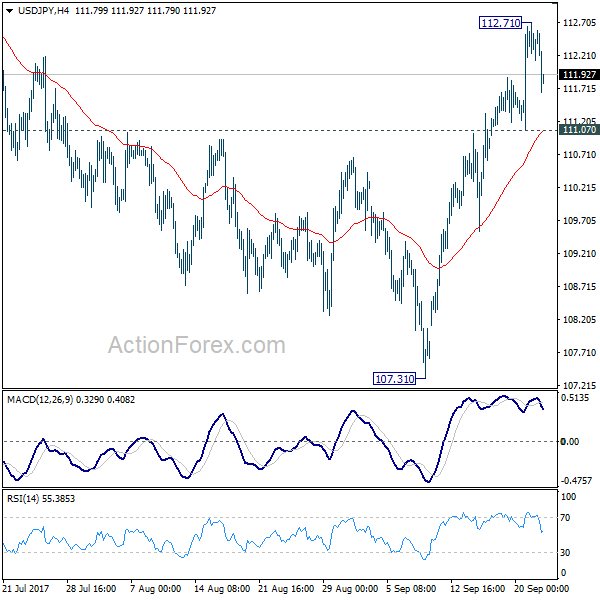
USD/JPY's retreat suggests that a temporary top is in place at 112.71. Intraday bias is turned neutral first. Further rally is in favor as long as 111.07 support holds. Sustained break of medium term channel resistance (now at 113.03) will argue that whole correction from 118.65 has completed too. In that case, further rise should be seen to 114.49 resistance for confirmation. However, break of 111.07 minor support will raise the risk of rejection from channel resistance and turn bias back to the downside for 55 day EMA (now at 110.58).
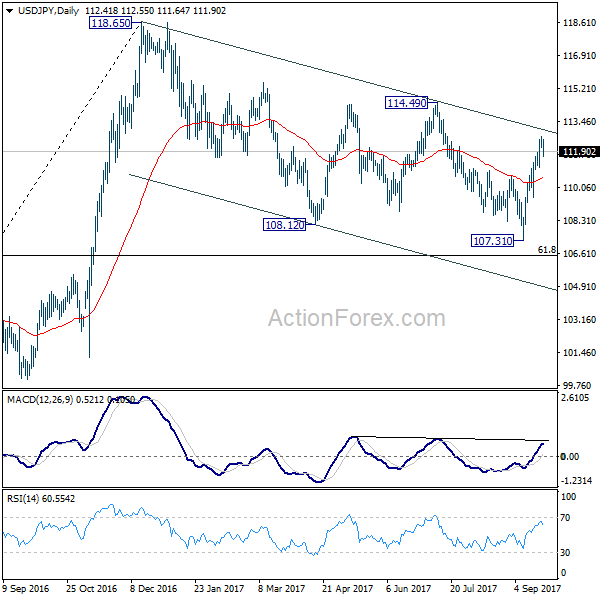
In the bigger picture, rise from 98.97 (2016 low) is seen as the second leg of the corrective pattern from 125.85 (2015 high). It's unclear whether this this second leg has completed at 118.65 or not. But medium term outlook will be mildly bearish as long as 114.49 resistance holds. And, there is prospect of breaking 98.97 ahead. Meanwhile, break of 114.49 will bring retest of 125.85 high. But even in that case, we don't expect a break there on first attempt.
Yen Higher as Geopolitics Back in Focus, North Korea Threatens Hard-Line Countermeasures to Mentally Deranged Trump
Yen recovers broadly today while Asian equities are trading generally lower as geopolitics is back haunting the markets. Tensions between North Korea and the US escalated again this week after US President Donald Trump's threat of "total destruction". This was followed by an executive order by Trump to forcefully push through trade embargo with North Korea. Then, North Korea responded by pledging to strike back with with countermeasures, including the use of hydrogen bomb. Dollar is mixed today as the boost from FOMC faded. Aussie and Kiwi are under much pressure. Aussie is still feeling heavy after China rate downgrade. Kiwi is cautious ahead of election in the weekend. On the other hand, Euro is staying firm ahead of Germany election on Sunday. Sterling is mixed a UK Prime Minister Theresa May's high profile Brexit speech is awaited.
North Korea threatens countermeaure on mentally deranged Trump
North Korea leader Kim Jong-Un issued a rate 500 word statement, striking back at Trump's speech at the United Nations. Kim called Trump a "mentally deranged U.S. dotard" who is "arousing worldwide concern." And, "after taking office Trump has rendered the world restless through threats and blackmail against all countries in the world." Kim further criticized Trump is "unfit to hold the prerogative of supreme command of a country, and he is surely a rogue and a gangster fond of playing with fire, rather than a politician." Kim warned of the "highest level of hard-line countermeasure in history". And this counter measures is seen by many as a sign of launching a hydrogen bomb in the Pacific Ocean.
Trump to unilaterally force through trade embargo on North Korea
Trump issued a new executive order yesterday targeting North Korea. The Treasury Department is granted authority to penalize any company or person doing business with North Korea. Their access to the US financial system could be cut off and assets could be freezed. The executive order now open the door for the US to unilaterally enforce a trade embargo against North Korea, and force any country in the world to join it. But it remains to be seen whether this would be implemented equally, or just selectively. China is known to have a blind eye of smuggling between itself and North Korea. And Trump has been relatively very quiet on trade between Russia and North Korea. Trump said that "North Korea's nuclear program is a grave threat to peace and security in our world, and it is unacceptable that others financially support this criminal, rogue regime." Trump also said that the Chinese central bank has requested banks to immediately stop doing business with North Korea too.
WTI steady at around 50 as oil producers meet
WTI Crude oil is steady at around 50 as OPEC and some non-OPEC producers, including Russia and Oman, are meeting today. The market hoped that they would discuss potential extension of the output cut deal. The existing deal aiming at curbing production of 1.2M bpd would end in March 31. Compliance of the current deal would also be assessed. According to Kuwaiti Oil Minister Essam al-Marzouq, the compliance was improving and was above 100%. Meanwhile, a technical committee of OPEC and non-OPEC indicated that the compliance in August was 116% (meaning producers cut output more than required), up from 94% in July.
The producers are, however, divided in whether the deal extension would be discussed. Russian Energy Minister Alexander Novak noted that it is "still too early to talk about concrete timing of extending". However, Algerian Energy Minister Mustapha Guitouni indicated in an interview by a state-run press service that they would discuss the matter, while Iraq's Oil Minister Jabbar Al-Luaibi had also noted earlier this week that some members were discussing.
S&P downgraded China to A+
Yesterday, S&P's announced that it has cut China's sovereign rating, for the first time since 1999, by one notch to A+. The credit rating agency stated that "China's prolonged period of strong credit growth has increased its economic and financial risks". Although "this credit growth had contributed to strong real gross domestic product growth and higher asset prices, we believe it has also diminished financial stability to some extent". Back in May, another top-tiered rating agency, Moody's downgraded the country's sovereign rating to A1 from Aa3 amidst rising default risks. The top 3 agencies now have the same sovereign rating for China, as Fitch's had put it at that level already in 2013. S&P's decision has big repercussion on Australian dollar which slumped to a 3-week low against US dollar and a one-month low against New Zealand dollar. As Australia's biggest trading partner, China has been importing most of Australia's raw materials, in particular iron ores.
On the data front
Eurozone PMIs are the main focuses in European session. Later in the data, Canadian data will take center stage with CPI and retail sales featured. Also, UK Prime Minister Theresa May will deliver her high profile Brexit speech in Italy.
In the weekend - New Zealand and Germany elections
The upcoming New Zealand election would be a tight race between the incumbent National Party and Labor Party. Opinion polls suggest that supports for both parties are at around 40%. As such none of them would be able to a form government without entering coalition with smaller parties. This is such uncertainty that has increased the volatility of New Zealand dollar of late. Maintaining the status quo – a minority government led by Nationals- would be the most NZD-favorable while a Labor + Green+ NZ First trio would lead to an immediate, but short-term selloff in the currency. More in New Zealand Election: Change in Government is NZD-Negative in Near-Term
Although Chancellor Angela Merkel's Christian Democratic Union (CDU) and its sister party, the Christian Socialist Union (CSU), have been comfortably leading in polls. There still are a number of uncertainties in the upcoming German election. While Merkel is on the way to be the Chancellor for a fourth, and the last, term, her party is unlikely to form a government without forming coalition with other party(ies). While the Grand Coalition (CDU/CSU+SPD as the junior partner), just like the one we have had since 2013 and between 2005-2009, is the most favorable to the economy and the financial markets, it cannot be seen as a done deal. Meanwhile, rising supports for the populist Alternative for Germany (AfD) signal that a far-right party would enter the parliament for the first time since WWII. AfD has pledged to promote its anti-EU and anti-immigrants rhetoric in the parliament as it might probably become the biggest opposition party in case of a Grand Coalition. Moreover, the parliament is prone to be more fragmented with six parties in 2017-term, compared with four previously. More in German Election: Not as Boring as You Think
USD/JPY Daily Outlook
Daily Pivots: (S1) 112.17; (P) 112.44; (R1) 112.75; More...
USD/JPY's retreat suggests that a temporary top is in place at 112.71. Intraday bias is turned neutral first. Further rally is in favor as long as 111.07 support holds. Sustained break of medium term channel resistance (now at 113.03) will argue that whole correction from 118.65 has completed too. In that case, further rise should be seen to 114.49 resistance for confirmation. However, break of 111.07 minor support will raise the risk of rejection from channel resistance and turn bias back to the downside for 55 day EMA (now at 110.58).
In the bigger picture, rise from 98.97 (2016 low) is seen as the second leg of the corrective pattern from 125.85 (2015 high). It's unclear whether this this second leg has completed at 118.65 or not. But medium term outlook will be mildly bearish as long as 114.49 resistance holds. And, there is prospect of breaking 98.97 ahead. Meanwhile, break of 114.49 will bring retest of 125.85 high. But even in that case, we don't expect a break there on first attempt.
Economic Indicators Update
| GMT | Ccy | Events | Actual | Forecast | Previous | Revised |
|---|---|---|---|---|---|---|
| 07:00 | EUR | France Manufacturing PMI Sep P | 55.5 | 55.8 | ||
| 07:00 | EUR | France Services PMI Sep P | 54.8 | 54.9 | ||
| 07:30 | EUR | Germany Manufacturing PMI Sep P | 59 | 59.3 | ||
| 07:30 | EUR | Germany Services PMI Sep P | 53.8 | 53.5 | ||
| 08:00 | EUR | Eurozone Manufacturing PMI Sep P | 57.2 | 57.4 | ||
| 08:00 | EUR | Eurozone Services PMI Sep P | 54.8 | 54.7 | ||
| 10:00 | GBP | CBI Trends Total Orders Sep | 13 | 13 | ||
| 12:30 | CAD | CPI M/M Aug | 0.20% | 0.00% | ||
| 12:30 | CAD | CPI Y/Y Aug | 1.50% | 1.20% | ||
| 12:30 | CAD | CPI Core - Common Y/Y Aug | 1.40% | |||
| 12:30 | CAD | CPI Core - Trim Y/Y Aug | 1.30% | |||
| 12:30 | CAD | CPI Core - Median Y/Y Aug | 1.70% | |||
| 12:30 | CAD | Retail Sales M/M Jul | 0.30% | 0.10% | ||
| 12:30 | CAD | Retail Sales Less Autos M/M Jul | 0.50% | 0.70% | ||
| 13:45 | USD | US Manufacturing PMI Sep P | 53 | 52.8 | ||
| 13:45 | USD | US Services PMI Sep P | 55.9 | 56 |
RBA Far From Considering An Imminent Interest Rate Hike: RBA’s Lowe
For the 24 hours to 23:00 GMT, the AUD declined 1.28% against the USD and closed at 0.7927.
Yesterday, the Reserve Bank of Australia (RBA) Governor, Philip Lowe, stated that rising global interest rates have no automatic implications for Australia and added that the central bank is in no hurry to consider an interest rate hike in the near-term.
LME Copper prices declined 1.7% or $112.5/MT to $6407.5/MT. Aluminium prices declined 0.5% or $10.0/MT to $2154.0/MT.
In the Asian session, at GMT0300, the pair is trading at 0.7926, with the AUD trading slightly lower against the USD from yesterday's close.
The pair is expected to find support at 0.7886, and a fall through could take it to the next support level of 0.7846. The pair is expected to find its first resistance at 0.7988, and a rise through could take it to the next resistance level of 0.8050.
The currency pair is trading below its 20 Hr and 50 Hr moving averages.

Euro-Zone’s Consumer Morale Hit A 16-Year High In September
For the 24 hours to 23:00 GMT, the EUR rose 0.41% against the USD and closed at 1.1940, on the back of a surprise improvement in the Euro-zone's consumer sentiment.
Data indicated that the Euro-zone's flash consumer confidence index unexpectedly climbed to a level of -1.2 in September, notching its highest level since April 2001 and suggesting that consumers were turning more optimistic in the light of robust economic recovery in the common currency region. Market had expected the index to remain steady at a level of -1.5.
Even though the ECB, in its economic bulletin report, highlighted the healthy growth in the Euro-bloc's economy, the central bank commented that the robust recovery was unable to translate into stronger inflation, making it necessary to maintain the ultra-loose monetary policy stimulus.
Macroeconomic data released in the US showed that initial jobless claims surprisingly fell to a level of 259.0K in the week ended 16 September, defying market consensus for a rise to a level of 302.0K. In the previous week, initial jobless claims had registered a revised level of 282.0K. Moreover, the nation's leading indicator advanced 0.4% in August, surpassing market expectations for an advance of 0.3%. In the prior month, leading indicator had recorded a rise of 0.3%. Further, the nation's Philadelphia Fed manufacturing index unexpectedly rose to a level of 23.8 in September, compared to a level of 18.90 in the prior month. Markets were anticipating the index to drop to a level of 17.1.
In the Asian session, at GMT0300, the pair is trading at 1.1957, with the EUR trading 0.14% higher against the USD from yesterday's close.
The pair is expected to find support at 1.1899, and a fall through could take it to the next support level of 1.1840. The pair is expected to find its first resistance at 1.1988, and a rise through could take it to the next resistance level of 1.2018.
Going ahead, investors will direct their attention to the flash Markit manufacturing and services PMIs for September across the Euro-zone, slated to release in a few hours. Moreover, the US preliminary manufacturing and services PMIs for September, due to release later today, will also keep investors on their toes.
The currency pair is trading above its 20 Hr and 50 Hr moving averages.

UK Public Sector Net Borrowing Posted A Deficit In August
For the 24 hours to 23:00 GMT, the GBP rose 0.48% against the USD and closed at 1.3571.
On the macro front, Britain’s public sector net borrowing posted a less-than-expected deficit of £5.1 billion in August, following a revised surplus of £1.3 billion in the prior month. Investors had envisaged the public sector net borrowing to record a deficit of £6.4 billion.
In the Asian session, at GMT0300, the pair is trading at 1.3582, with the GBP trading 0.08% higher against the USD from yesterday’s close.
The pair is expected to find support at 1.3506, and a fall through could take it to the next support level of 1.3431. The pair is expected to find its first resistance at 1.3622, and a rise through could take it to the next resistance level of 1.3663.
Moving ahead, traders would eye a speech by the British Prime Minister, Theresa May, slated in a few hours.
The currency pair is trading above its 20 Hr and 50 Hr moving averages.

Japanese Yen Reverses Its Losses In The Morning Session
For the 24 hours to 23:00 GMT, the USD rose 0.1% against the JPY and closed at 112.47.
In the Asian session, at GMT0300, the pair is trading at 111.70, with the USD trading 0.68% lower against the JPY from yesterday’s close.
The pair is expected to find support at 111.33, and a fall through could take it to the next support level of 110.95. The pair is expected to find its first resistance at 112.40, and a rise through could take it to the next resistance level of 113.09.
Next week, investors would look forward to Japan’s national consumer price index, jobless rate, flash Nikkei manufacturing PMI and the small business optimism index.
The currency pair is trading below its 20 Hr moving average and showing convergence with its 50 Hr moving average.

Switzerland’s Trade Surplus Shrunk In August
For the 24 hours to 23:00 GMT, the USD rose 0.07% against the CHF and closed at 0.9707.
In economic news, data revealed that Switzerland's trade surplus narrowed to a level of CHF2.17 billion in August, as imports grew faster than exports. The nation registered a revised surplus of CHF3.49 billion in the previous month.
Separately, the State Secretariat for Economic Affairs (SECO) lowered Switzerland's economic growth forecast to 0.9% for this year, down from 1.4% projected earlier.
In the Asian session, at GMT0300, the pair is trading at 0.9671, with the USD trading 0.37% lower against the CHF from yesterday's close.
The pair is expected to find support at 0.9643, and a fall through could take it to the next support level of 0.9616. The pair is expected to find its first resistance at 0.9723, and a rise through could take it to the next resistance level of 0.9776.
The currency pair is trading below its 20 Hr moving average and showing convergence with its 50 Hr moving average

Loonie Trading On A Stronger Footing, Ahead Of Canada’s Inflation Data
For the 24 hours to 23:00 GMT, the USD marginally declined against the CAD and closed at 1.2329.
In the Asian session, at GMT0300, the pair is trading at 1.2314, with the USD trading 0.12% lower against the CAD from yesterday's close.
The pair is expected to find support at 1.2294, and a fall through could take it to the next support level of 1.2274. The pair is expected to find its first resistance at 1.2351, and a rise through could take it to the next resistance level of 1.2388.
Moving ahead, market participants will keep a close watch on Canada's inflation figures for August as well as retail sales data for July, both due to release later today.
The currency pair is trading below its 20 Hr moving average and showing convergence with its 50 Hr moving average.

European Open Briefing: Equity Markets Across The Asia-Pacific Region Were Down On Friday
Global Markets:
- Asian stock markets: Nikkei down 0.34 %, Shanghai Composite fell 0.48 %, Hang Seng dropped 0.91 %, ASX 200 rose 0.34 %
- Commodities: Gold at $1301.52 (+0.14 %), Silver at $17.11 (+0.53 %), WTI Oil at $50.62(+0.56 %), Brent Oil at $56.41 (+0.14 %)
- Rates: US 10-year yield at 2.25, UK 10-year yield at 1.37, German 10-year yield at 0.45
News & Data:
- (GBP) Public Sector Net Borrowing 5.1 B vs 6.5 B expected
- (CAD) Wholesale Sales m/m 1.5 % vs -0.7 % expected
- (USD) Unemployment Claims 259 K vs 302 K expected
- (USD) Philly Fed Manufacturing Index 23.8 vs 17.3 expected
- (USD) CB Leading Index m/m 0.4 % vs 0.3 % expected
- (USD) Natural Gas Storage 97 B vs 93 B expected
- U.S. jobless claims fall; hurricanes still affecting data – RTRS
- S&P downgrades China, says rising debt is stoking economic, financial risks – WSJ
- "I will surely and definitely take the mentally deranged U.S. dotard with fire"- North Korean leader Kim Jong-un saying of Trump
Markets Update:
Equity markets across the Asia-Pacific region were down on Friday, with stocks in Japan reversing early gains after a report that North Korea could respond to fresh sanctions with a hydrogen bomb in the Pacific. While China-related stocks declined on a credit-rating downgrade. The yen and gold advanced.
USDJPY is currently seen trading around 111.79 as The Japanese yen gained over 0.7 percent against the US dollar, advancing the most in more than two weeks as the pair traded down to lows of 111.65 booking 50+ point loss on the session. Similar to the USDJPY, all Yen crosses were generally lower.
AUDUSD continued its down trend dropping down as low as 0.7910 and is currently seen trading at 0.7925 after recovering partially. The Australian dollar added to losses triggered by a tumble in iron ore prices and dovish language from the nation’s central bank governor. The Aussie lost 0.1 percent against the US Dollar earlier in the session, this is in continuation to the 1.3 percent drop seen on Thursday.
EUR/USD is currently seen trading steadily around 1.1958 as the Euro added 0.1 percent against the US Dollar. However, the Euro is still 0.8 percent lower for the week overall. The dollar index, which tracks the dollar against a basket of currencies is down 0.2 percent and is currently valued at 92.01.
Upcoming Events:
- All Day – (NZD) Parliamentary Elections
- 07:00 GMT – (EUR) French Flash Manufacturing PMI
- 07:00 GMT – (EUR) French Flash Services PMI
- 07:30 GMT – (EUR) German Flash Manufacturing PMI
- 07:30 GMT – (EUR) German Flash Services PMI
- 08:00 GMT – (EUR) Flash Manufacturing PMI
- 08:00 GMT – (EUR) Flash Services PMI
- 12:30 GMT – (CAD) CPI m/m
- 12:30 GMT – (CAD) Core Retail Sales m/m
- 12:30 GMT – (CAD) Common CPI y/y
- 12:30 GMT – (CAD) Median CPI y/y
- 12:30 GMT – (CAD) Retail Sales m/m
- 12:30 GMT – (CAD) Trimmed CPI y/y
Daily Technical Outlook And Review: EUR/USD, GBP/USD, AUD/USD, USD/JPY, USD/CAD, USD/CHF, DOW 30, GOLD
A note on lower timeframe confirming price action...
Waiting for lower timeframe confirmation is our main tool to confirm strength within higher timeframe zones, and has really been the key to our trading success. It takes a little time to understand the subtle nuances, however, as each trade is never the same, but once you master the rhythm so to speak, you will be saved from countless unnecessary losing trades. The following is a list of what we look for:
- A break/retest of supply or demand dependent on which way you're trading.
- A trendline break/retest.
- Buying/selling tails ... essentially we look for a cluster of very obvious spikes off of lower timeframe support and resistance levels within the higher timeframe zone.
- Candlestick patterns. We tend to only stick with pin bars and engulfing bars as these have proven to be the most effective.
We typically search for lower-timeframe confirmation between the M15 and H1 timeframes, since most of our higher-timeframe areas begin with the H4. Stops are usually placed 1-3 pips beyond confirming structures.
EUR/USD
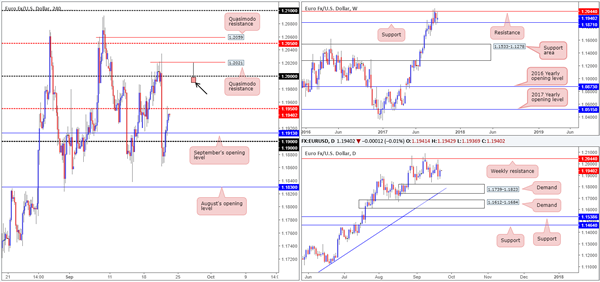
The value of the EUR strengthened on Thursday, consequently erasing 50% of Wednesday’s Fed-induced losses. As the US dollar found refuge beneath USDX weekly resistance at 11854, the single currency conquered both the 1.19 handle and September’s opening level at 1.1913, allowing H4 price to shake hands with the mid-level resistance marked at 1.1950.
Aside from dollar shorts, we also believe this recent upsurge may be a product of buyers defending weekly support at 1.1871, alongside the pair trading in-line with the overall trend. With this in mind, and assuming 1.1950 is consumed today, the unit will likely gravitate north to reconnect with the large psychological band 1.20.
For those considering shorts from 1.20, be prepared for the possibility of a fakeout. Directly above sits a H4 Quasimodo resistance at 1.2021, shadowed closely by weekly resistance at 1.2044. Both levels, in our opinion, are ideal candidates to help facilitate a fakeout above 1.20.
Suggestions: Instead of placing sell orders at 1.20, we will be looking for evidence that a fakeout has taken place before pulling the sell trigger. An ideal scenario would be for H4 price to print a bearish selling wick (as drawn on the chart) that pierces through 1.20, taps the noted H4 Quasimodo and closes lower. Should this trade come to fruition, stops are to be placed above the fakeout candle’s wick and the initial take-profit level would be 1.1950.
Data points to consider: EUR Manufacturing figures released between 8-9am; ECB President Draghi speaks at 9am GMT+1.
Levels to watch/live orders:
- Buys: Flat (stop loss: N/A).
- Sells: 1.20 region ([waiting for a fakeout of this number is advised before selling] stop loss: ideally beyond the fakeout candle’s wick).
GBP/USD
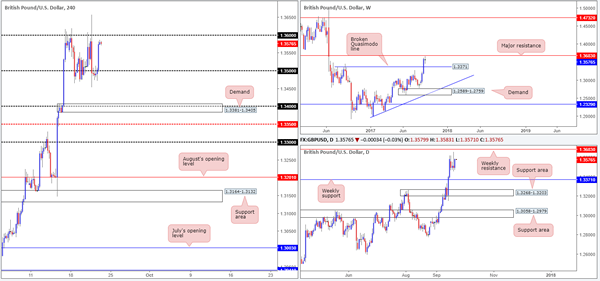
From the weekly timeframe this morning, we can clearly see that the buyers and sellers remain undecided as price trades mid-range amid resistance at 1.3683 and a broken Quasimodo line coming in at 1.3371.
Across on the H4 timeframe price briefly found refuge beneath the 1.35 handle during London’s morning segment yesterday, even printing a reasonably nice-looking bearish selling wick. That was, of course, until the US buyers entered the fray, taking price up to highs of 1.3581 in one fell swoop.
Sellers, in our humble view, are very likely weak around the nearby 1.36 handle – just take a look at the size of Wednesday’s Fed-induced whipsaw through this psychological boundary! It is doubtful any sellers here survived that move.
Suggestions: Put simply, with USDX weekly sellers trading from resistance at 11854, and GBP weekly chart showing room to advance as far as resistance at 1.3683, a long above the 1.36 handle could be an option today. To take advantage of this potential move north, one could either buy the breakout or conservatively wait to see if price retests 1.36 as support, and buy on the condition that H4 price chalks up a reasonably sized H4 bull candle in the shape of a full, or near-full-bodied candle.
Data points to consider: UK Prime Minister May speaks sometime today.
Levels to watch/live orders:
- Buys: Watch for H4 price to engulf 1.36 and then look to trade any retest seen thereafter ([waiting for a reasonably sized H4 bullish candle to form following the retest – preferably a full, or near-full-bodied candle – is advised] stop loss: ideally beyond the candle’s tail).
- Sells: Flat (stop loss: N/A).
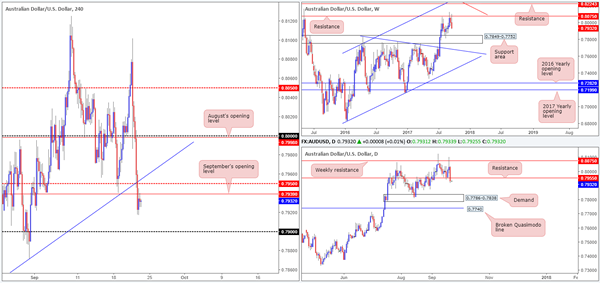
AUD/USD:
During the course of yesterday’s sessions, the commodity currency continued to sag against the US dollar following RBA’s Lowe’s speech at the American Chamber of Commerce in Australia. The move, as you can see, ended with H4 price running through bids at September’s opening level drawn from 0.7939, which is now acting resistance.
From a technical standpoint, it is highly likely that the Aussie will resume downside today at least until the pair reaches the 0.79 handle. This is largely due to weekly price showing room to extend down to a support area at 0.7849-0.7752, and daily price recently closing below support at 0.7955 (now acting resistance).
Suggestions: To trade from 0.7939, a stop not exceeding 15 pips is required should you target 0.79 to take profits. This will then provide at least two times one’s risk should the trade achieve its target. To find such a small stop from a H4 level, we would advise drilling down to the lower timeframes and looking to pin down a setup from that region (see the top of this report for ideas on how to utilize lower-timeframe action).
Data points to consider: No high-impacting news on the docket today.
Levels to watch/live orders:
- Buys: Flat (stop loss: N/A).
- Sells: 0.7939 region ([waiting for lower-timeframe confirmation to form is advised] stop loss: dependent on where one confirms the area).
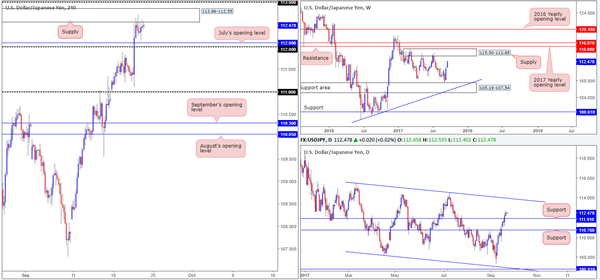
USD/JPY
Although the USD/JPY pair posted a gain on Thursday, H4 price action was relatively subdued around the underside of supply penciled in at 112.86-112.55.The highly anticipated BoJ meeting turned out to be a non-event, after the bank decided to leave its monetary policy unchanged.
Looking over to the weekly timeframe, we can clearly see the bulls look poised to challenge the supply area at 115.50-113.85. In conjunction with the weekly timeframe, daily price recently crossed above resistance coming in at 111.91 and shows little resistance stopping price from reaching trendline resistance extended from the high 115.50 (intersects with the aforementioned weekly supply area).
Suggestions: To our way of seeing things, the only barrier bolstering the current H4 supply is the weekly USDX resistance at 11854. Both the weekly and daily charts on the USD/JPY, however, suggest further buying is likely to take place. In addition to this, we have July’s opening level at 112.09, followed closely by the 112 handle lurking just below the current supply! Therefore, we will not be taking shorts in this market right now.
A break above the current H4 supply area would, as far as we can see, immediately open up the door to 113, and another H4 supply seen at 113.57-113.38 (not seen on the screen). So, even though there’s a good chance further upside is likely in this market, buying beyond the current H4 supply is also somewhat restricted for the time being.
Data points to consider: No high-impacting news on the docket today.
Levels to watch/live orders:
- Buys: Flat (stop loss: N/A).
- Sells: Flat (stop loss: N/A).
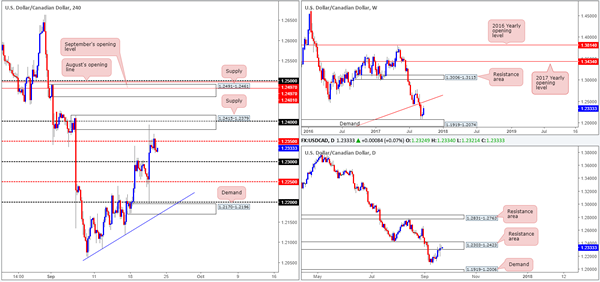
USD/CAD
In a similar fashion to the USD/JPY, the USD/CAD saw little change on Thursday, with the unit spending the majority of the day hugging the underside of a H4 mid-level resistance at 1.2350. As we highlighted in yesterday’s report, both the H4 supply seen above at 1.2415-1.2379 and the 1.2350 barrier are located within the walls of a daily resistance area coming in at 1.2303-1.2423. However, before we all get too excited and punch the sell button, it might be worth noting that weekly price shows room to extend above the daily area to tap a long-term weekly trendline resistance extended from the low 0.9633.
Suggestions: Given the threat of further upside on the weekly scale, the team is reluctant to sell from current prices. An area we would be interested in selling, however, is the H4 supply seen at 1.2491-1.2461. Not only is it surrounded by both September/August’s opening levels at 1.2497/1.2481 and the 1.25 handle, it also intersects nicely with the noted weekly trendline resistance.
As H4 price could potentially fake above 1.2491-1.2461 to attack offers at 1.25, nevertheless, we would advise waiting for a reasonably sized H4 bear candle to take shape from here (preferably a full, or near-full-bodied candle), before pulling the trigger.
Data points to consider: Canadian inflation and retail sales figures scheduled to be released at 1.30pm GMT+1.
Levels to watch/live orders:
- Buys: Flat (stop loss: N/A).
- Sells: 1.2491-1.2461 area ([waiting for a reasonably sized H4 bearish candle to form – preferably a full, or near-full-bodied candle – is advised] stop loss: ideally beyond the candle’s wick).
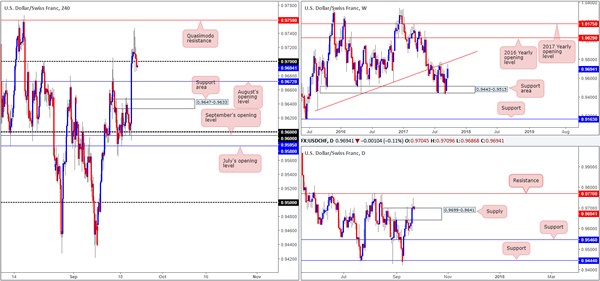
USD/CHF
In recent dealings, H4 price put in a top at 0.9747 and shortly after collapsed back below the 0.97 boundary. Near-term, this opens up the path south down to August’s opening base line at 0.9672, followed closely by the support area coming in at 0.9647-0.9633.
Also of particular interest is daily price has aggressively punctured the top edge of supply drawn from 0.9699-0.9641 and opened up the possibility for further upside to resistance at 0.9770. What’s also interesting is that we can also see weekly price closing in on the weekly trendline resistance taken from the low 0.9257.
Suggestions: Technically speaking, although H4 action is now sub 0.97 both the weekly and daily charts show room for the market to extend north.
However, as we mentioned in Thursday’s analysis, instead of trying to long a market which is so close to testing weekly/daily structures, you could simply wait for price to challenge the H4 Quasimodo resistance at 0.9759 and look to sell. Positioned just 10 pips beneath daily resistance at 0.9770 and intersecting with a weekly trendline resistance this H4 level is, in our opinion, enough to warrant a sell without the need for additional confirmation.
Data points to consider: No high-impacting news on the docket today.
Levels to watch/live orders:
- Buys: Flat (stop loss: N/A).
- Sells: 0.9759 area (stop loss: 0.9776).
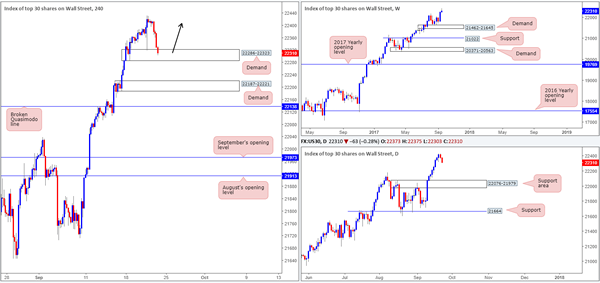
DOW 30
Going into the early hours of Thursday’s session, US equities began paring gains. Shaped by three relatively strong H4 bearish candles, the index managed to end the day closing a few points ahead of H4 demand pegged at 22286-22323. This demand has, in our opinion, already proved its worth as it held ground in the immediate aftermath of Wednesday FOMC meet. A violation of this area, however, likely opens the door for a test of the H4 demand base coming in at 22187-22221.
Suggestions: With absolutely no resistances seen on the horizon, this remains a buyers’ market right now as far as we’re concerned. As such, we’ll be watching the current H4 demand for potential buying opportunities today. Should price chalk up a H4 bull candle in the shape of a full, or even a near-full-bodied candle, we would deem this a worthy buy signal to long this market in the hope of joining the long-term trend.
Data points to consider: No high-impacting news on the docket today.
Levels to watch/live orders:
- Buys: 22286-22323 ([waiting for a reasonably sized H4 bullish candle to form – preferably a full, or near-full-bodied candle – is advised] stop loss: ideally beyond the candle’s tail).
- Sells: Flat (stop loss: N/A).
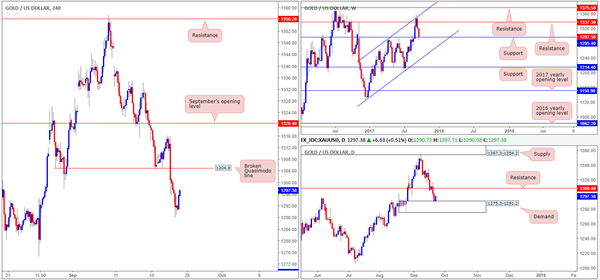
GOLD
Kicking this morning’s report off with a quick look at the weekly timeframe shows price is currently seen crossing paths with support coming in at 1295.4. As you can see, the buyers have yet to register much interest here. Sliding down to the daily timeframe, however, the candles recently connected with the top edge of a demand base logged at 1275.3-1291.2. Should the bulls hold ground here, the next upside target can be seen at resistance drawn from 1308.4. Before price can reach this level, nonetheless, daily buyers will need to contend with the H4 broken Quasimodo line at 1304.9.
Suggestions: Although a long from weekly support looks tempting, buying into nearby H4 and daily resistances is not really our cup of tea. Along the same lines, selling at the noted H4/daily levels would, in our view, be considered
courageous given that weekly price is trading from support!
On account of the above, our desk will remain on the sidelines for the time being and reassess structure going into Monday’s open.
Levels to watch/live orders:
- Buys: Flat (stop loss: N/A).
- Sells: Flat (stop loss: N/A).