Sample Category Title
Trade Idea: USD/CAD – Buy at 1.2285
USD/CAD - 1.2350
New strategy :
Buy at 1.2285, Target: 1.2450, Stop: 1.2225
Position: -
Target: -
Stop:-
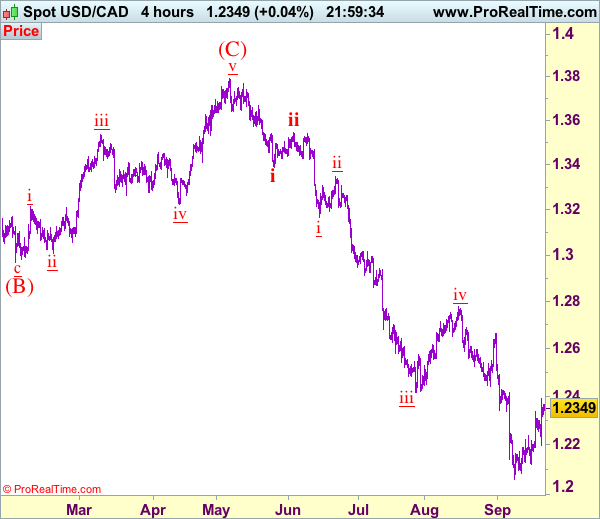
As the greenback found renewed buying interest at 1.2197 yesterday and has staged another rebound, suggesting a temporary low has been made at 1.2061 earlier this month and consolidation with upside bias is seen for the corrective rise from there to bring retracement of recent decline, above 1.2395-00 would encourage for further gain to resistance at 1/2425-30. then 1.2450, however, near term overbought condition should limit upside and reckon 1.2500 would hold from here, bring retreat later.
In view of this, we are looking to turn long on pullback as 1.2270-80 should limit downside and bring another rebound. Only below said support at 1.2197 would abort and signal top is formed instead, bring weakness to 1.2160-65, then towards support at 1.2121, break there would confirm the rebound from 1.2061 has ended and bring retest of this level later, We are keeping our count that wave v as well as wave (C) ended at 1.3794 and impulsive wave (i ii, i ii) is now unfolding with minor wave iii ended at 1.2414, followed by wave iv correction ended at 1.2778, wave v has reached our indicated downside target at 1.2100 and may extend to 1.2000.
To recap, wave B from 1.3066 is unfolding as an a-b-c and is sub-divided as a: 1.2192, b: 1.2716 and wave c is a 5-waver with i: 1.1983, ii: 1.2506, extended wave iii with minor iii at 1.0206, wave iv ended at 1.0781 and wave v as well as wave iii has ended at 0.9931, hence the subsequent choppy trading is the wave iv which is unfolding as (a)-(b)-(c) with (a) leg of iv ended at 1.0854, followed by (b) leg at 1.0108 and (c) leg as well as the wave iv ended at 1.0674. The wave v is sub-divided by minor wave (i): 0.9980, (ii): 1.0374, (iii): 0.9446, (iv): 0.9913 and (v) as well as v has possibly ended at 0.9407, therefore, consolidation with upside bias is seen for major correction, indicated target at 1.3700 and 1.4000 had been met and further gain to 1.4700 would be seen later.
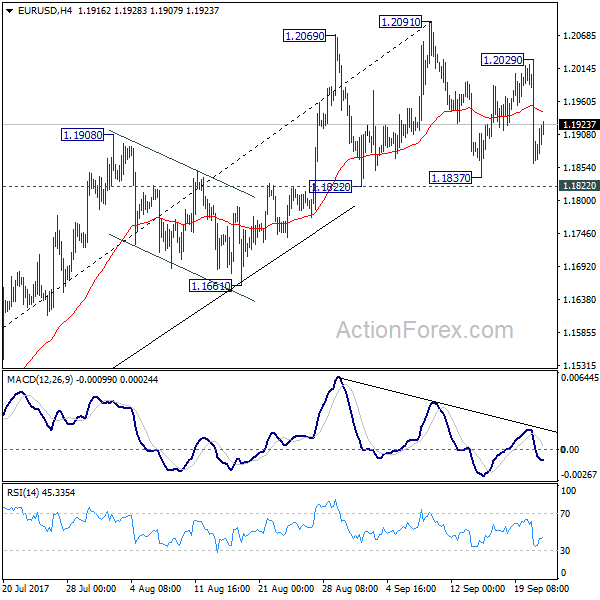
EUR/USD Mid-Day Outlook
Daily Pivots: (S1) 1.1826; (P) 1.1929 (R1) 1.1998; More...
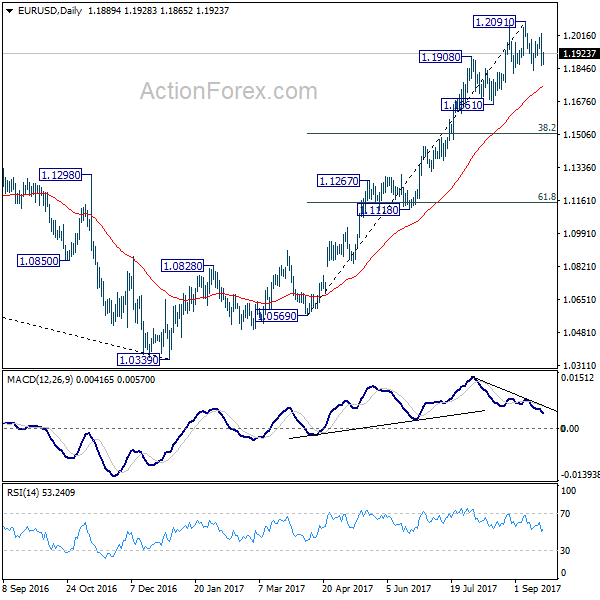
Intraday bias in EUR/USD remains neutral for the moment. on the downside, break of 1.1822/1837 support zone will complete a head and should top reversal pattern (ls: 1.2069, h: 1.2091, rs: 1.2029). That will confirm near term reversal, on bearish divergence condition in 4 hour MACD. In the case, intraday bias will be turned back to the downside through 1.1661 support. EUR/USD should then correct whole rise from 1.0569 and target 38.2% retracement of 1.0569 to 1.2091 at 1.1510. However, rebound from 1.1822/1837 and break of 1.2029 will resume the larger up trend to next key fibonacci level at 1.2516.
In the bigger picture, rise from medium term bottom at 1.0339 is still in progress for 38.2% retracement of 1.6039 (2008 high) to 1.0339 (2017 low) at 1.2516. However, it should be noted that there is no confirmation of trend reversal yet. That is, such rebound from 1.0399 could be a correction. And the long term fall fro 1.6039 (2008 high) could resume. Hence, we'd be cautious on strong resistance from 1.2516 to limit upside. But after all, break of 1.1661 is needed to indicate medium term topping. Otherwise, outlook will remain bullish in case of pull back.
GBP/USD Mid-Day Outlook
Daily Pivots: (S1) 1.3412; (P) 1.3533; (R1) 1.3616; More....
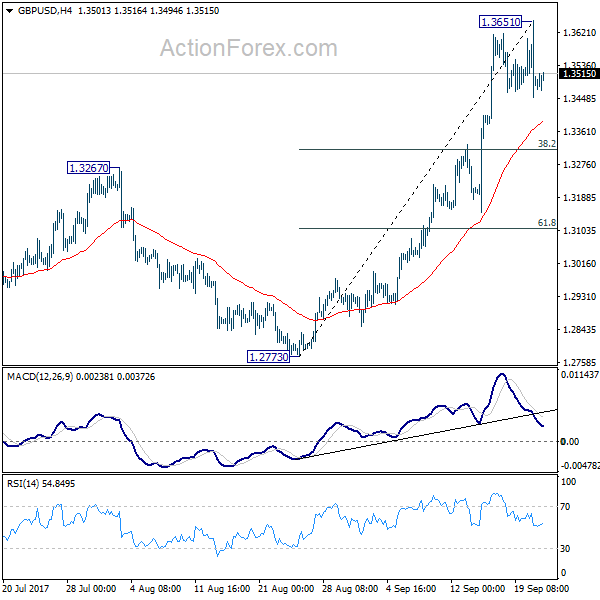
Intraday bias in GBP/USD remains neutral for consolidation below 1.3651 temporary top. In case of deeper fall, downside should be contained by 38.2% retracement of 1.2773 to 1.3651 at 1.3316 and bring rise resumption. Above 1.3651 will turn bias back to the upside for 1.3835 support turned resistance next. Break there will target 55 month EMA (now at 1.4405).
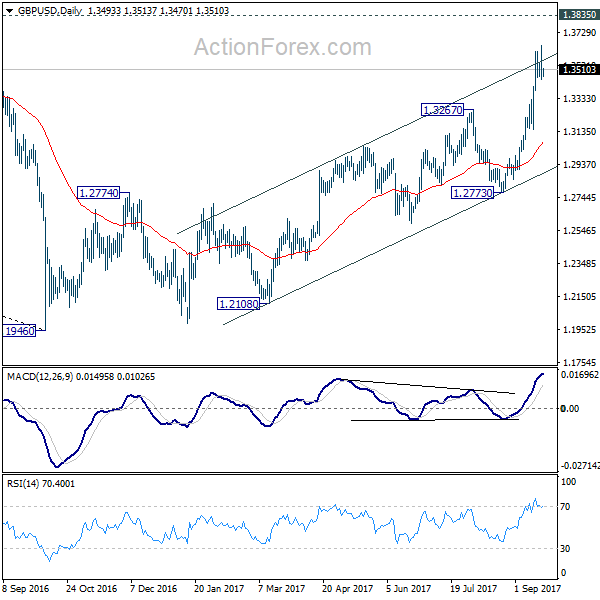
In the bigger picture, the strong break of 1.3444 key resistance now argues that the long term trend in GBP/USD has reversed. That is a key bottom was formed back in 1.1946 on bullish convergence condition in monthly MACD. Current rise from 1.1946 will target 38.2% retracement of 2.1161 (2007 high) to 1.1946 (2016 low) at 1.5466 next. In any case, medium term outlook will now stay bullish as long as 1.2773 support holds.
USD/CHF Mid-Day Outlook
Daily Pivots: (S1) 0.9617; (P) 0.9667; (R1) 0.9747; More....
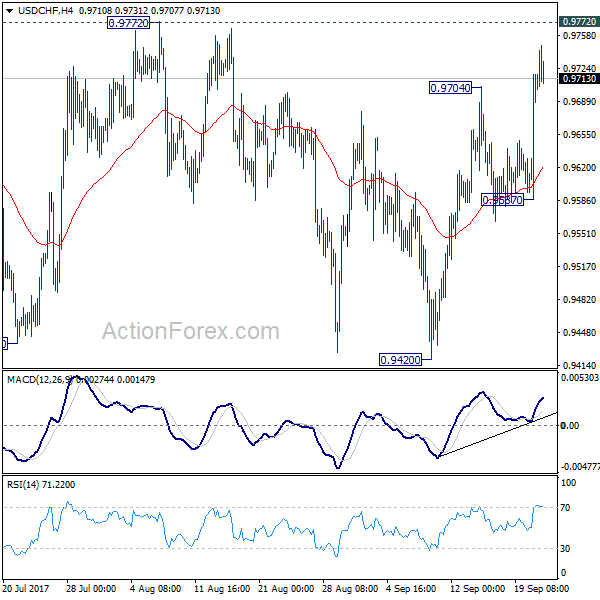
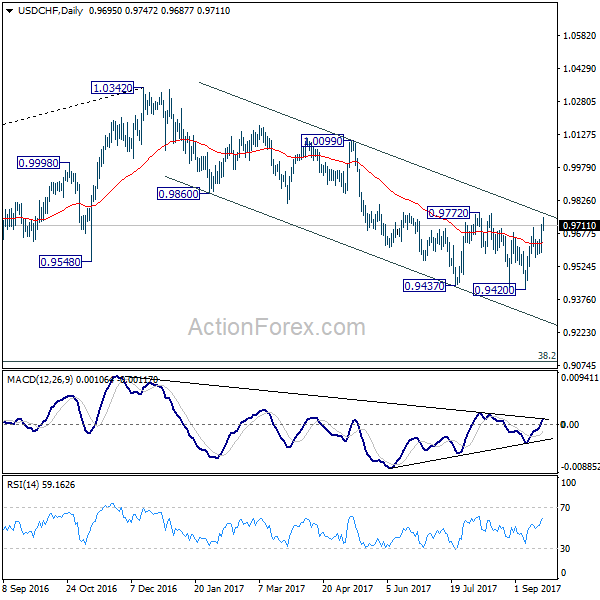
Intraday bias in USD/CHF remains on the upside as rebound from 0.9420 is targeting 0.9772 key resistance. Decisive break there will suggest that whole down trend form 1.0342 has completed. In that case, near term outlook will be turned bullish for 0.9860/1.0099 resistance zone. Nonetheless, with 0.9772 resistance intact, outlook remains bearish. Below 0.9587 minor support will turn bias back to the downside for 0.9420 low.
In the bigger picture, current development suggests that 0.9443 key support (2016 low) could be taken out firmly as down trend form 1.0342 extends. There are various interpretation of the price actions. But in any case, medium term outlook will stay bearish as long as 0.9772 resistance holds. Current down trend could extend to 38.2% retracement of 0.7065 (2011 low) to 1.0342 (2016 high) at 0.9090. However, break of 0.9772 will indicate that USD/CHF has successfully defended 0.9443 again and turn outlook bullish for 1.0099 resistance.
Trade Idea Update: USD/CHF – Stand aside
USD/CHF - 0.9727
New strategy :
Stand aside
Position : -
Target : -
Stop : -
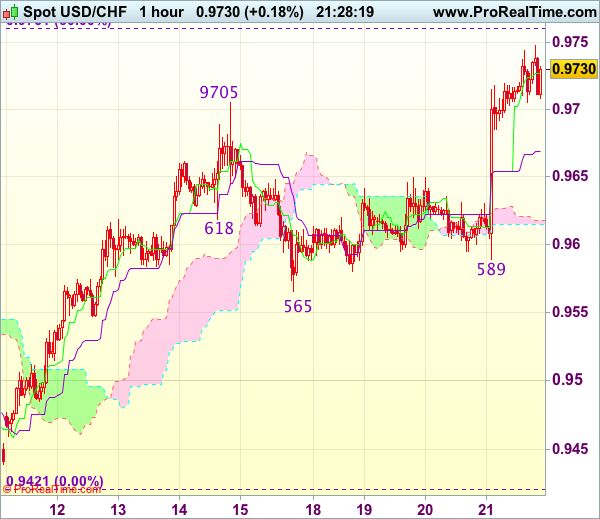
The greenback only fell to 0.9589 yesterday before staging another rally (after Fed) above resistance at 0.9705, suggesting recent rise from 0.9421 low is still in progress and may extend gain towards 0.9761-66 (50% Fibonacci retracement of 1.0100-0.9421 and previous resistance) but reckon another previous resistance at 0.9773 would hold on first testing due to near term overbought condition, risk from there is seen for a retreat later.
In view of this, would not chase this rise here and would be prudent to stand aside for now. Below 0.9685 would bring test of the Kijun-Sen (now at 0.9667) but break there is needed to signal an intra-day top is formed, bring retracement to 0.9635-40 but said support at 0.9589 should remain intact.
Trade Idea Update: GBP/USD – Sell at 1.3595
GBP/USD - 1.3501
Original strategy :
Sell at 1.3595, Target: 1.3480, Stop: 1.3630
Position : -
Target : -
Stop : -
New strategy :
Sell at 1.3595, Target: 1.3480, Stop: 1.3630
Position : -
Target : -
Stop : -
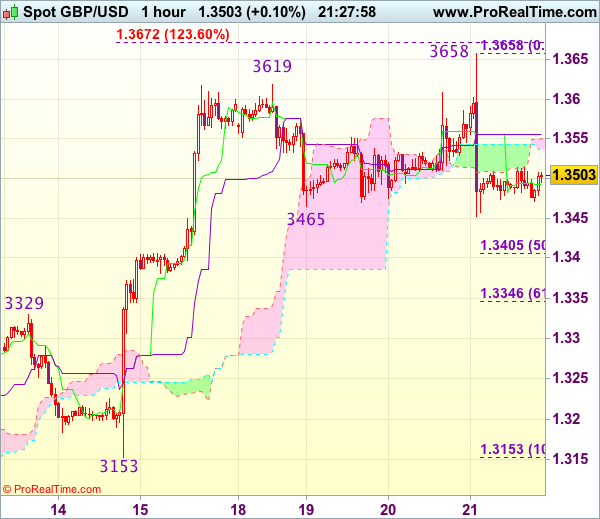
Although the British pound resumed recent rise and rose to as high as 1.3658, lack of follow through buying and the subsequent sharp retreat suggest top is possibly formed there and consolidation with mild downside bias is seen, below 1.3450 would bring further fall towards 1.3400-05 (50% Fibonacci retracement of 1.3153-1.3658), however, near term oversold condition should prevent sharp fall below 1.3345-50 (61.8% Fibonacci retracement) and previous resistance at 1.3329 should remain intact.
In view of this, we are looking to sell cable on recovery as 1.3590-00 should limit upside. Above 1.3620 would risk retest of said yesterday’s high at 1.3658 but only break there would revive bullishness and extend recent upmove to 1.3690-00 later.
USD/JPY Mid-Day Outlook
Daily Pivots: (S1) 111.23; (P) 111.55; (R1) 111.92; More...
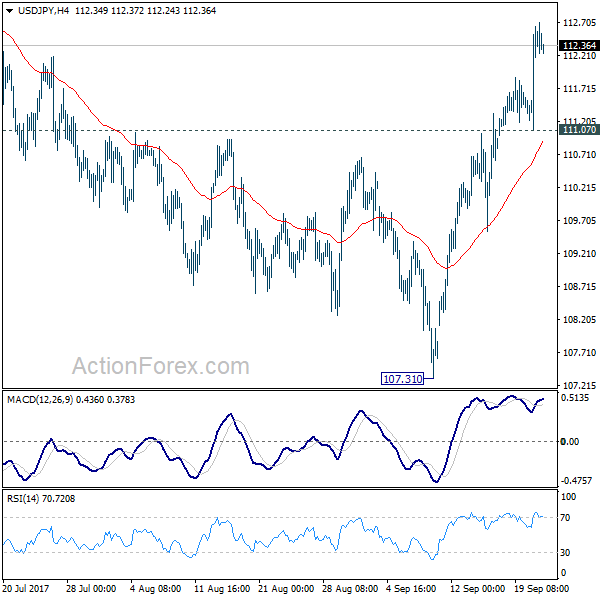
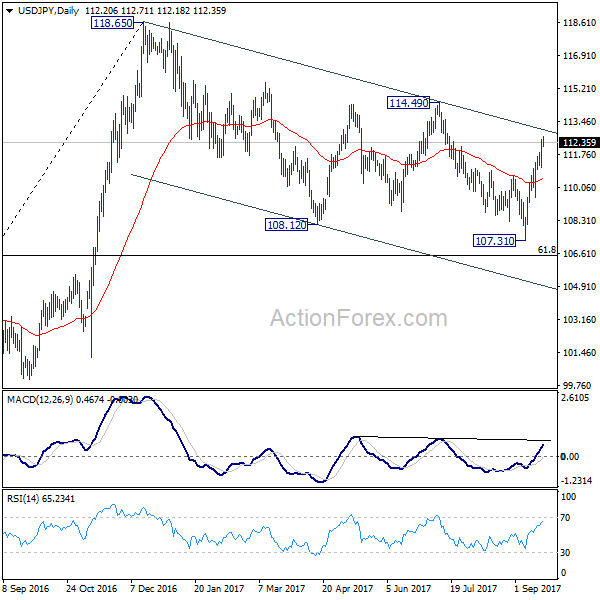
Intraday bias in USD/JPY remains on the upside for medium term channel resistance (now at 113.03). Sustained break there will argue that whole correction from 118.65 has completed too. In that case, further rise should be seen to 114.49 resistance for confirmation. On the downside, below 111.07 minor resistance will raise the risk of rejection from channel resistance and turn bias back to the downside for 55 day EMA (now at 110.53).
In the bigger picture, rise from 98.97 (2016 low) is seen as the second leg of the corrective pattern from 125.85 (2015 high). It's unclear whether this this second leg has completed at 118.65 or not. But medium term outlook will be mildly bearish as long as 114.49 resistance holds. And, there is prospect of breaking 98.97 ahead. Meanwhile, break of 114.49 will bring retest of 125.85 high. But even in that case, we don't expect a break there on first attempt.
Trade Idea Update: EUR/USD – Sell at 1.1950
EUR/USD - 1.1910
Original strategy :
Sell at 1.1950, Target: 1.1850, Stop: 1.1985
Position : -
Target : -
Stop : -
New strategy :
Sell at 1.1950, Target: 1.1850, Stop: 1.1985
Position : -
Target : -
Stop : -
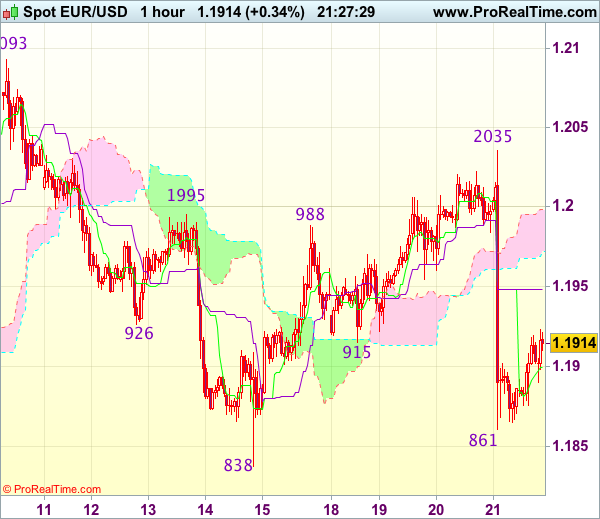
Although the single currency rose to as high as 1.2035 in late NY yesterday, euro ran into strong selling pressure there and has dropped sharply after Fed, suggesting early rebound from 1.1838 has ended there and downside bias is seen for retest of said support, break there would signal another leg of corrective decline from 1.2093 top is underway and extend weakness to 1.1800-05 but near term oversold condition would limit downside to 1.1770 and reckon 1.1750 would hold.
In view of this, we are looking to sell euro on recovery as the Kijun-Sen (now at 1.1948) should limit upside and bring another decline later. Above the lower Kumo (now at 1.1968) would defer and risk a stronger rebound to the upper Kumo (now at 1.1995) but said resistance at 1.2035 should remain intact.
Trade Idea Update: USD/JPY – Buy at 111.90
USD/JPY - 112.31
Original strategy :
Buy at 111.90, Target: 112.90, Stop: 111.55
Position : -
Target : -
Stop : -
New strategy :
Buy at 111.90, Target: 112.90, Stop: 111.55
Position : -
Target : -
Stop : -
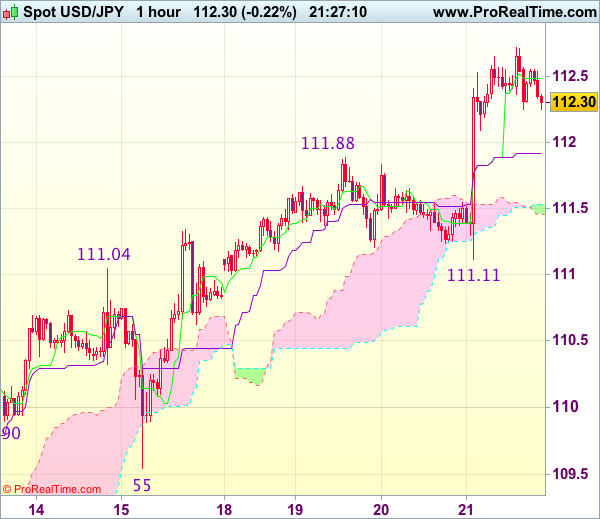
The greenback has rallied after finding renewed buying interest at 111.11 yesterday (after Fed), adding credence to our bullish view that recent upmove is still in progress and may extend further gain to 112.90-00, however, loss of near term upward momentum should prevent sharp move beyond 113.25-30 (1.236 times projection of 107.32-111.04 measuring from 109.55) and previous chart resistance at 113.58 would hold from here, bring retreat later.
In view of this, would not chase this move here and would be prudent to buy dollar on subsequent pullback as previous resistance at 111.88 should turn into support and contain downside, bring another upmove. Below the Ichimoku cloud (now at 111.51-54) would defer and suggest a temporary top is possibly formed, risk weakness towards support at 111.11.
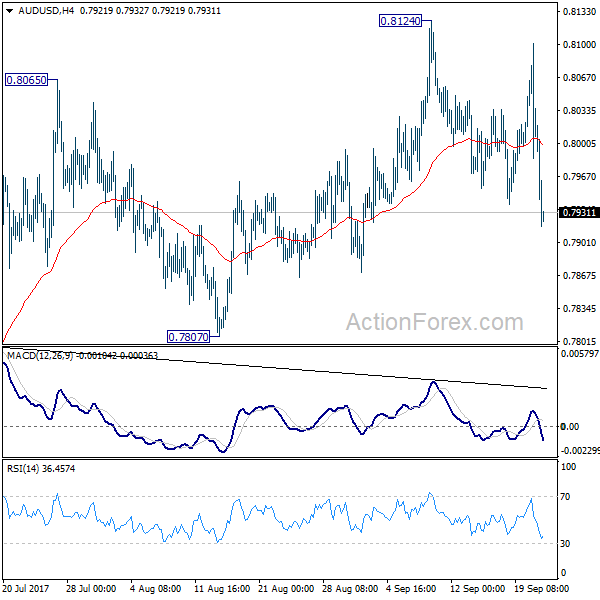
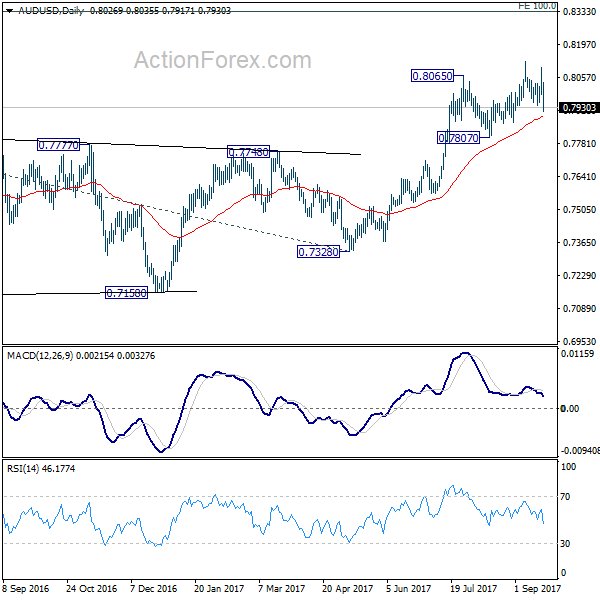
AUD/USD Mid-Day Outlook
Daily Pivots: (S1) 0.7976; (P) 0.8039; (R1) 0.8093; More...
AUD/USD drops sharply to as low as 0.7917 so far today. But it's still staying in range of 0.7807/8124. Intraday bias remains neutral first. Deeper fall cannot be ruled out. But still, with 0.7807 support intact, near term outlook stays bearish and another rise is expected. Break of 0.8124 will turn bias to the upside and target 100% projection of 0.6826 to 0.7833 from 0.7328 at 0.8335 next. However, considering bearish divergence condition in 4 hour MACD, firm break of 0.7807 will indicate near term reversal and turn bias back to the downside for 0.7328 key support.
In the bigger picture, rise from 0.6826 medium term bottom is still in progress. At this point, there is no confirmation of trend reversal yet and we'll continue to treat such rebound as a corrective pattern. But in any case, break of 55 month EMA (now at 0.8090) will target 38.2% retracement of 1.1079 to 0.6826 at 0.8451. Break of 0.7807 support is needed to to be the first sign of completion of the rebound. Otherwise, further rise is now in favor.