Sample Category Title
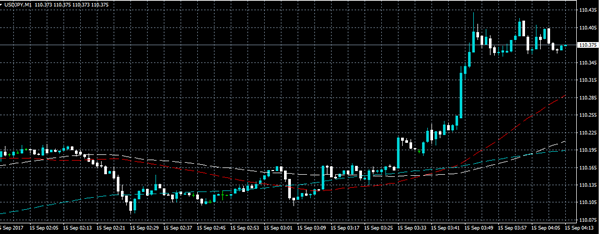
Can US Dollar Break 100-Day SMA Vs Japanese Yen?
Key Highlights
- The US Dollar after forming support near 107.50 against the Japanese Yen recovered well.
- There was a break above a major bearish trend line with resistance near 110.00 on the daily chart of USD/JPY.
- The US Consumer Price Index in August 2017 increased 0.4%, more than the forecast of +0.3% (MoM).
- The US Retail Sales for August 2017 will be released today, which is forecasted to increase by 0.1% (MoM).
USDJPY Technical Analysis
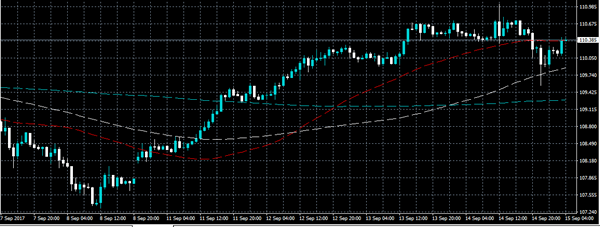
The US Dollar after a bear trend against the Japanese Yen found support at 107.50 and recovered. The USD/JPY pair needs to clear the 100-day simple moving average and 111.00 to gain further traction.
The past few days were decent for USD/JPY, as the pair recovered well from 107.50 and traded above the 109.00 and 110.00 resistance levels. During the upside move, there was also a break above a major bearish trend line with resistance near 110.00 on the daily chart.
However, the pair is currently trading below a crucial resistance at 111.00. The mentioned 111.00 is the 50% Fib retracement level of the last decline from the 114.49 high to 107.32 low. Moreover, the 100-day simple moving average is also at 111.10 to act as a key resistance.
Once there is a proper close above 111.00 and the 100-day SMA, the pair might continue gaining momentum in the near term.
US Consumer Price Index
Recently in the US, the Consumer Price Index for August 2017 was released by the US Bureau of Labor Statistics. The forecast was slated for an increase of 0.3% in the CPI compared with the previous month.
However, the actual result was better than the forecast, as the CPI posted an increase of 0.4%, compared with the last +0.1%. Looking at the yearly change in the CPI, there was a rise of 1.9%, more than the forecast of +1.8% and better than the last +1.7%.
The US CPI Ex Food & Energy also posted a better than the forecast increase of +1.7%, but similar to the last +1.7%.
The report added that:
The energy index rose 2.8 percent in August as the gasoline index increased 6.3 percent. The shelter index rose 0.5 percent in August with the rent index up 0.4 percent. The food index rose slightly in August, with the index for food away from home increasing and the food at home index declining.
Overall, it seems like the recent events in Japan, North Korea and the CPI release in the US might lift the USD/JPY pair above 110.50. However, a convincing break above the 100-day SMA and 111.00 is needed for sustained gains.
USDJPY Steadies After North Korea Missile Launch
The USDJPY pair has stabilized around the 110.30 level, after earlier dropping to 109.54, as North Korea fired another missile over Japan, which landed into the Pacific Ocean, sparking financial markets fears over escalating geopolitical tensions.
Yesterday, the USDJPY pair moved to a six-week trading high, hitting 111.04 during the U.S session, following a stronger than expected increase in August CPI data from the United States economy.
Going forward, a higher time-frame close below the 109.90 level should accelerate USDJPY selling, whilst a higher time-frame close above the 110.68 level should accelerate buying above the 111.04 level.
To the upside, key technical USDJPY resistance is found at 110.68, 110.80 and the 111.04 level. Once above 111.04, key weekly resistance is found at 111.40 and 111.65.
Key intraday technical support is located at the daily pivot point, at 110.18 and the key 50-day moving average, at 109.95.
Below the 109.95 level, further support is found at the daily low, at 109.54, and the 200-hour moving average, at 109.28.
EURUSD Risk Rebound
The EURUSD pair has rebounded above the 1.1900 handle, after yesterday falling to a ten-day trading low, hitting 1.1838, following the release of much better than expected August U.S inflation data.
Risk-off trading sentiment has also returned to financial markets, following North Korea's latest missile launch, which is helping to push the U.S dollar index lower.
Later today, the EURUSD pair should find an intraday directional trading bias, following the release of U.S retail sales and industrial production data.
To the upside, EURUSD resistance is located at 1.1938, 1.1957 and the key 1.1979 level. Above 1.1979, further key resistance is found at the weekly pivot point, at 1.1999 and the key 1.2030 Fibonacci level.
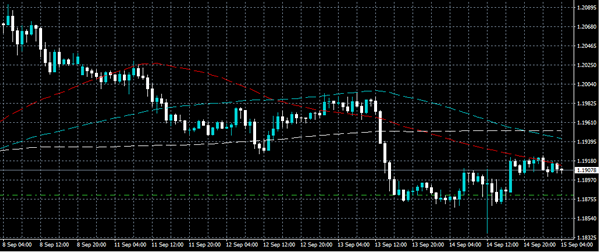
To the downside, key EURUSD intraday support is found at the daily pivot point, at 1.1893, and the monthly time frame 50-period moving average, at 1.1870. Below the 1.1870 level, further losses can be seen towards 1.1851 and 1.1823.
US Data To Close Out An Active Week In The Market
A steady stream of economic data will make its way through the markets on Friday, giving investors key insight into the US and Eurozone economies. The North American session will be especially active, with reports on consumer spending and industrial production set to make headlines.
The data wire begins at 10:00 GMT with a report on Eurozone trade. The Eurozone’s non-adjusted trade surplus is forecast to drop to €21.4 billion in July from €26.6 billion the previous month.
One hour later, the Bank of England (BOE) will issue its Quarterly Bulletin, which provides regular commentary on market developments in the British economy. The BOE left interest rates on hold Thursday, but sent a strong signal that changes are afoot.
Several high-profile releases headline the North American session, beginning at 12:30 GMT with retail sales. Receipts at retail stores are forecast to rise 0.1% in August after climbing 0.6% the month before. Excluding automobiles, sales are projected to rise 0.5%.
At the same time, the New York Federal Reserve Bank will release the monthly Empire State manufacturing index, which gauges business conditions for regional manufacturers.
Factory data will be front and centre at 13:15 GMT when the Fed reports on industrial production for the month of August. Output is forecast to rise 0.1% from July, following an increase of 0.2% the month before. The capacity utilization rate is expected to edge up slightly to 76.8%.
The University of Michigan will unveil its closely-watched consumer sentiment index at 14:00 GMT. The preliminary September report is expected to show a decline in consumer confidence.
The Commerce Department will report on business inventories at 14:00 GMT. Three hours later, Baker Hughes Inc. will release its weekly rig-count data.
EUR/USD
The euro stabilized on Thursday after a series of sharp declines pulled prices away from new multiyear highs. The EUR/USD exchange rate was last seen trading at 1.1911, where it was little changed. The EUR/USD remains well supported, as traders continue to buy on the dips. This is likely to continue in the short term.
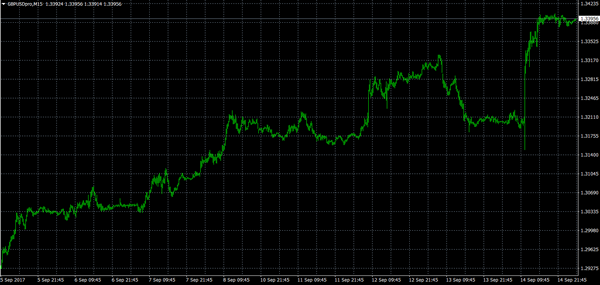
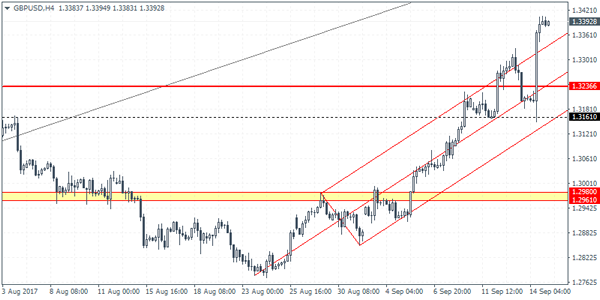
GBP/USD
The British pound put up a massive rally on Thursday after the BOE said a rate hike could be warranted in the coming months. The GBP/USD gained nearly 200 pips for the day. Cable is now eyeing the 6 September 2016 high of 1.3447 as the next target. Immediate support is located in the mid-1.31 region, which corresponds with the low from 8 September.
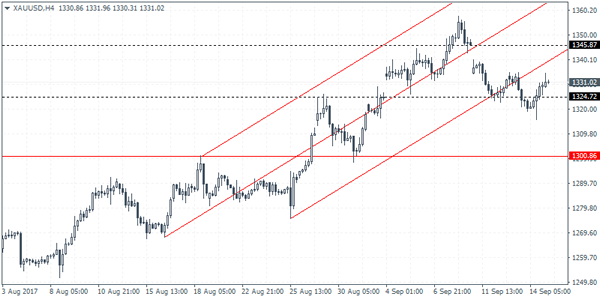
GOLD
Gold prices are on track for a large weekly decline, as the US dollar stabilized and risk appetite returned to the financial markets. Spot gold was last seen trading around $1,331.00 a troy ounce. Bullion maintains a bullish outlook after a convincing rally pushed prices north of $1,300.00 – a level that had proven difficult to penetrate all year long.
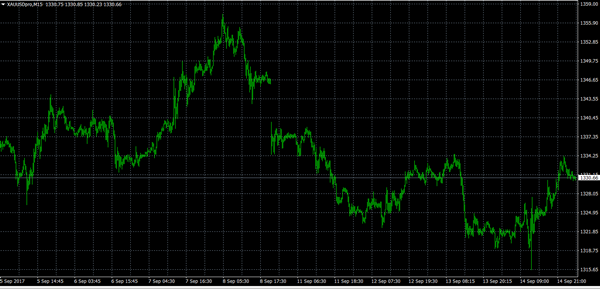
XAUUSD Intraday Analysis
XAUUSD (1331.02): Gold prices continue to remain trading flat with price action seen trading subdued. Yesterday's session saw gold prices supported near 1324.72. This puts the bias to the upside with the target of 1345.87 in sight. Given that there is an unfilled gap at this level, gold prices could be aiming to close this gap. However, the gains are likely to come by next week, closer to the FOMC meeting. To the downside, the support at 1324.72 remains a key level as a break down below could signal further decline towards 1300.86.
GBPUSD Intraday Analysis
GBPUSD (1.3392): The British pound continued to push higher as price rallied close to the 1.3400 handle. Support at 1.3236 remains a level area which could be tested on a decline as this level previously served as resistance. To the upside, the momentum could be seen easing off into the weekend. With the downside well supported, the GBPUSD could remain biased to the upside. However, watch for the support at 1.3236 which will be critical for price action. Failure to hold the declines here could push GBPUSD back lower to test the support at 1.3161 initially.
EURUSD Intraday Analysis
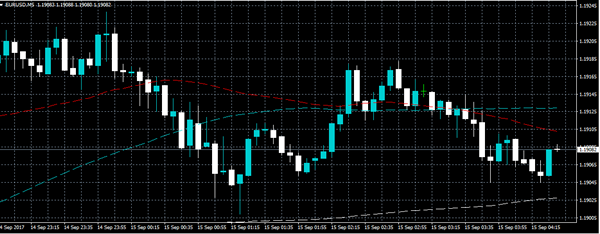
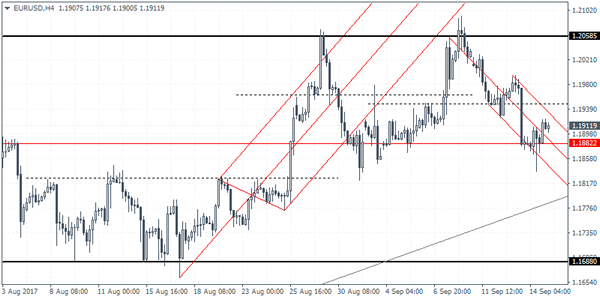
EURUSD (1.1911): The EURUSD posted a 10-day intraday low yesterday before pulling back to close on a bullish note. Price action remains strongly consolidated above the support level of 1.1882. The bounce off this level yesterday marks a test of support at this level. Further declines can only be expected on a breakdown of this support level. This puts EURUSD on a likely sideways range in the near term above 1.1822 and below 1.2058. Any near term gains will, however, struggle to breakout from the minor resistance seen at 1.1962 and 1.1947.
GBP Soars On BoE, US Inflation Picks Up
The British pound rallied to post a fresh one-year high, riding on the back of hawkish comments from the Bank of England. Despite the weak wage growth dampening investor sentiment, the Bank of England said that interest rates like to rise in the coming months. The comments helped fuel the rally in the British pound which was seen briefly trading at $1.3400.
In the US trading session, the monthly inflation data showed an increase in headline consumer prices. Rising at a pace of 0.4%, it was the largest monthly increase since January this year. On a year over year basis, US consumer prices were seen rising 1.9% in August. While the US dollar managed to post some gains, the currency was still trading weaker against its peers.
Looking ahead, the last trading day of the week will see the release of the monthly retail sales figures from the US Core retail sales are expected to rise 0.5% on the month, while headline retail sales are expected to moderate, rising 0.1%. This comes after the retail sales surged 0.6% the month before.
EUR/JPY Candlesticks and Ichimoku Analysis
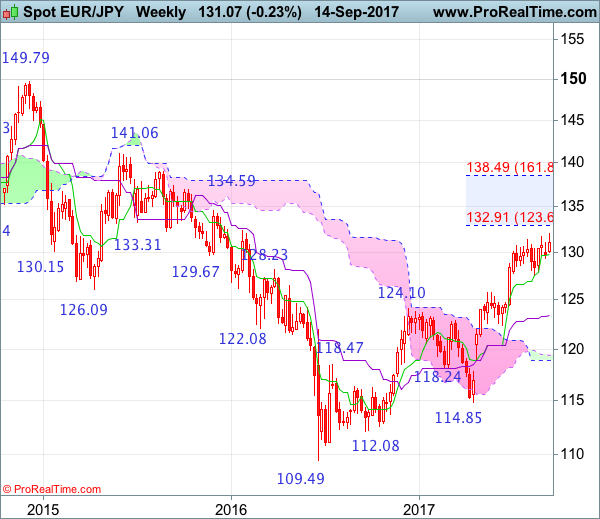
Weekly
• Last Candlesticks pattern: Window
• Time of formation: 24 April 2017
• Trend bias: Up
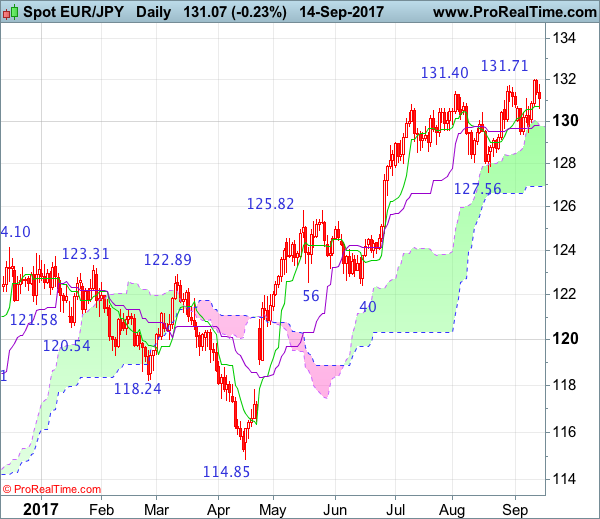
Daily
• Last Candlesticks pattern: Hammer
• Time of formation: 18 May 2017
• Trend bias: Up
EUR/JPY – 131.50
As the single currency staged a strong rebound after holding above support at 129.37 and broke above previous resistance at 131.71, signaling recent upmove has once again resumed and upside risk remains for further gain to 132.50-60, however, near term overbought condition should limit upside to 133.10-15 (61.8% projection of 122.40-131.40 measuring from 127.56) and reckon 133.50-60 would hold from here, price should falter well below 134.00-10, risk from there has increased for a retreat to take place later.
On the downside, whilst initial pullback to 131.00 is likely, reckon the Tenkan-Sen (now at 130.69) would limit downside and bring another rise later. Below 130.25-30 would bring test of the Kijun-Sen (now at 129.79) but only break of said support at 129.37 would signal top is formed instead, bring retracement of recent rise to 129.00, then towards 128.45-50, however, break of latter level is needed to retain bearishness and encourage for subsequent weakness towards support at 127.56 which is likely to hold from here.
Recommendation: Stand aside for this week.
On the weekly chart, despite last week’s retreat to 129.37, as the single currency found decent demand there and has risen again, suggesting the erratic upmove from 109.49 (2016 low) is still in progress and may extend headway to previous chart resistance at 132.33, however, overbought condition should limit upside to 133.10-15 (61.8% projection of 122.40-131.40 measuring from 127.56) and reckon 134.40 (61.8% Fibonacci retracement of entire fall from 149.79-109.49) would hold, price should falter well below135.00-10, risk from there is seen for a retreat to take place later.
On the downside, expect pullback to be limited to 130.90-00 and the Tenkan-Sen (now at 129.79) should hold, bring another rise later. A drop below said support at 129.37 would suggest a temporary top is possibly formed, bring weakness to 128.90-00, then towards 128.00-10 but only break of previous support at 127.56 would confirm, bring retracement of recent upmove to 126.70-80, then towards 126.00-10 but previous resistance at 125.81 should turn into support and limit euro’s downside.
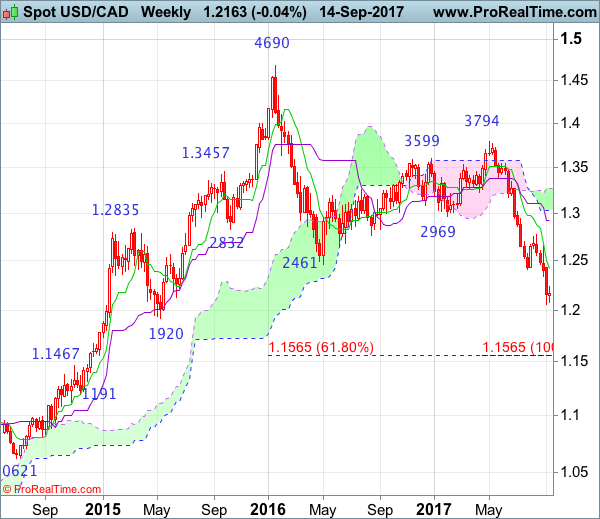
USD/CAD Candlesticks and Ichimoku Analysis
Weekly
• Last Candlesticks pattern: Shooting doji
• Time of formation: 01 May 2017
• Trend bias: Sideways
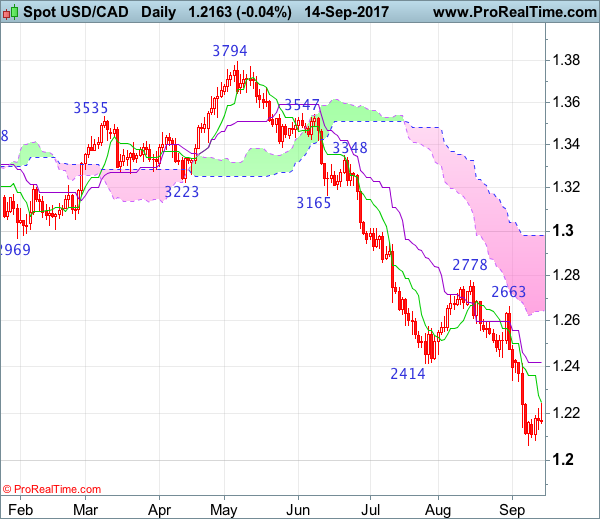
Daily
• Last Candlesticks pattern: Bearish engulfing
• Time of formation: 5 May 2017
• Trend bias: Down
USD/CAD – 1.2203
As the greenback has recovered after falling to 1.2061 late last week, suggesting consolidation above this level would be seen and test of the Tenkan-Sen (now at 1.2245) cannot be ruled out, however, reckon upside would be limited to 1.2300 and renewed selling interest should emerge around 1.2340-50, bring another decline later, below 1.2080-85 would bring retest of 1.2061 but break there is needed to confirm recent downtrend has resumed and extend further weakness to psychological level at 1.2000, having said that, oversold condition should prevent sharp fall below 1.1920-25 (61.8% projection), risk from there has increased for a rebound to take place later.
On the upside, whilst initial recovery to 1.2245-50 cannot be ruled out, reckon 1.2340-50 would limit upside and bring another decline later to aforesaid downside targets. A daily close above resistance at 1.2415 would defer and risk a stronger rebound to the Kijun-Sen (now at 1.2420) but only a sustained breach above this level would abort and signal a temporary low is formed instead, bring retracement of recent decline to 1.2520-25, then towards 1.2600 but said resistance at 1.2663 should remain intact, bring retreat later.
Recommendation: Sell again at 1.2340 for 1.2100 with stop above 1.2440.
On the weekly chart, last week’s selloff formed another black candlestick, adding credence to our view that recent decline from 1.3794 top is still in progress and may extend weakness towards psychological support at 1.2000, however, reckon downside would be limited to 1.1920-25 (61.8% projection of 1.3794-1.2414 measuring from 1.2778) and reckon 1.1840-50 would hold from here, price should stay above 1.1750-60, bring rebound later this month.
On the upside, although initial recovery to 1.2240-50 and then 1.2300 cannot be ruled out, reckon upside would be limited to 1.2340-50 and bring another decline. A weekly close above previous support at 1.2414 would risk test of last week’s high at 1.2429 (this would also penetrate the Tenkan-Sen at 1.2420) but upside should be limited to 1.2500. Only a break above resistance at 1.2663 would suggest recent decline has ended instead, bring subsequent bounce to 1.2700 and later towards previous resistance at 1.2778.