Sample Category Title
A Stronger Picture For The UK?
North Korea fired another missile over Japan into the Pacific Ocean on Friday. The regimes defiance towards recent UN sanctions has had a mooted effect on the markets as many are growing accustomed to Pyongyang’s actions.
In an unsurprising move on Thursday, the Bank of England’s Monetary Policy Committee voted 7-2 to keep UK interest rates at 0.25%. The minutes of the meeting commented that there is a “slightly stronger picture” for the UK Economy with a strong labour market, continued housing demand and the recent improvement in retail sales. Such rhetoric has many believing that, if wage growth continues to rise, the possibility of a rate hike may occur earlier than expected. Following the meeting, GBPUSD rose over 1.4% to reach 1.34038 – a level last seen 12 months ago.
On Thursday, data from the US Labour Department revealed a rise to 0.4% in August in the Consumer Price Index – bettering July’s insipid 0.1% increase. Core CPI is running at 1.7%, which is likely to provide some much-needed assistance to the Fed and its 2% inflation target. Following the data release, the likelihood of a US rate hike in December increased to 50.9% from 41.3%, per CME#’s FedWatch Tool. More data showed the US Labour market staying strong, as initial claims for unemployment benefits declined 14K. The seasonally adjusted rate of 284K (week ending September 9th) is below the 300K threshold for 132 weeks – the longest such run since 1970. The strong labour market appears to be helping, finally, push inflation higher. Market focus will now center around next week’s FOMC meeting for more clues on US economic policy and the timing of tightening in the months ahead.
EURUSD climbed, after hitting a 2-week low on Thursday, to currently trade around 1.1920.
USDJPY is little changed and currently trades around 110.40.
GBPUSD hit a 1-year high on Thursday and has maintained upwards momentum overnight to currently trade around 1.3410.
Gold was relatively flat and currently trades around $1,330.
WTI slipped overnight, after gaining over 1% on Thursday. Currently, WTI is trading around $50.20.
Major economic data releases for today:
At 11:00, Eurostat will release Eurozone Trade Balance for July. Consensus is suggesting €21.4B from the previous release of €26.6B. With relatively good economic growth in the Eurozone the markets will likely only react if the data is significantly different than expected.
At 13:30, the US Census Bureau will release the “much anticipated” Retails Sales (MoM) report for August. The previous strong reading of 0.6% is not expected to be beaten with the release today – consensus is suggesting a figure of 0.1%. As a good indicator of consumer spending, the markets will be hoping that the release stays in positive territory. A negative release will cause a weakening in USD and add volatility into the markets.
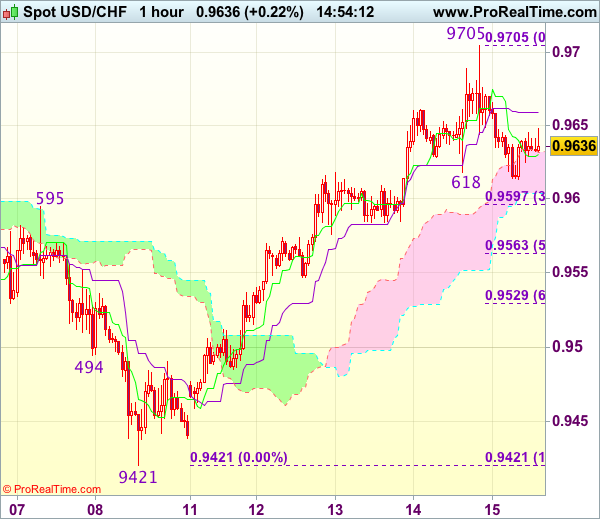
Trade Idea : USD/CHF – Hold short entered at 0.9680
USD/CHF - 0.9633
Most recent candlesticks pattern : N/A
Trend : Near term up
Tenkan-Sen level : 0.9662
Kijun-Sen level : 0.9658
Ichimoku cloud top : 0.9598
Ichimoku cloud bottom : 0.9552
Original strategy :
Sold at 0.9680, Target: 0.9580, Stop: 0.9705
Position : - Short at 0.9680
Target : - 0.9580
Stop : - 0.9705
New strategy :
Hold short entered at 0.9680, Target: 0.9580, Stop: 0.9680
Position : - Short at 0.9680
Target : - 0.9580
Stop : - 0.9680
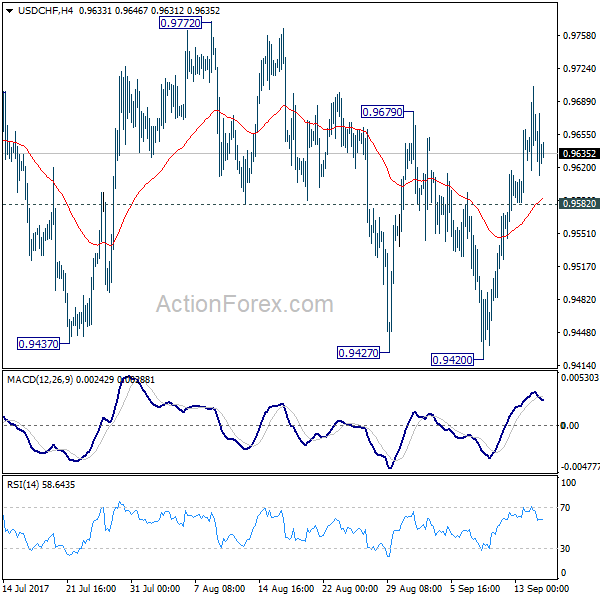
Although the greenback surged to as high as 0.9705 yesterday, the subsequent retreat has retained our near term bearishness and consolidation with mild downside bias is seen for weakness to 0.9595-00 (38.2% Fibonacci retracement of 0.9421-0.9705), however, break of 0.9560-65 (50% Fibonacci retracement) is needed to signal top is formed, bring further fall towards 0.9525-30 (61.8% Fibonacci retracement).
In view of this, we are holding on to our short position entered at 0.9680. Only above said resistance at 0.9705 would extend gain to 0.9725-30 but still reckon upside would be limited and 0.9761-66 (50% Fibonacci retracement of 1.0100-0.9421 and previous resistance) should hold, risk remains for another retreat to take place soon.
North Korea Missile Launch Not Entirely Unexpected, Reaction Calm
US Dollar Stabilizes After Sharp Fall. North Korea fired a missile on Friday that flew over Japan’s northern Hokkaido far out into the Pacific Ocean, South Korean and Japanese officials said, further ratcheting up tensions after Pyongyang’s recent test of a powerful nuclear bomb. The U.S. dollar fell sharply against the safe-haven yen and Swiss franc in early Asian hours, though it stabilized quickly, as the missile launch did not catch the market entirely off guard, as North Korea was expected to react after the latest U.N. Security Council sanctions.
British Pound Runs Higher on Carney Comments. Sterling climbed to fresh one-year high of $1.3407 against the Dollar and near-two-month highs against the Euro after Bank of England Governor Mark Carney gave his positive comments on the possibility of the first U.K. interest rate hike in a decade.
Oil Prices Set for Weekly Gains as Demand Outlook Brightens. Oil prices jumped, with international benchmark Brent futures hitting a five-month high, supported by a string of reports forecast the market would tighten further as fuel demand increased.
Elliott Wave View: DXY
DXY Dollar Index Short Term Elliott Wave view suggests that the Index ended Primary wave ((3)) at 91.01. Primary wave ((4)) bounce is proposed complete at 92.66 as a double three Elliott Wave structure. Wave (W) of ((4)) ended at 92.01, wave (X) of ((4)) ended at 91.71, and wave (Y) of ((4)) is proposed complete at 92.66. Down from there, Intermediate wave (1) ended at 91.97. Intermediate wave (2) bounce is in progress in 3, 7, or 11 swing to correct cycle from 9/14 peak. While bounces stay below there, expect Index to extend lower. We don’t like buying the Dollar Index.
DXY 1 Hour Elliott Wave Chart

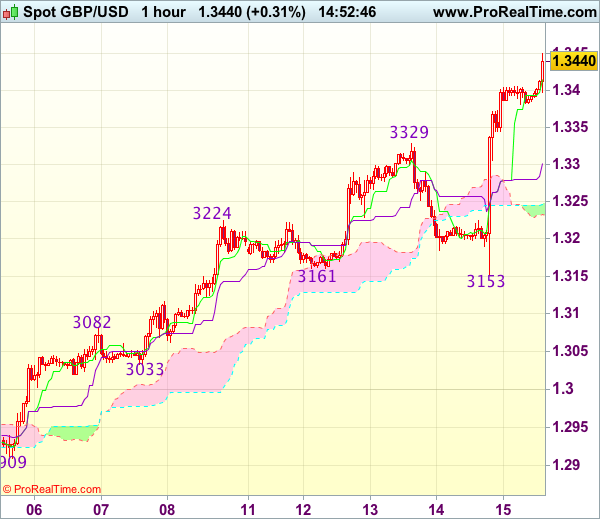
Trade Idea : GBP/USD – Stand aside
GBP/USD - 1.3423
Most recent candlesticks pattern : N/A
Trend : Near term up
Tenkan-Sen level : 1.3416
Kijun-Sen level : 1.3302
Ichimoku cloud top : 1.3250
Ichimoku cloud bottom : 1.3232
New strategy :
Stand aside
Position : -
Target : -
Stop : -
Although cable has risen again after brief pullback and near term upside risk remains for recent upmove to extend gain to 1.3450-60, loss of near term upward momentum should prevent sharp move beyond 1.3475-80 and reckon 1.3500 would hold from here, risk from there has increased for a retreat later.
In view of this, would not chase this rise here and would be prudent to stand aside in the meantime. Below 1.3380-85 would defer and suggest top is possibly formed, bring correction to 1.3340-45, break there would confirm and further weakness to the Kijun-Sen (now at 1.3302) would follow.
Currencies: Will US Data Be Strong Enough To Lift The Dollar Beyond First Resistance?
Sunrise Market Commentary
- Rates: Markets show signs of habituation to North-Korean tensions
The downside in US Treasuries was blocked yesterday by a new North-Korean threat despite a hawkish signal of the BoE and higher-than-expected US CPI data. The missile threat was put into practice overnight, but markets show signs of habituation. The past week's extreme safe haven flows didn't materialize, suggesting that US eco data will prime today! - Currencies: Will US data be strong enough to lift the dollar beyond first resistance?
A further rise in core yields and of the dollar was blocked by geopolitical tensions yesterday. The dollar failed to clear first important resistance against the euro and the yen. Will today's US data be strong enough to do the job? Sterling might remain well bid as the BoE signaled a rate hike yesterday
The Sunrise Headlines
- The market reaction to the latest missile test by North Korea was muted this morning, with investors largely shrugging off news that a missile launched by Pyongyang had once again overflown Japan. Asian stocks trade mixed.
- US secretary of state Rex Tillerson has called on China and Russia to take “direct actions of their own” against North Korea following Pyongyang's missile test on Friday that flew over northern Japan.
- Theresa May will attempt to break the Brexit impasse with a speech next week in Florence setting out her plans for a transition deal that is seen in London as the “key” to addressing Brussels' concerns about a €30B budget hole.
- While the Bank of Canada's inflation targeting regime has worked well, the central bank is open to alternatives and wants to communicate in a way that avoid unproductive volatility, deputy governor Wilkins said.
- Top congressional Republicans signaled that they wouldn't be pressured into enacting an immigration framework reached between President Trump and top Democrats.
- EU finance ministers discuss deepening of economic and monetary ties, developing a capital-markets union and tax matters today in Tallinn. EC Juncker will also push for the creation of a regional finance and economy minister post.
- Today's calendar heats up in the US with Empire Manufacturing, retail sales, industrial production and University of Michigan consumer confidence. ECB Nouy, ECB Lautenschläger and BoE Vlieghe are scheduled to speak
Currencies: Will US Data Be Strong Enough To Lift The Dollar Beyond First Resistance?
Will US data help USD to overcome first resistance?
The dollar couldn't extend gains yesterday even as the interest rate context and the data were initially supportive. Core yields rose after the BoE signalled a rising probability on a rate hike and a higher-than-expected US CPI. Headlines that North Korea was preparing a new missile test in the direction of Japan blocked further USD-gains. The dollar almost immediately reversed post-CPI gains and returned to the levels seen earlier in the session. EUR/USD finished the session at 1.1919 (from 1.1885 on Wednesday). USD/JPY closed at 110.24 (from 110.49).
Overnight, North Korea indeed launched a new missile over Japan's Northern Island Hokkaido. However, the multiple North Korean actions have a ‘diminishing impact' on markets. There were some jitters in regional equity indices and in USD/JPY as the headlines on the test flashed on the screens. However, any risk-off reaction was much more limited than at previous occasions. Asian equities currently mostly show limited losses. Japan even trades in positive territory. USD/JPY spiked briefly below 110 but trades again in the 110.40 area. The EUR/USD chart hardly shows any ripples. The pair trades just north of 1.19. That said, the geopolitical noise still prevents USD/JPY and EUR/USD to clear first key levels respectively at 110.95 and 1.1823.
Today's EMU calendar only contains the trade balance which is no market mover. The US calendar is again interesting with the Empire manufacturing survey, retail sales, industrial production and consumer confidence from the U of Michigan. The consensus expects a limited setback for the confidence data (NY manufacturing and Michigan,). Retail sales growth is expected to slow after a strong August figure. In general, we think that expectations on the US data are no that high. Positive surprises are especially possible in retail sales and production.
Of late, global factors were the main driver for the dollar. Regarding the data, the focus of FX markets was more on price data rather than on activity data. Even so, if yesterday's slightly higher than expected CPI would be followed by a set of decent activity data, it should solidify a ST floor for the dollar going into next week's Fed meeting. Yesterday, USD/JPY and EUR/USD tested/came closer to first technically significant resistance/support at respectively 110.67/95 and 1.1823. A break /real test was blocked by the North Korea headlines. Will today's US eco data be able to do the job? Clearing these levels in a sustainable way would call off the USD negative momentum short-term. However, if the break doesn't succeed today, it would be disappointing for USD bulls.
Global context. The euro remained strong last week even as the ECB delayed communication on APP tapering till October and as Draghi kept a soft tone. Markets apparently took the view that ECB normalisation will come anyway. At the same time, the dollar lost further interest rate support as global uncertainty kept US yields on a downward trajectory. Finally, the decline in US yields and of the dollar had gone far enough given recent US eco data, which remained fairly good. A technical correction occurred this week. The dollar in the first place needs an improvement in global sentiment and higher yields. US data might become noisy due to the impact of the hurricanes and can cloud the Fed's outlook and complicate a USD rebound. In this context, we want more confirmation that the recent bottoming out process in US yields and in the dollar might be the start of more sustained USD gains. We keep a close eye on how the test of first important technical levels turns out (cf supra). A break of EUR/USD below 1.1823 would open the way to the 1.1662 correction low. We remain cautious on a sustained upside break in USD/JPY .
EUR/USD consolidation off recent top. Will US data be strong enough for a downside test/break?
EUR/GBP
BoE rate hike signal propels sterling
Yesterday, the Bank of England voted 7-2 to leave its policy rate unchanged. However, the BoE clearly signalled that the recent up-tick in inflation can no longer be ignored if eco data continue to come in as expected. A rate hike in the coming months is very well possible. Sterling started a new upleg. EUR/GBP declined more than one big figure and fell below the 0.89 big figure. Cable also set a new ST top in the 1.34 area.
There are no important UK eco data today. However, BoE's Vlieghe will give a speech. He is a well-known dove. We don't expect that he will be able to change to market repositioning after yesterday's clear message from the BoE Minutes. After yesterday's jump of sterling, quite some good news should gradually be discounted. Even so, we don't row against the sterling positive tide yet. The EUR/GBP correction might still go a bit further.
From a technical point of view, EUR/GBP cleared 0.8854/80 resistance (top end June), opening the way for a protracted August rebound. The move was the result of euro strength. Simultaneously, UK price data were soft enough to keep the BoE side-lined. Recent price data amended this story and the ST-trend reversal of sterling was confirmed/reinforced by yesterday's BoE comments. Medium term, we maintain a EUR/GBP buy-on-dips approach as we expect the combination of relative euro strength and sterling softness to persist. However, the prospect of some withdrawal of policy stimulus probably has put a solid floor for sterling ST term. We let the current correction do its job, before selling sterling versus the euro.
EUR/GBP: BoE rate hike signal accelerates GBP-rebound
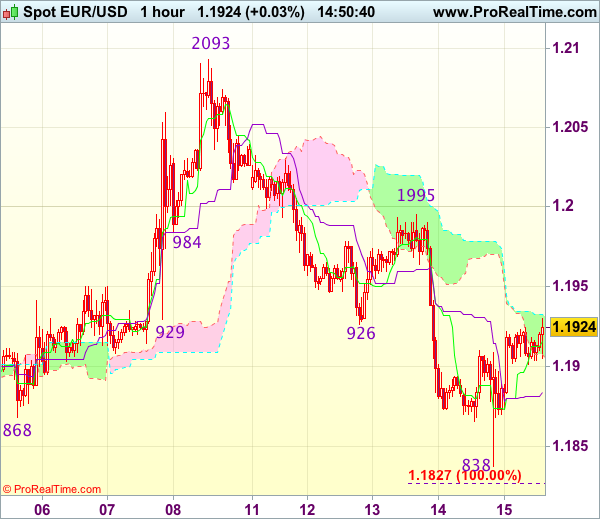
Trade Idea : EUR/USD – Hold long entered at 1.1855
EUR/USD - 1.1925
Most recent candlesticks pattern : N/A
Trend : Near term down
Tenkan-Sen level : 1.1916
Kijun-Sen level : 1.1884
Ichimoku cloud top : 1.1931
Ichimoku cloud bottom : 1.1905
Original strategy :
Bought at 1.1855, Target:1.1955, Stop: 1.1835
Position : - Long at 1.1855
Target : - 1.1955
Stop : - 1.1835
New strategy :
Hold long entered at 1.1855, Target:1.1955, Stop: 1.1865
Position : - Long at 1.1855
Target : - 1.1955
Stop : - 1.1865
As the single currency found support at 1.1838 yesterday and has staged a rebound, retaining our near term bullishness and consolidation with mild upside bias remains for another bounce to 1.1950, however, break of 1.1965-70 is needed to signal low is formed at 1.1838, bring further gain towards resistance at 1.1995 which is likely to hold from here.
In view of this, we are holding on to our long position entered at 1.1855. Below 1.1865-70 would risk retest of said support at 1.1838, break there would signal recent decline from 1.2093 top is still in progress and may extend weakness to 1.1823 support, however, still reckon downside would be limited to 1.1800 and bring rebound later.
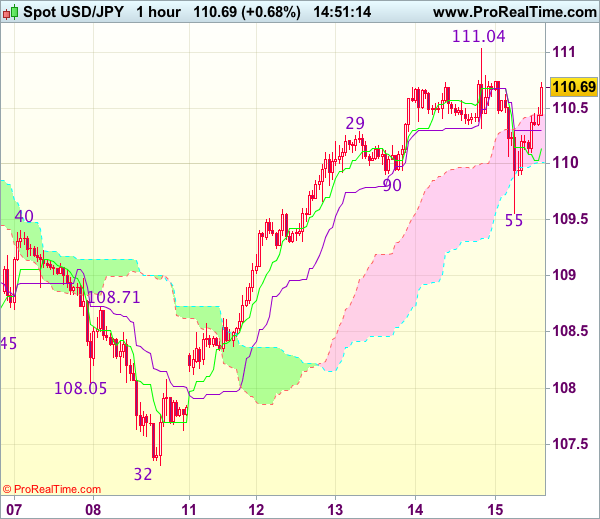
Trade Idea : USD/JPY – Target met and stand aside
USD/JPY - 110.67
Most recent candlesticks pattern : N/A
Trend : Up
Tenkan-Sen level : 110.14
Kijun-Sen level : 110.30
Ichimoku cloud top : 110.44
Ichimoku cloud bottom : 110.01
Original strategy :
Bought at 109.65, met target at 110.65
Position : - Long at 109.65
Target : - 110.65
Stop : -
New strategy :
Stand aside
Position : -
Target : -
Stop : -
Although the greenback retreated quite sharply after using to 111.04 yesterday, dollar found good support at 109.55 (we recommended to buy at 109.65 and a long position was entered) and has rebounded in line with our bullishness expectation (our long position reached target at 110.65 with 100 points profit), however, reckon said resistance at 111.04 would hold on first testing, bring further consolidation. Only a firm break above this level would signal recent upmove has resumed for headway to 111.40-50 but previous resistance at 111.71 should hold from here.
As we have taken profit on our long position entered at 109.65, would not chase this move here and would be prudent to stand aside for now. Below the Kijun-Sen (now at 110.30) would prolong consolidation, bring weakness to 110.00 but said support at 109.55 should remain intact, bring another rebound later.
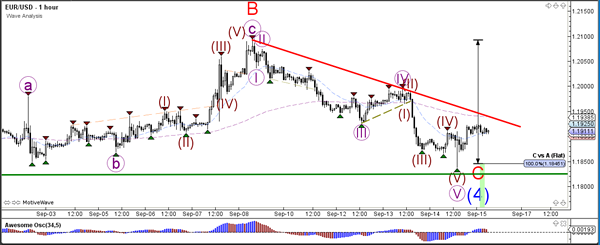
Daily Technical Analysis: EUR/USD Completes ABC Correction At 100% Fibonacci Level
Currency pair EUR/USD
The EUR/USD made a bullish bounce at the 100% Fibonacci level of wave C (red). Price will need to break above the resistance trend line (red) before the completion of wave 4 (blue) could become more likely.
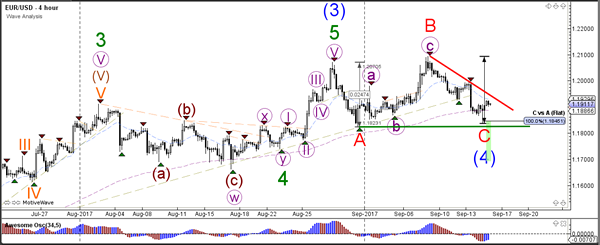
The EUR/USD completed 5 internal waves (brown) within wave 5 (purple) and price bounced at the previous bottom (green line) of wave A. A break of resistance (red) could indicate the start of a new uptrend.
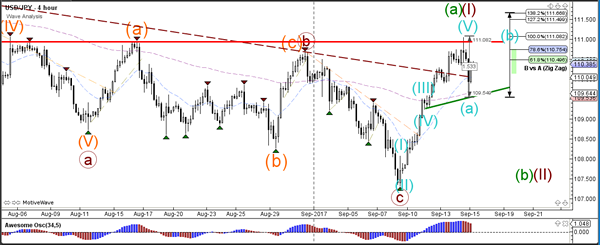
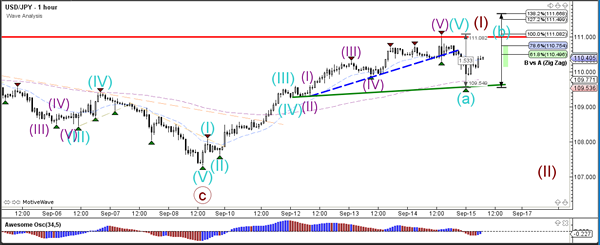
Currency pair USD/JPY
The USD/JPY made a bearish bounce at the strong horizontal resistance level (red). This could indicate the start of a wave 2 (brown) or alternatively a wave B (green). The correction could unfold via an ABC (blue) and therefore the Fibonacci levels of wave B vs A could act as resistance.
The USD/JPY is in a wave B (blue) unless price manages to break above the 138.2% Fibonacci level. A break below support (green) could see price make a bearish breakout within wave 2 (brown).
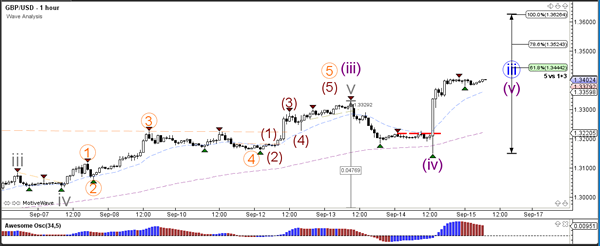
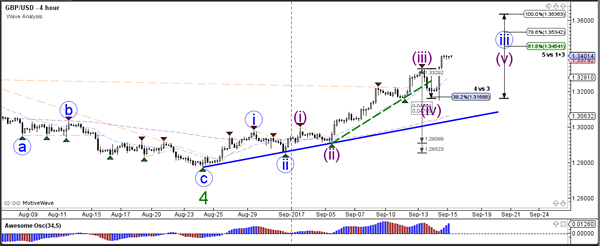
Currency pair GBP/USD
The GBP/USD indeed bounced at the Fibonacci levels of wave 4 (purple) retracement and continue with the larger uptrend of wave 3 (blue).
The GBP/USD could push towards the Fibonacci targets of wave 5 (purple).
USD/CHF Daily Outlook
Daily Pivots: (S1) 0.9598; (P) 0.9651; (R1) 0.9686; More....
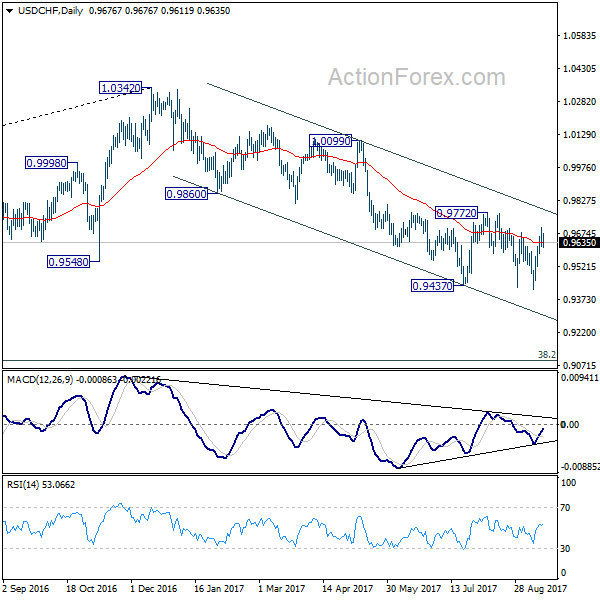
At this points, USD/CHF still cannot sustain above 0.9679 resistance. Intraday bias remains neutral first. Firm break of 0.9679 will indicate near term reversal and turn bias to the upside for 0.9772 resistance for confirmation. However, below 0.9582 minor support will maintain bearishness and turn bias to the downside for 0.9420 low first. Sustained break of 0.9420 will resume whole decline from 1.0342.
In the bigger picture, current development suggests that 0.9443 key support (2016 low) could be taken out firmly as down trend form 1.0342 extends. There are various interpretation of the price actions. But in any case, medium term outlook will stay bearish as long as 0.9772 resistance holds. Current down trend could extend to 38.2% retracement of 0.7065 (2011 low) to 1.0342 (2016 high) at 0.9090. However, break of 0.9772 will indicate that USD/CHF has successfully defended 0.9443 again and turn outlook bullish for 1.0099 resistance.