
Sample Category Title
Trade Idea: GBP/USD – Buy at 1.2990
GBP/USD – 1.3045
Original strategy :
Buy at 1.2880, Target:1.3080, Stop: 1.2820
Position: -
Target: -
Stop: -
New strategy :
Buy at 1.2990, Target:1.3160, Stop: 1.2930
Position: -
Target: -
Stop:-
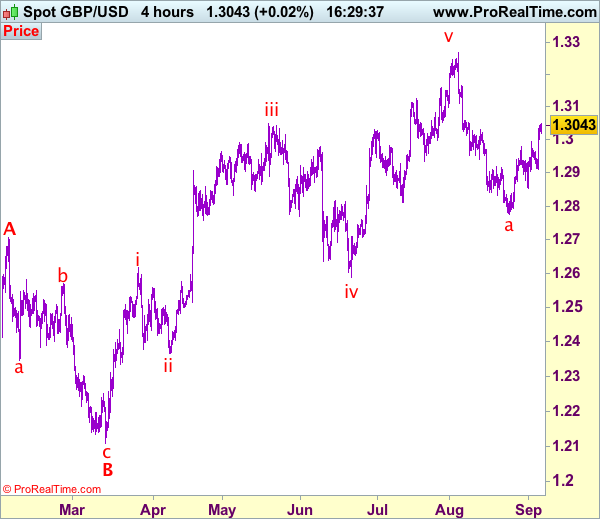
As cable has surged again after finding renewed buying interest at 1.2909 yesterday, adding credence to our view that the fall from 1.3269 has ended at 1.2774 and mild upside bias remains for this move to bring retracement of the fall from 1.3269 to 1.3080 (61.8% Fibonacci retracement of 1.3269-1.2774), then 1.3120-25, however, near term overbought condition should limit upside and resistance at 1.3165 should hold from here, bring retreat later.
In view of this, would not chase this rise here and would be prudent to buy sterling on dips. Below 1.2955-60 would defer and suggest top is possibly formed, risk weakness to 1.2909 but only break there would add credence to this view, bring further fall to 1.2880 and later test of indicated support at 1.2852, however, as low has been formed at 1.2774, downside would be limited and 1.2800 should hold, bring another rebound later.
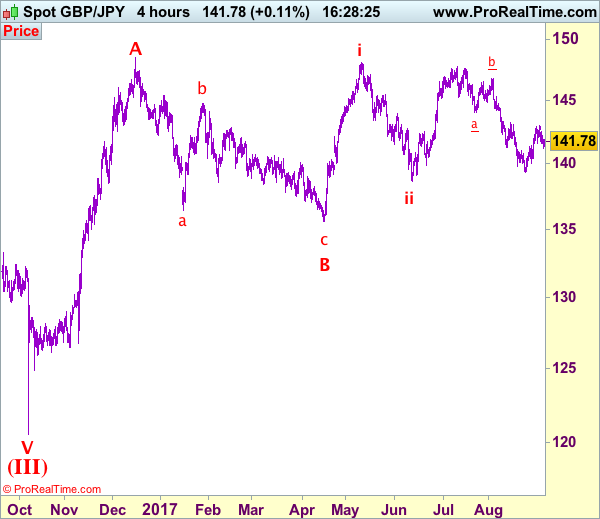
Our preferred count on the daily chart is that cable's rebound from 1.3500 (wave (A) trough) is unfolding as a wave (B) with A ended at 1.7043, followed by triangle wave B and wave C as well as wave (B) has ended at 1.7192, the subsequent selloff is the larger degree wave (C) which is still unfolding with minor wave (III) of larger degree wave 3 ended at 1.1986, hence wave (IV) correction is in progress which could either be a triangle wave (IV) of a complex formation but upside should be limited to 1.3500 and price should falter well below 1.4000, bring another decline in wave (V) of 3 for weakness to 1.1500, then 1.1200.
AUD/USD: Gross Domestic Product
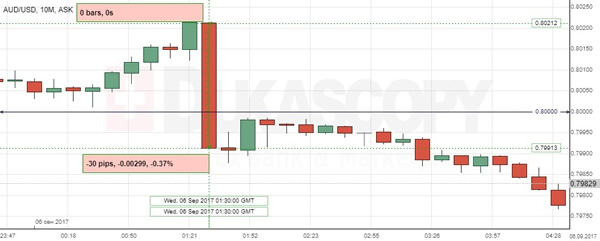
The Aussie depreciated significantly against the American counterpart, as the Australian Bureau of Statistics report showed that the country's economy recorded a strong GDP growth in the Q2. Following the data release, the AUD/USD currency pair fell 0.37% or 30 base points to continue trading session below the 0.8000 level.
The Australian GDP rose 0.8% in the June quarter, in line with analysts' estimates. The solid increase is likely to exaggerate expectations for the strong growth trend in the future, as there was a weak 0.3% gain in the prior quarter. The further expansion of the Australian economy is set to be encouraged by higher household consumption, while the weakening property market could still poses significant risks.
EUR/USD: US Factory Orders
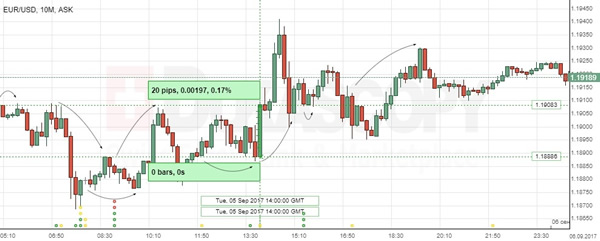
The report showing that the US factory orders marked the buggiest drop in almost three years in July contributed to the jump in EUR/USD. The Euro accelerated gains against the Greenback, edging 20 base points higher to the 1.1908 mark.
The Commerce Department stated that orders for US-made goods tumbled 3.3% in July, as the demand for transportation equipment slumped in the same period. However, capital goods orders were stronger than the prior report showed, suggesting a solid business spending in the early Q3. Moreover, an increase in production could be fuelled by expected rise in demand for motor vehicles, as residents in storm-battered Texas aim to replace damaged cars.
GBP/USD: UK Services PMI
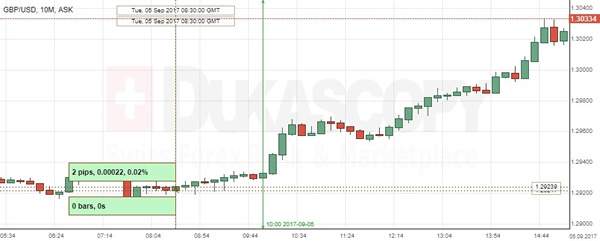
The GBP/USD exchange rate rose quite a bit in the wake of slightly weaker Britain's Services PMI data. However, the Sterling accelerated gains against the US Dollar after the UK inflation report hearings and continued reflecting bullish sentiment in the pair.
Markit reported that its PMI for Britain's services sector declined more than estimated to the 53.2 mark in August, reaching the lowest level since September 2016. The slowdown suggested muted growth in new orders, as lingering uncertainty and weak confidence caused delays in decisions on spending. Overall business expectations were upbeat, though further concerns surrounding the UK political and economic outlook remained on the table.
Trade Idea: GBP/JPY – Stand aside
GBP/JPY - 141.80
New strategy :
Stand aside
Position: -
Target: -
Stop:-
As sterling has recovered again after holding above support at 141.40, retaining our view that further consolidation above this month’s low at 141.20 would be seen and corrective bounce to 142.20-25 cannot be ruled out, however, reckon upside would be limited to 142.50 and price should falter below last week’s high of 143.00, bring another retreat later.
In view of this, below said support at 141.40 would bring test of said last week’s low at 141.20 but break there is needed to revive bearishness and extend the retreat from 143.00 to 141.00 and possibly towards 140.45-50, however, price should stay above another previous support at 140.05. Only a drop below 140.05 support would signal the rebound from 139.35 has ended and risk further fall to 139.70-75, then retest of this recent low at 139;35.
Our preferred count is that larger degree wave V with circle is unfolding from 251.12 with wave (I) 219.34, (II): 241.38 and wave (III) is subdivided into 1: 192.60, 2: 215.89 (23 Jul 2008) and wave 3 ended at 118.87 earlier in 2009. The correction from there to 162.60 is wave 4 which itself is a double three and is labeled as first a-b-c ended at 151.53, followed by wave x at 139.03, 2nd a ended at 162.60, 2nd b at 146.75 and 2nd c leg of wave 4 ended at 163.00. Therefore, the decline from 163.00 to 116.85 is now treated as wave 5 which also marked the end of larger degree wave (III), hence wave (IV) major correction has commenced for retracement of the wave (III) from 241.38 and upside target at 183.95-00 (50% Fibonacci retracement of the wave (II) from 241.38) had been met, a drop below 160.00 would suggest wave (IV) has ended at 195.85, bring decline in wave (V) for initial weakness to 130 (already met) and 120.
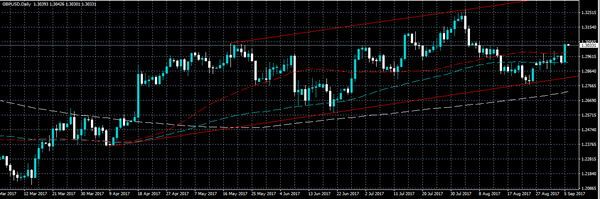
GBPUSD Hits 1.3044
The British pound has moved towards a four-week trading high against the U.S dollar, after weaker than expected United States economic data, provoked a strong sell-off in the U.S dollar index.
So far, the GBPUSD pair has traded as high as 1.3044, with price-action now consolidating well above the 1.3000 level, around the 1.3020-30 support zone.
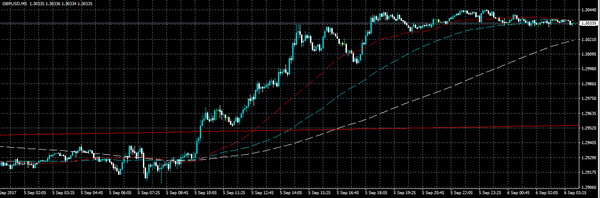
The GBPUSD pair has turned bullish in the short and medium-term, after yesterday's strong breakout from range-bound trading conditions.
Key intraday technical resistance is found at the August 7th price high, at 1.3059, and the monthly pivot point, at 1.3080. Above 1.3080, the 1.3110 and 1.3125 level offer strong weekly price resistance.
Key intraday technical support for the GBPUSD pair is found at the daily pivot point, at 1.2998, and the 50-day moving average, at 1.2980.
Below the 1.2980 level, further intraday support is found at the 1.2967 and 1.2948 levels.
USDJPY Slumps To 108.50
The Japanese yen continued to move higher against the U.S dollar, reflecting the risk-averse mood in the broader markets. The USDJPY pair fell close to one percent overnight, slumping to 108.50, marking its biggest one-day drop in three months.
U.S dollar weakness is also helping to push the USDJPY pair lower, after U.S factory orders data came in at -3.3 percent for the month of August, which was the weakest reading in over three years.
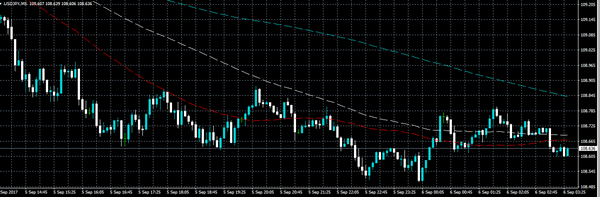
The USDJPY pair remains strongly bearish on all-time frames, with price-action now moving towards the 2017 price low, at 108.13.
Key intraday technical support is found at the former monthly price low, at 108.27, and the 2017 price low. Below the 108.13 level, further weekly support is located at the November 15th, 2016 price low, at 107.76.
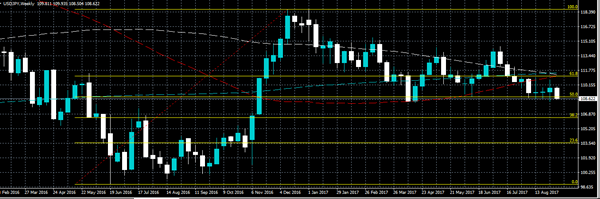
Key intraday technical resistance is found at the 50 percent Fibonacci retracement, of the 118.66 price high to the 98.99 swing price low, at 108.81. Above the 108.81 level, further USDJPY resistance is found at 109.06, and the 50-hour moving average, at 109.31.
Bank Of Canada Headlines Active Wednesday Session
The economic calendar is in full swing on Wednesday, as a deluge of market-moving events are scheduled. None are bigger than the Bank of Canada (BOC) interest rate decision, which is due at 14:00 GMT.
The BOC is expected to keep interest rates on hold at 0.75%, but not everyone is banking on a status quo decision. In fact, many analysts believe the central bank will raise rates on Wednesday after Canada emerged as the G7’s fastest-growing economy in the first half of 2017.
It’s only a matter of time before the BOC hikes rates again. If policymakers don’t pull the trigger on Wednesday, they will likely do so in the next meeting.
On the data front, Germany will release its latest factory orders report at 06:00 GMT. German factory orders are projected to rise 5.8% annually in July, following a 5.1% increase the previous month.
The North American session features several prominent data releases on Wednesday. The US Commerce Department will report on Washington’s July trade balance. The nation’s deficit is expected to widen to $44.6 billion from $43.6 billion the month before.
North of the border, the Canadian government will also report on trade at 12:30 GMT. Canada’s deficit is expected to narrow to $3.3 billion in July from $3.6 billion the month before.
IHS Markit and the Institute for Supply Management will release their own versions of US services PMI on Wednesday. The Markit release is expected to show little deviation in August when compared with the previous month.
Earlier in the day, the Australian government reported that the economy expanded 0.8% in the second quarter. That was in line with the consensus view and nearly triple the previous quarter’s disappointing 0.3% gain.
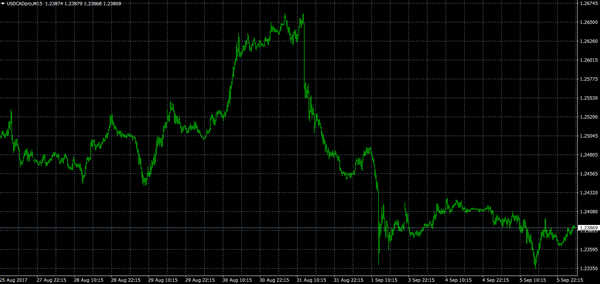
USD/CAD
The loonie was little changed on the eve of the BOC rate decision. Technical indicators are obsolete ahead of the monetary policy announcement. A move to raise interest rates by the BOC will trigger a large rise in the Canadian dollar, which is already testing multiyear highs against the greenback.
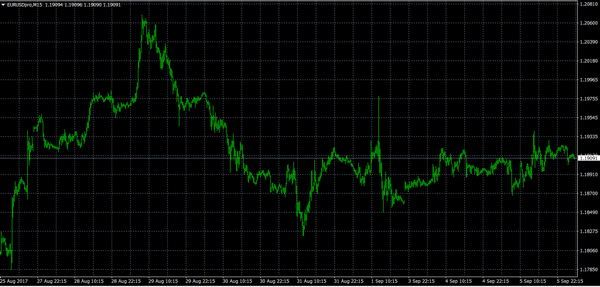
EUR/USD
Like other dollar pairs, the EUR/USD was rangebound on Wednesday as investors eyed fresh trading catalysts. The EUR/USD toed the line at 1.1910 through the early morning hours. Immediate resistance is located at 1.1960. A breach of this level could send prices back toward the psychological 1.2000 region.
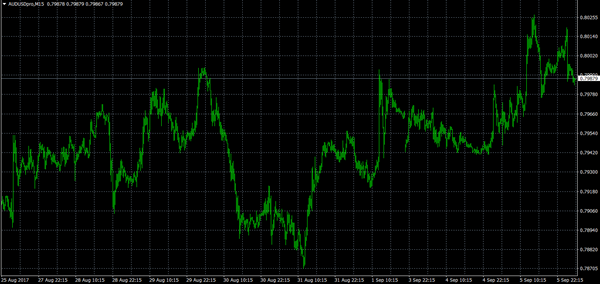
AUD/USD
The Australian dollar held within a narrow range following the GDP report. The AUD/USD exchange rate drifted 0.1% lower to 0.7986. The pair is testing the psychological 0.8000 level, which continues to separate the buyers and sellers. The AUD/USD must first clear the 0.8000 and 0.8026 handles before it can mount a re-test of the year-to-date high of 0.8065. On the opposite side of the ledger, immediate support is located at 0.7920, followed by 0.7880.
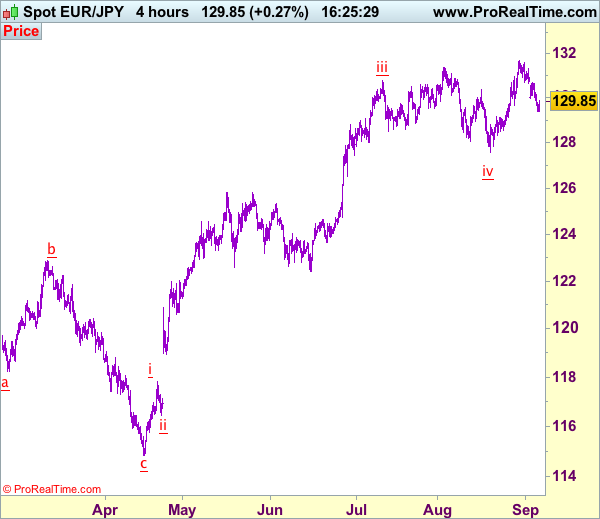
Trade Idea: EUR/JPY – Sell at 130.25
EUR/JPY - 129.88
New strategy :
Sell at 130.25, Target: 128.25, Stop: 130.85
Position: -
Target: -
Stop:-
Although the single currency has recovered after finding support at 129.37 and consolidation with initial upside bias is seen for gain to 130.00, however, reckon upside would be limited to 130.25-35 and resistance at 130.71 should remain intact, bring another decline, below said support at 129.37 would extend the fall from 131.71 top for retracement of recent upmove to 129.10-15, then towards 128.70-75 but support at 128.49 should remain intact.
In view of this, would not chase this fall here and would be prudent to sell euro on recovery as 130.25-35 should limit upside. Above said resistance at 130.71 would revive bullishness and suggest low is possibly formed, bring rebound to 131.00, then test of 131.35, break of latter level would indicate the retreat from 131.71 has ended, bring rest of this level first, above there would confirm recent upmove has resumed and extend gain to 132.00-10 but reckon upside would be limited to 132.50-60 and 133.00-10 should hold from here.
Our latest preferred count is that wave (ii) is ABC-X-ABC which ended at 123.33 and wave (iii) is unfolding with wave iii ended at 100.77, followed by wave iv at 111.57 and wave v as well as the wave (iii) has ended at 97.04, followed by wave (iv) at 111.43 and wave (v) has ended at 94.12 which is also the end of the larger degree v, this also implied the major wave (C) has also ended there, hence major correction has commenced from there with (A) leg unfolding in its lower degree wave c which has possibly ended at 145.69. Under this count, A-B-C wave (B) has commenced with A leg ended at 136.23, wave B at 143.79 and wave C has possibly ended at 149.79.
Our larger degree count is that the decline from 139.26 is wave (C) and is sub-divided into a diagonal triangle i-ii-iii-iv-v with wave i - 105.44, wave ii- 123.33, wave iii - 97.03, wave iv - 111.43, followed by the final wave v as well as the end of wave (C) at 94.12, this also mark the bottom of larger degree wave B. Under this count, major rise in wave C has commenced as an impulsive wave with minor wave III ended at 145.69, wave V is still in progress for further gain to 150.00. Having said that, this so-called wave V could well be the first leg of larger degree 5-waver wave C and this wave C should bring at least a retest of wave A top at 169.97 (July 2008).
Gold Two Factor Story | Aussie GDP Expanded| US Data And Sterling At 1.30 Under Focus
Two Factors Supporting Gold
ISM Non- Manufacturing and Fed Speeches Matter
Sterling At 1.30, For How Long?
Aussie GDP q/q Expanded
Two Factors Supporting Gold
North Korea may have another missile test any day (as there have been a few reports that the country is preparing for such event). More recently, we had more measured approach from Washington especially from president Trump who has adopted a more sensible approach rather than taking it to Twitter. I suppose 'fire and fury' tweet must have shown him that sensitive matter like these needs to be done through U.N
Gold price has retraced from it's high of 1344.44 due to the fact that the US hasn't made any rationale decision. It would be wrong to say that gold price in the recent months have moved higher mainly due to Trump. There are two important ingredients which has cooked the price of gold to this. Firstly, North Korea has reacted more notoriously due to Trump. This factor isn't going to stop anytime soon because of the unpredictable nature of both leaders; Kim Jong and Donald Trump. Finally, the global economic recovery has also supported the demand for the gold price. India and China have both increased their buying of physical metal.
In other words, we do not see the price of gold melting, there are way too many factors which are going to provide the support for the bulls. We maintain our year end target at 1350.
ISM Non- Manufacturing and Fed Speeches Matter
For the dollar index, the focus is more about the slated speeches by different Fed members. Their contrasting views and outlook for the economy makes the foundation for the dollar index. The Fed governor, Lael Brainard warned that the Fed needs to be cautious about their tightening monetary policy. The FOMC member Dudley will be speaking tomorrow and his contrasting views could push the dollar in a different direction. The upcoming US ISM non manufacturing PMI number matters for now. The forecast is for a more optimistic reading (55.8) relative to the previous reading (53.9). The dollar has been haunted by Friday's weaker payroll number and this data has a potential for a turnaround. Geopolitics and natural disasters, both are going to have a meaningful influence on the US GDP numbers and simmering warnings from rating agencies like Standard & Poor aren't aiding the dollar index.
Sterling At 1.30, For How Long?
The sterling dollar pair still enjoying the 1.30 mark against the dollar despite weaker than expected PMI which confirmed that Brexit uncertainty has made the sector to grow at the slowest pace since September.
Aussie GDP q/q Expanded
The Australian economy expanded much faster (0.8%) than the previous reading (0.3%). However, the number matched the expectations and traders have not rewarded the Aussie for that. In other words, the tail wind for the Aussie-dollar pair was not strong enough to keep the price in green territory. Government spending is aiding the growth however the RBA feels comfortable with current stance and it is no rush in changing anything yet. No change in the bank's stance is not overwhelming news for traders.