Sample Category Title
ECB’s Core Inflation Forecast Is Still Too Optimistic
ECB's core inflation forecast still optimistic
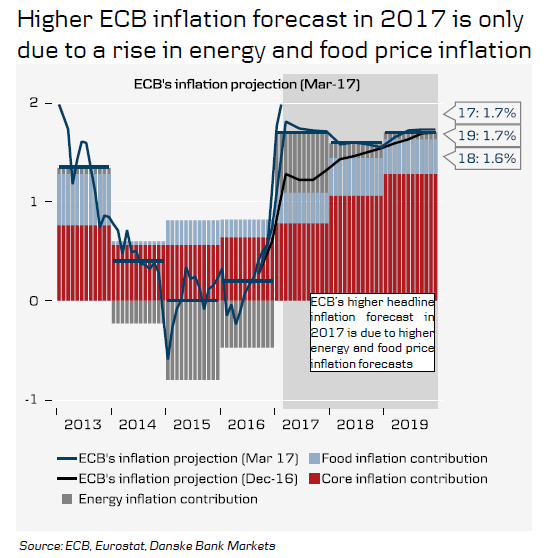
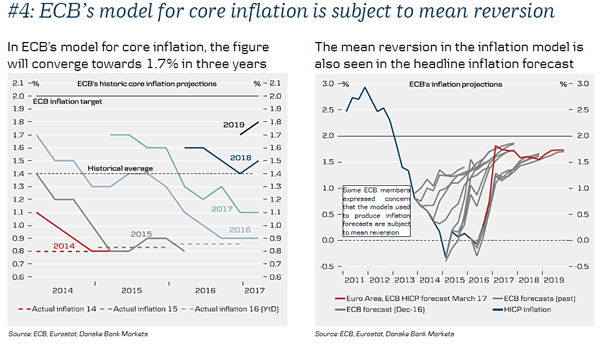
The ECB revised its headline inflation projection considerably higher in 2017, lifting it slightly in 2018 while keeping it unchanged in 2019. The higher nearterm inflation forecast reflects higher energy and food price inflation forecasts from the ECB whereas the core inflation projection was unchanged at 1.1%in 2017.
The ECB revised its core inflation forecast slightly higher for 2018 and 2019 by 0.1pp in both years due to ‘some indirect and second-round effects from higher oil prices, as well as some upward effects from the lower euro exchange rate', see March 2017 ECB staff macroeconomic projections for the euro area.
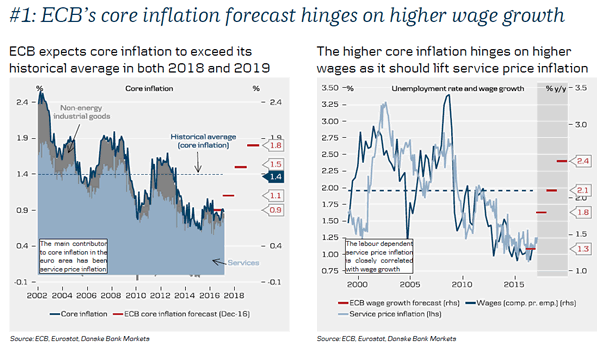
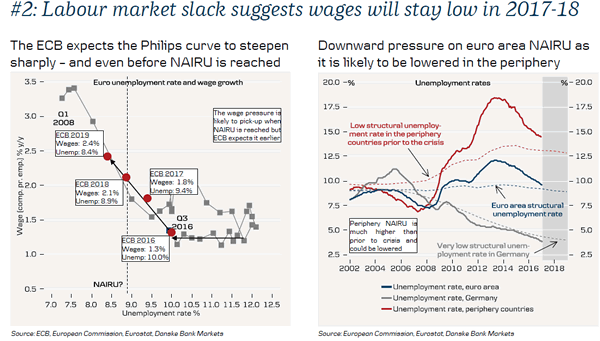
In our view, the ECB's core inflation forecast is still very optimistic due to the following:
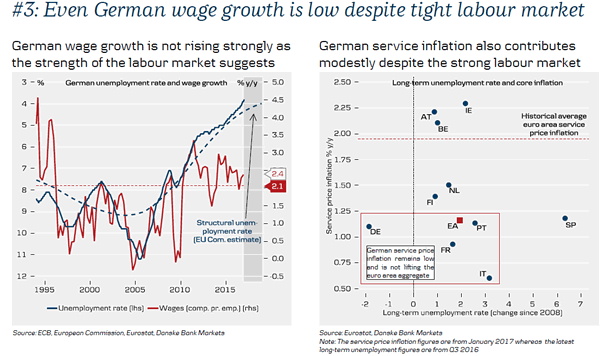
- The ECB's core inflation forecast hinges on higher wage growth
- Labour market slack suggests wages will stay low in 2017-18
- Even German wage growth is low despite the tight labour market
- The ECB's model for core inflation is subject to mean reversion
GBP/USD Elliott Wave Analysis
GBP/USD – 1.2150
GBP/USD – Wave 4 is unfolding as an (A)-(B)-(C) and could have ended at 1.7192
As cable has recovered after falling to 1.2135 last week, suggesting minor consolidation above this level would be seen and corrective bounce to 1.2250-60 cannot be ruled out, however, still reckon resistance at 1.2301 would limit upside and bring another decline later. A break of said support at 1.2135 would extend the fall from 1.2706 to 1.2100, however, as broad outlook remains consolidative, reckon downside would be limited to 1.2040-50 and price should stay above recent low at 1.1986 and bring another rebound later. In the event sterling drops below said recent low, this would signal the major downtrend has finally resumed and extend weakness to 1.1900-10 and then 1.1850 but near term oversold condition should limit downside to 1.1800.
Our preferred count on the daily chart is that cable's rebound from 1.3500 (wave (A) trough) is unfolding as a wave (B) with A ended at 1.7043, followed by triangle wave B and wave C as well as wave (B) has possibly ended at 1.7192, below support at 1.4232 would add credence to this count, then further fall to 1.4000 level would follow but reckon downside would be limited to 1.3655 support and price should stay above previous support at 1.3500.
On the upside, whilst initial recovery to 1.2250-55 cannot be ruled out, reckon upside would be limited to 1.2300-05 and previous support at 1.2347 should turn into resistance and put a lid on cable. A daily close above another previous support at 1.2383 would abort and signal the fall from 1.2706 has ended instead, bring a stronger rebound to 1.2440-50 and possibly towards 1.2500 but price should falter well below resistance at 1.2570, bring further choppy trading later.
Recommendation: Sell at 1.2300 for 1.2100 with stop above 1.2400.
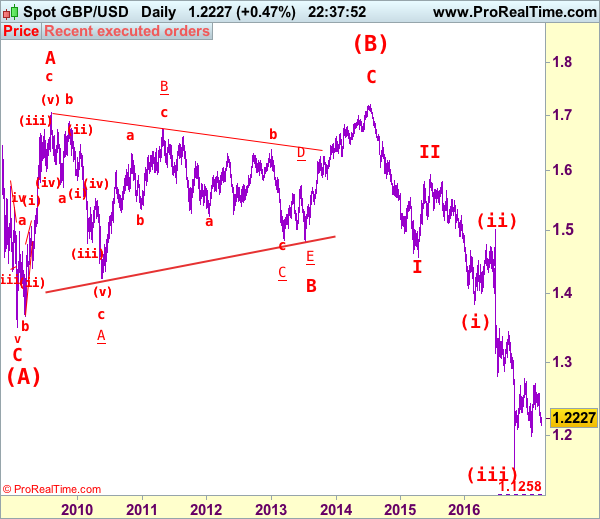
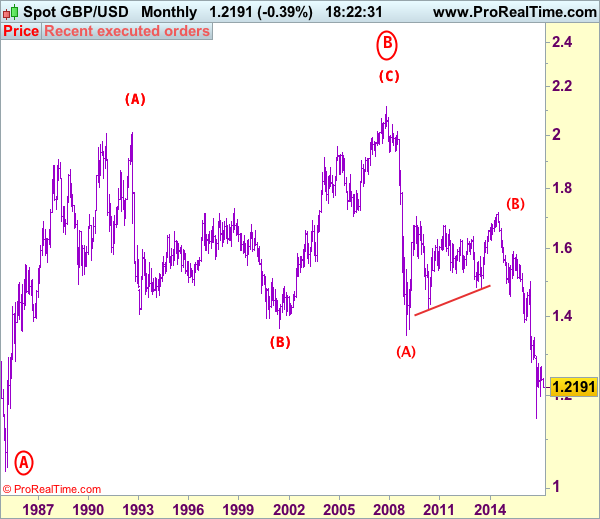
Longer term - Cable's rise from 1.0520 (Feb 1985) to 2.0100 (September 1992) is seen as [A], the decline to 1.3682 is labeled as (B) and (C) wave rally has ended at 2.1162 (9 Nov, 2007) which is also the top of larger degree wave B with circle. The selloff from there is a 5-waver with wave (A) ended at 1.3500 (23 Jan 2009), wave (B) itself is labeled as A: 1.6733, triangle wave B: 1.4813 and wave C as well as top of wave (B) ended at 1.7192 (2014), hence the selloff from there is an impulsive wave (C) with wave I : 1.4566, wave II 1.5930, an extended wave III is unfolding and already exceeded our downside target at 1.3500 and 1.3000, hence weakness to 1.2500 and possibly 1.2000 cannot be ruled out, however, price should stay well above psychological level at 1.0000.
GBP/CHF Elliott Wave Analysis
GBP/CHF – 1.2318
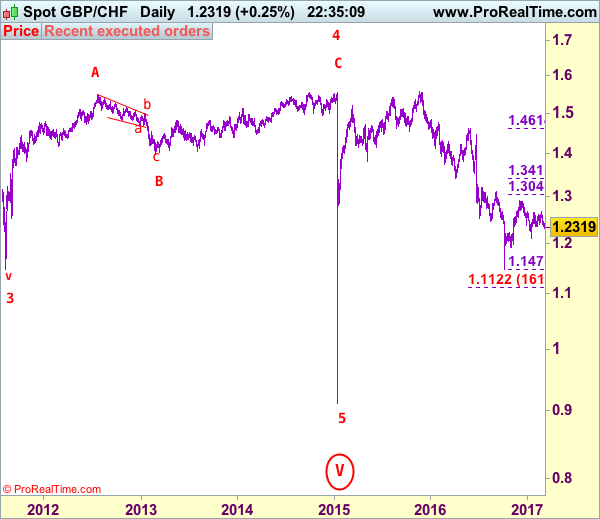
GBP/CHF – Circle wave v ended at 0.9106 and major correction has commenced for subsequent gain to 1.5547.
Sterling finally broke below previous support at 1.2339 and has remained under pressure, suggesting early rebound from1.2102 has ended at 1.2660 last month and consolidation with downside bias is seen for further weakness to 1.2200, however, reckon said support at 1.2102 would hold on first testing. Looking ahead, only a break below this level would extend the fall from 1.2915 to 1.2000-10 and later towards previous support at 1.1962 but reckon key support at 1.1899 would contain downside.
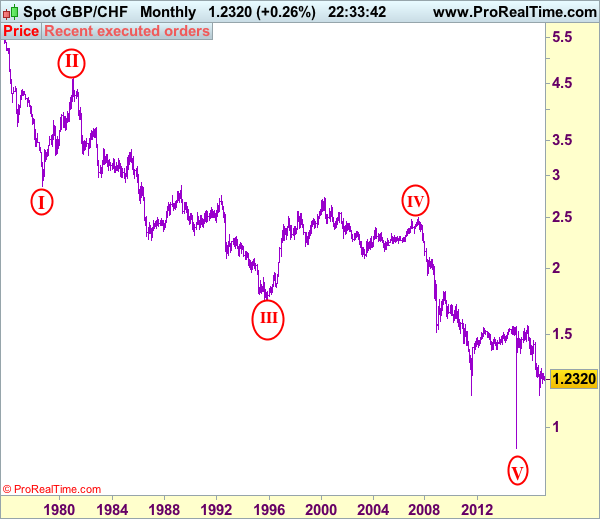
To recap the larger degree count, the selloff from 2.4965 (July 2007) is the beginning of wave V with circle and is labeled as 1: 2.3760, 2: 2.4425, wave 3 extension ended at 1.1470, followed by wave 4 at 1.5547, the quick rebound from 0.9106 suggests wave 5 as well as entire circle wave V could have ended there, hence consolidation with mild upside bias is seen for major correction to take place, bring initial test of 1.5547 (previous 4th of a lesser degree).
On the upside, whilst initial recovery to 1.2400-05 cannot be ruled out, reckon upside would be limited to 1.2450-60 and bring another decline later. Above 1.2500-05 would abort and signal low is formed instead, risk a stronger rebound to 1.2570-75 but break of said resistance at 1.2660 is needed to shift risk back to the upside for the rebound from 1.2102 to extend further gain to 1.2745-55, above there would signal the retreat from 1.2915 has ended at 1.2102 and encourage for subsequent gain to 1.2800-10 first.
Recommendation: Sell at 1.2410 for 1.2210 with stop above 1.2510.
On the Monthly chart, the longer-term count is that major downtrend is under way with circle wave I at 2.8645 (Sep 1.978), then wave II with circle at 4.6175 (Feb 1981), the wave III with circle ended at 1.7425 (Nov 1995) and followed by wave IV with circle at 2.4965 (July 2007 with a short wave C) and wave V with circle has possibly ended at 0.9106. A monthly close above 1.5547 would add credence to this view, bring major correction to 1.7000, then towards psychological level at 2.0000.
Trade Idea: EUR/JPY – Buy at 121.80
EUR/JPY - 122.53
Recent wave: wave v of (C) ended at 94.12 and major correction in wave A has ended at 149.79
Trend: Near term up
Original strategy:
Buy at 121.80, Target: 123.80, Stop: 121.20
Position: -
Target:
Stop: -
New strategy :
Buy at 121.80, Target: 123.80, Stop: 121.20
Position: -
Target: -
Stop:-
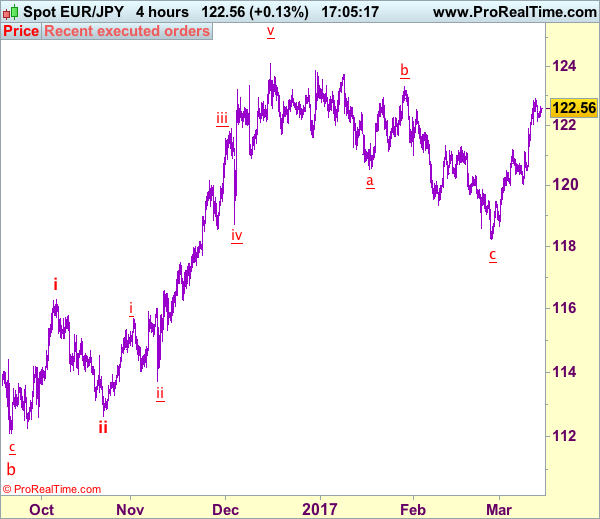
As the single currency retreated after marginal rise to 122.89, suggesting minor consolidation below this level would be seen and pullback to 122.00-05 cannot be ruled out, however, reckon downside would be limited to 121.70-80 and bring another rise later, above said resistance at 122.89 would signal the rise from 118.24 low is still in progress and may extend further gain to 123.30-35. Looking ahead, a sustained breach above this level is needed to retain bullishness and signal early erratic fall from 124.10 top has ended at 118.24, bring further rise to 123.85-90 first.
In view of this, would not chase this rise here and would be prudent to reinstate long on pullback as 121.70-80 should limit downside and bring another rise. Below 121.30 would abort and signal top is formed instead but only break of previous resistance at 121.13 would confirm and bring further fall to 120.45-50 first.
Our latest preferred count is that wave (ii) is ABC-X-ABC which ended at 123.33 and wave (iii) is unfolding with wave iii ended at 100.77, followed by wave iv at 111.57 and wave v as well as the wave (iii) has ended at 97.04, followed by wave (iv) at 111.43 and wave (v) has ended at 94.12 which is also the end of the larger degree v, this also implied the major wave (C) has also ended there, hence major correction has commenced from there with (A) leg unfolding in its lower degree wave c which has possibly ended at 145.69. Under this count, A-B-C wave (B) has commenced with A leg ended at 136.23, wave B at 143.79 and wave C has possibly ended at 149.79.
Our larger degree count is that the decline from 139.26 is wave (C) and is sub-divided into a diagonal triangle i-ii-iii-iv-v with wave i - 105.44, wave ii- 123.33, wave iii - 97.03, wave iv - 111.43, followed by the final wave v as well as the end of wave (C) at 94.12, this also mark the bottom of larger degree wave B. Under this count, major rise in wave C has commenced as an impulsive wave with minor wave III ended at 145.69, wave V is still in progress for further gain to 150.00. Having said that, this so-called wave V could well be the first leg of larger degree 5-waver wave C and this wave C should bring at least a retest of wave A top at 169.97 (July 2008).
Trade Idea: AUD/USD – Stand aside
AUD/USD – 0.7551
Recent wave: Wave 5 ended at 1.1081 and major correction has commenced for fall to 0.7000 and then towards 0.6500-10
Trend: Near term up
New strategy :
Stand aside
Position: -
Target: -
Stop:-
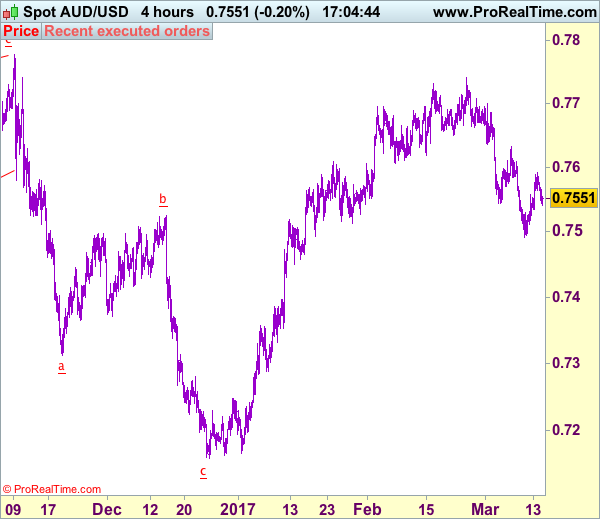
Although aussie has retreated after meeting resistance at 0.7592 and initial downside bias is seen for weakness to 0.7520-25, break of indicated support at 0.7491 is needed to signal recent decline from 0.7741 has resumed and extend weakness to previous support at 0.7543 which is likely to hold on first testing.
On the upside, expect recovery to be limited to 0.7570-75 and said resistance at 0.7592 should hold, bring further consolidation later. Only break of said resistance at 0.7592 would suggest a temporary low has been formed there and consolidation with mild upside bias is seen for further gain to resistance at 0.7633, break there is needed to add credence to this view, bring a stronger rebound to 0.7665-70, above there would suggest the fall from 0.7741 top has ended, then gain to 0.7700 would follow.
On the 4-hour chart, the move from 0.8066 is the wave 5 with i: 0.8860, ii: 0.8315, wave iii is an extended move ended at 1.0183, iv: 0.9706 and wave v has ended at 1.1081 (also the top of entire wave 5). The subsequent selloff is the major correction which is unfolding as ABC-X-ABC and 2nd A leg has ended at 0.8848, followed by a-b-c wave B which ended at 0.9758, hence, 2nd C wave is now in progress and indicated downside target at 0.7000 and 0.6950 had been met, so further fall to 0.6710-20 cannot be ruled out.
EUR/USD Retreats Below 1.0650 Level
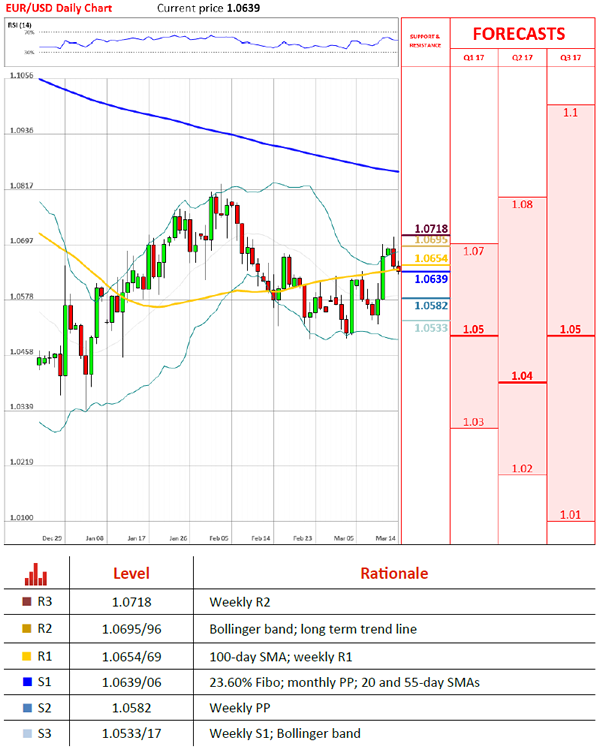
'The pair is facing an increasingly volatile week ahead as the US Fed gets ready to deliver their verdict on rate hikes.' - Steven Knight, Blackwell Global (based on investing.com)
Pair's Outlook
During the early hours of Tuesday's trading session the common European currency retreated against the US Dollar. The fall of the currency exchange rate has been stopped by the combined support of the 23.60% Fibonacci retracement level at 1.0639 and the monthly pivot points at 1.0633. From the upside the rate is being pressured by the 100-day SMA at 1.0654. From a technical perspective it can be seen that the rate is gathering pressure before a larger move. That is consistent with the fact that the Federal Reserve short term rate is about to be revealed.
Traders' Sentiment
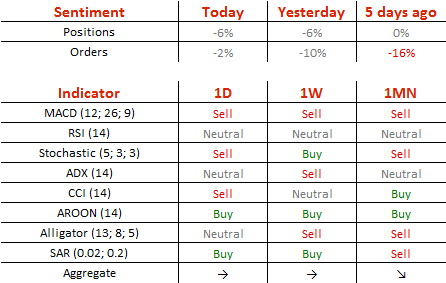
SWFX traders remain bearish, as 53% of open positions are short on Tuesday. Meanwhile, 51% of trader set up orders are set to sell the Euro.
GBP/USD Falls Over Brexit Concerns
'I definitely see sterling as vulnerable after Article 50 is triggered because there is a significant risk that when the negotiations start with the EU, the EU could certainly play quite a difficult hand for the UK to respond to.' – Jane Foley, Rabobank (based on Business Recorder)
Pair's Outlook
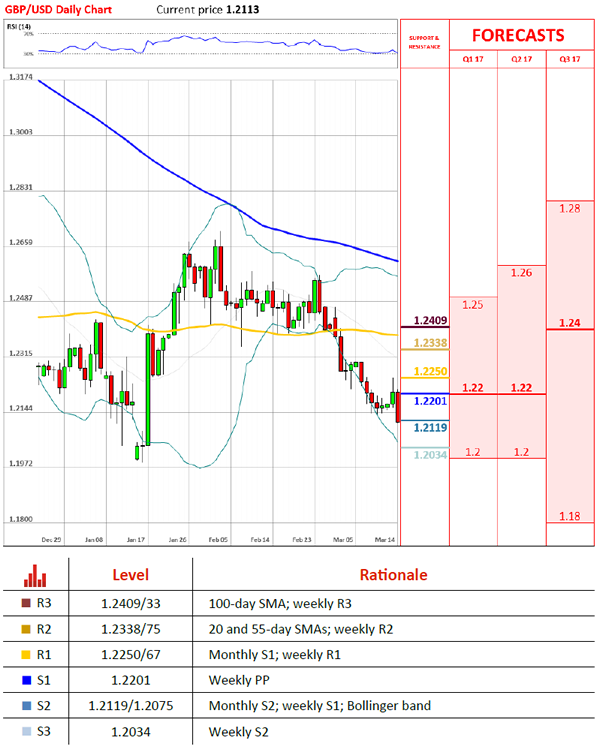
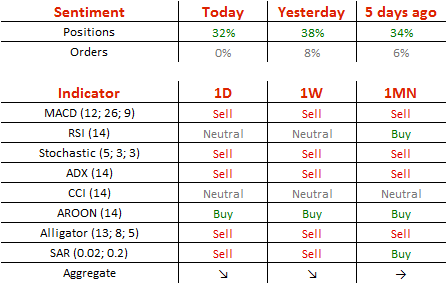
On Monday, the monthly S1 prevented British Pound from appreciating further, resulting in another spark of bearish momentum earlier today. Investors swiftly sold the Sterling amid latest news that Article 50 could be triggered by the end of the month. Nevertheless, the tough demand cluster circa 1.21, formed by the monthly S2, the weekly S1 and the lower Bollinger band, is expected to limit today's losses. Moreover, a close under 1.2150 implies that more weakness this week could follow, leading to a drop even under 1.20, rather than the retest of the trend-line around 1.24. Technical indicators are also in favour of the negative outcome today.
Traders' Sentiment
Today 66% of traders are long the Pound (previously 69%), whereas all pending orders are equally divided between the buy and the sell ones.
USD/JPY Retests Channel’s Resistance
'The latest rise in Treasury yields is underpinning the dollar, but it is a wait-and-see mood that is mostly prevailing in the market ahead of the Fed's decision.' – Barclays (based on Reuters)
Pair's Outlook
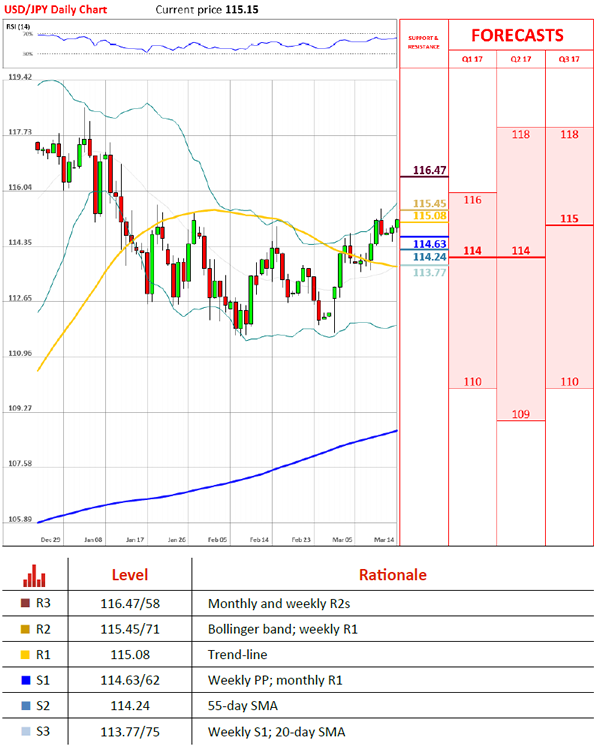
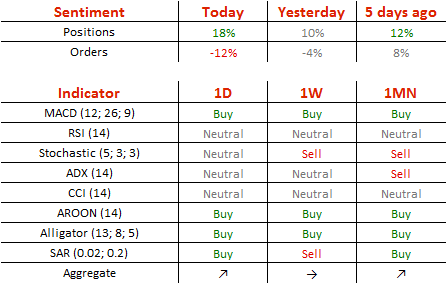
The USD/JPY currency pair behaved in accordance with expectations yesterday, being that it managed to remain above the immediate support area and avoid substantial gains. Nevertheless, the pair remains close to its ascending channel's upper border; at this point positive US fundamental could trigger an upside breach, with the resistance around 115.60 expected to prevent the Buck from edging further up. Disappointment in the data, on the other hand, is to force the US Dollar to erase most if not all gains against the Yen today. According to technical studies the bullish momentum is to prevail, while we still believe the channel's resistance is to remain intact.
Traders' Sentiment
There are 59% of traders holding long positions today (previously 55%). Meanwhile, the share of sell orders inched up from 52 to 56%.
Gold Remains Near 1,200 Mark
'At this moment, an interest rate hike will not be a surprise, so any overreaction (to a hike in rates) is unlikely.' - Mark To, Wing Fung Financial Group (based on Reuters)
Pair's Outlook
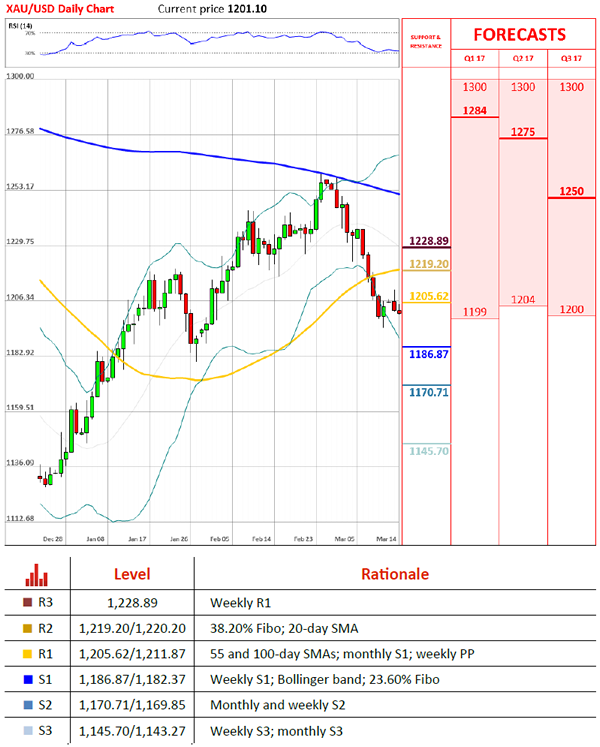
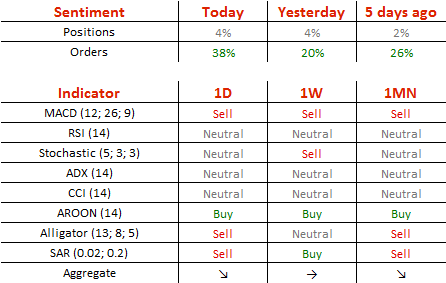
During the previous trading session the bullion failed to move even higher, as the commodity price has retreated back to the 1,200 level, where it remained rather flat on Tuesday morning. However, the bullion's price was positioned to fall, as the closest support level was located at the 1,186.87 mark, where the weekly S1 is located at. In addition, the weekly S1 is strengthened by the lower Bollinger band, which was located at 1,187.74. Moreover, a decline of the price is likely because the 100-day SMA is providing resistance just above the price, as it is located at the 1,205.63 level.
Traders' Sentiment
Traders have not changed their opinion, as 52% of open positions are long. Meanwhile, 69% of trader set up orders are set to buy the bullion.
Forex Technical Analysis
EUR/USD
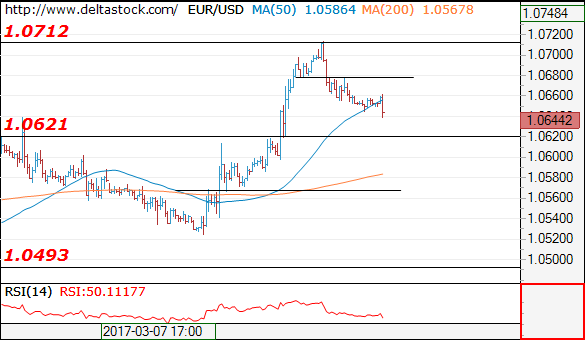
Current level - 10644
The intraday outlook is bearish, for a test and break through 1.0620 support, towards 1.0490 lows. Key resistance lies at 1.0680.
| Resistance | Support | ||
| intraday | intraweek | intraday | intraweek |
| 1.0680 | 1.0710 | 1.0620 | 1.0450 |
| 1.0710 | 1.0870 | 1.0493 | 1.0350 |
USD/JPY
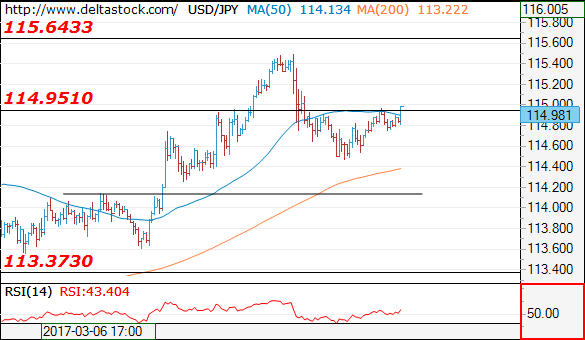
Current level - 114.98
Yesterday's slide completes the corrective pattern below 115.50 and my outlook is bullish, for a rise towards 115.70 resistance area. The latter should be the final leg of the whole rebound above 111.60 lows.
| Resistance | Support | ||
| intraday | intraweek | intraday | intraweek |
| 114.95 | 118.65 | 114.10 | 114.10 |
| 115.65 | 120.00 | 114.10 | 113.37 |
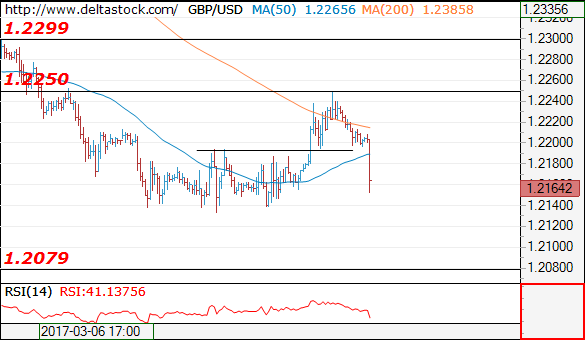
GBP/USD
Current level - 1.2164
The recent break through 1.2185 signals a negative bias, for a slide towards 1.2080, en route to 1.2000 sentiment zone. Crucial on the upside is 1.2250 high.
| Resistance | Support | ||
| intraday | intraweek | intraday | intraweek |
| 1.2185 | 1.2570 | 1.2080 | 1.2080 |
| 1.2300 | 1.2705 | 1.2000 | 1.1984 |