Sample Category Title
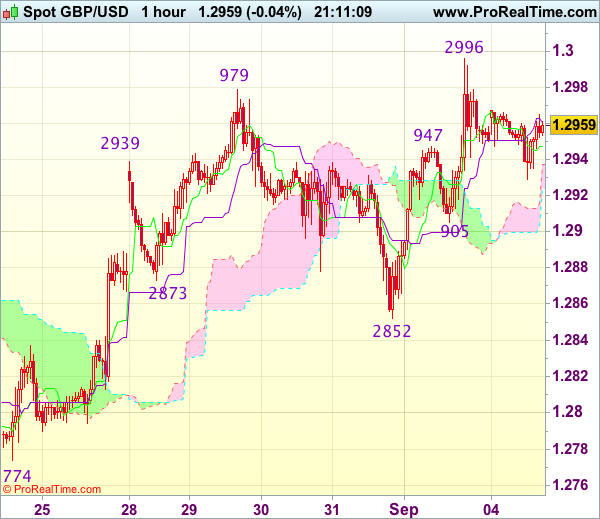
Trade Idea Update: GBP/USD – Stand aside
GBP/USD - 1.2955
New strategy :
Stand aside
Position : -
Target : -
Stop : -
Although Friday’s anticipated rally has justified our bullishness, lack of follow through buying on break of previous resistance at 1.2979 suggests upside would be limited to 1.3000 and price should falter below another previous resistance at 1.3032, risk from there is seen for a retreat to take place due to loss of near term upward momentum.
In view of this, would not chase this rise here and would be prudent to stand aside for now. Below 1.2930 would risk test of support at 1.2905 but only break there would signal top has been formed at 1.2996 instead, bring subsequent fall to 1.2875-80 and later towards said support at 1.2852.
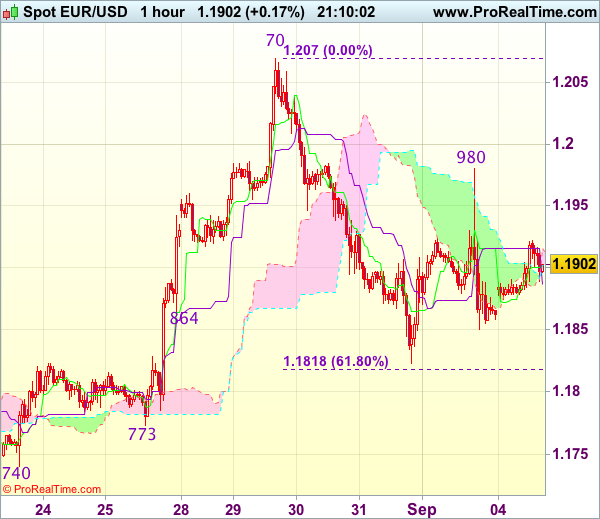
Trade Idea Update: EUR/USD – Sell at 1.1955
EUR/USD - 1.1904
Original strategy :
Sell at 1.1955, Target: 1.1855, Stop: 1.1990
Position : -
Target : -
Stop : -
New strategy :
Sell at 1.1955, Target: 1.1855, Stop: 1.1990
Position : -
Target : -
Stop : -
Although the single currency staged a brief bounce to 1.1980 on Friday, the subsequent anticipated retreat suggests the rebound from 1.1823 has ended there and consolidation with downside bias is seen for another fall to this level, break there would add credence to our view that top has been formed at 1.2070 earlier and extend the fall from there to 1.1815-18 (61.8% Fibonacci retracement of 1.1662-1.2070), then 1.1790-00 but downside should be limited and previous support at 1.1773 should remain intact.
In view of this, we are looking to sell euro again on recovery as 1.1950-55 should limit upside. Only break of said resistance at 1.1980 would abort and signal the fall from 1.2070 has ended at 1.1823 yesterday, bring further gain to 1.2000 and possibly towards 1.2025-30.
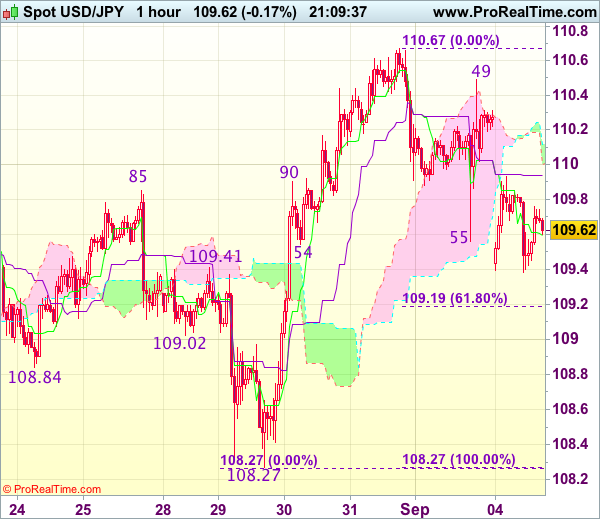
Trade Idea Update: USD/JPY – Stand aside
USD/JPY - 109.58
New strategy :
Stand aside
Position : -
Target : -
Stop : -
The greenback opened lower today and has remained under pressure, suggesting top has possibly been formed at 110.67 last week and downside risk remains for weakness to 109.15-20 (61.8% Fibonacci retracement of 108.27-110.67), however, break there is needed to add credence to this view, bring further fall to 108.95-00, however, reckon 108.55-60 would remain intact.
On the upside, expect recovery to be limited to 109.80 and 110.00-05 should hold, bring another retreat. Only a firm break above resistance at 110.49 would revive bullishness and signal the pullback from this week’s high of 110.67 has ended, bring retest of this level, break there would confirm the rise from 108.27 low has resumed and extend gain towards previous chart resistance at 110.95 later.
EUR/USD Struggling To Hold Ground
EUR/USD increased as the USDX slipped lower in the last hours. Price is fighting hard to climb much higher in the upcoming period, but I'm not sure that will have enough directional energy to do this. Technically, the rate has shown some exhaustion signs, but we still need a confirmation that will drop much deeper in the upcoming period.
It could come higher to retest a resistance level before will drop much deeper again, a corrective phase is still possible as the dollar could be too oversold to drop much deeper.
Euro stays higher even if the Euro-zone data have come in mixed, the Spanish Unemployment Change was reported at 46.4K, much above the 16.3K estimate and versus the -26.9K in the previous reading period, while the PPI increased only by 0.0%, less compared to the 0.1% estimate. Moreover, the Sentix Investor Confidence increased by from 27.7 points to 28.2 points, even if the traders have expected to see a drop to 27.4 points.
EUR/USD increased and could come to retest the upper median line (uml) of the minor ascending pitchfork. A rebound is natural after the false breakdown below the median line (ml) of the minor descending pitchfork. Could be attracted by the confluence area formed at the intersection between the upper median line (uml) with the descending pitchfork's uml. Technically is somehow expected to drop towards the median line (ml) of the minor ascending pitchfork.
GBP/USD Shows Low Activity
Price stays in the buyer's territory but needs a bullish spark to be able to resume the upside movement. It has changed little today and seems a little exhausted, wasn't able to approach and reach the 1.2994 Friday's high. Could retest the 250% Fibonacci line before will climb much higher, is still bullish as long as is trading above this dynamic support.
The near term resistance is at the 1.3046, while the major resistance could be found at the 1.3266 previous high.
EUR/GBP False Breakdown?
EUR/GBP increased and tried to recover after the Friday's drop. Remains to see what will happen because is pressuring the median line (ml) of the minor ascending pitchfork. A valid breakdown will signal a further drop. Has failed to retest the 0.9226 resistance today, but could do this in the upcoming days. Only a valid breakout above the 0.9226 and above the warning line (wl4) will confirm a further increase.
Euro Trades Back Above 1.1900 Level
The EURUSD pair has reclaimed the 1.1900 level, after falling to 1.1850 on Friday, following a report from a from a source close to the ECB, stating that the European Central Bank may not be ready reduce QE by December.
So far in early week trading the euro has moved towards its daily and weekly pivot points, around the 1.1918-20 zone, but was swiftly rejected, and now the price-action trades around the 1.1910 level.
The EURUSD pair remains bearish on an intraday basis, while trading below the 1.1920 level. However, the pair remains strongly bullish in the medium and long term while trading above the 1.1665 level.
Key intraday technical resistance is located at 1.1920, 1.1960 and the Friday swing price high, at 1.1979.
To the downside, key intraday support is located at the EURUSD monthly pivot point, at 1.1884. Below 1.1884, the Friday price low adds support, at 1.1850, as does the former weekly price low, at 1.1823.
Pound Looks Past Weaker Construction PMI
The British pound has recovered early losses against the U.S dollar, and is trading back at the weekly price open, after the GBPUSD pair fell towards to 1.2928, following weaker than expected UK PMI construction data.
Today's United Kingdom PMI construction figure for the month of August, came in at 51.1, which marked the weakest UK construction PMI reading in over twelve months.
The GBPUSD pair now awaits the return of the U.S markets tomorrow, from U.S Labour day, and crucial UK PMI Services data tomorrow, which is expected to show a decline from the previous months reading.
Key intraday technical resistance is found at the 50-day moving average, at 1.2980, and the monthly pivot point, at 1.2990. Above the 1.2990 level, the 1.3047 level offers strong intraday resistance.
Key intraday technical support is located at the current daily price low, at 1.2928, and the 100-day moving average, at 1.2920. Below 1.2920, the 1.2890 level offers strong support, as does the 1.2852 level.
DAX Shrugs Off Strong Investor Confidence Report
The DAX index has started the week with small losses. In the Monday session, the DAX is currently trading at 12,123.50, down 0.17% on the day. On the release front, there are no major events on the schedule. Eurozone Sentix Investor Confidence climbed to 28.2, above the forecast of 27.4 points. Eurozone PPI continues to improve, coming in at 0.0%, short of the estimate of 0.1%.
The eurozone economy continues accelerate, as economic indicators point upwards in the second half of 2017. The Sentix Investor Confidence rose in September, as investors and analysts like what they see from the euro-area economy. Germany, the largest economy in the bloc, continues to look very strong, but other countries such as France and Italy have also posted better numbers in 2017. In August, the German and eurozone manufacturing sectors continued to show strong expansion, buoyed by domestic demand as well as a stronger global economy which has increased demand for German and European exports. A stronger economy has raised questions as to what monetary moves the ECB has planned – will it finally taper its ultra-accommodative monetary policy? The bank's asset purchases program is scheduled to end in December, and analysts expect the ECB to withdraw stimulus in early 2018. Still, the ECB has not provided much guidance as to its plans. ECB President Mario Draghi was mum on monetary policy at last week's meeting of central bankers at Jackson Hole, following the lead of Federal Reserve Chair Janet Yellen. However, the ECB head will not get another free pass this week, as the ECB holds its next policy meeting on Thursday. Any discussion about tapering the ECB's asset purchase program could have a strong effect on the euro's movement.
Global markets are keeping a close eye on key numbers in the US, as the guessing game continues with regard to a rate hike by the Federal Reserve. US employment numbers were unexpectedly soft on Friday, but the dollar shrugged off the weak numbers and managed to post gains against the euro. Nonfarm employment change slowed to 156 thousand, well below the estimate of 180 thousand. This marked a 3-month low. However, with the US labor market still close to capacity (the unemployment rate is just 4.4%), the markets can be forgiving over a softer nonfarm payroll report. Wage growth, or the lack of it, is a more pressing concern. Average Hourly Earnings posted a small gain of 0.1%, missing the estimate of 0.2%. This was down from 0.3% in the previous report, and matched the weakest gain seen in 2017. The lack of wage gains has impacted on inflation levels, which remain well below the Fed's inflation target of 2%. Soft inflation has dampened enthusiasm for a final rate hike in 2o17, with the odds of December increase pegged at just 37%.
AUDJPY In Neutral Bias After Entering Cloud
AUDJPY is looking increasingly neutral in the short term as the pair continues to consolidate from its 1½-year high of 89.41 set in July. Prices have moved back inside the Ichimoku cloud after finding resistance at the top of the cloud, as well as from the 23.6% Fibonacci retracement level of the June-July upleg from 81.77 to 89.41.
The RSI has dipped back to the 50 neutral level after a brief climb to 59.75 on Friday. The MACD is just about positive with a slightly bullish tilt as it's above the red signal line. Should the pair attempt another upside push, the 23.6% Fibonacci level at 87.60 will likely again act as resistance. Friday's 3½-week high of 87.93 is the next resistance to watch, followed by the previous congestion area of around 88.20. A break above this level would open the way towards the July top of 89.41.
Alternatively, if prices turned lower, immediate support would come from the tenkan-sen line at 86.80. Further losses would bring into view the 38.2% and 50% Fibonacci levels at 86.50 and 85.60 respectively. A breach of the 50% Fibonacci level could accelerate the declines towards the 200-day moving average, currently at 85.38, and the 61.8% Fibonacci level at 84.70. It would also shift the bias to negative as it corresponds with the bottom of the cloud.
In the medium term, the outlook remains bullish given the positively aligned 50- and 200-day moving averages. However, without a successful challenge of July's 1½-year high, the positive outlook would be at risk of turning neutral.