Sample Category Title
Central Bank Speakers Take The Spotlight
Today, the economic calendar is very light in terms of data releases. That doesn’t imply a quiet day though, as we have a plethora of central bank speakers on the agenda. In the UK, focus will be on BoE MPC members Andy Haldane and Ben Broadbent. Following the latest BoE meeting, both Haldane and Governor Carney hinted that even though they voted for rates to remain unchanged, they could still support a rate hike later this year. Given that MPC members McCafferty and Saunders voted for a rate hike at that meeting, this suggests that 4/8 members currently on the Committee could vote for a hike soon.
This places a lot of emphasis on Broadbent’s comments, as he has not expressed his opinion on policy recently. If he shares a similar view to Haldane and Carney, it would imply that the majority of the MPC is now leaning towards a hike, a factor that could support GBP.
GBP/USD traded in a consolidative manner on Monday, staying between the key support barrier of 1.2850 (S1) and the resistance of 1.2910 (R1). The rate is also trading above the prior downside resistance line taken from the peak of the 18th of May, which keeps the door open for a rebound and a test near the 1.2910 (R1) line. A decisive break above that level is possible to open the way for our next resistance hurdle of 1.2975 (R2). The catalyst for such a move may be hawkish signals by BoE’s Broadbent today.
Elsewhere, ECB Executive Board member Benoit Coeure will deliver remarks at the FX Contact Group meeting. In the US, the main event will probably be a speech by Fed Board Governor Lael Brainard on ‘Normalising Central Banks' Balance Sheets’. Brainard is usually among the doves of the FOMC. In fact, a few days before the June FOMC meeting, where she voted for a rate hike, she appeared quite cautious and said that if soft inflation data persist, that could lead her to reassess the appropriate path of policy. Given that the nation’s core CPI rate declined further after these comments, we think she will probably reiterate an equally cautious view today. Something like that could weigh on the dollar, but given that market participants are aware of her stance, any negative reaction may be modest.
Survey suggests Australian wages accelerated in Q2
According to the NAB business survey for June, Australian wage growth accelerated in Q2. This is quite important in our view, given that the softness in wages was one of the main reasons that RBA policymakers have refrained from shifting to a more optimistic bias as many of their counterparts have. More signs that wages are picking up in the coming months could generate speculation that the RBA could change its tone soon, especially considering that the rest of the Australian economy is solid. Until then, however, we think that the AUD may underperform most of its major counterparts, particularly the EUR, GBP and CAD. We base this on the fact that the ECB, the BoE and the BoC, have all shifted to a more hawkish stance recently, supporting their respective currencies.
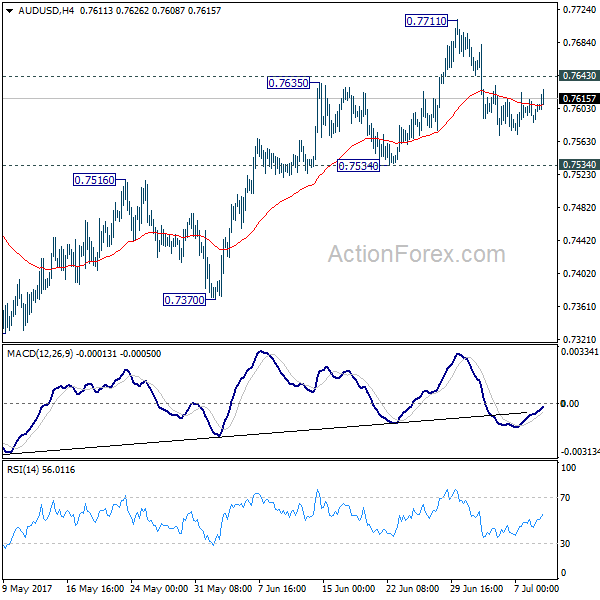
AUD/USD has been trading in a sideways mode between 0.7575 (S1) and 0.7630 (R1) since the 4th of July. As such we prefer to take the side lines for now and wait for the rate to exit that range. Nevertheless, given that the decline started on the 30th of June came after the rate tested the longer-term downside resistance line taken from the high of the 21st of April, we believe that there is a higher likelihood for a downside exit, rather than an upside. A decisive dip below 0.7575 (S1) could confirm the case and is possible to set the stage for extensions towards our next support barrier of 0.7525 (S2).
As for the rest of today’s highlights:
The only noteworthy indicators we get throughout the day will be from the US. The NFIB small business optimism index for June and JOLTS job openings for May are both due out, though no forecast is available for either figure.
GBP/USD
Support: 1.2850 (S1), 1.2800 (S2), 1.2760 (S3)
Resistance: 1.2910 (R1), 1.2975 (R2), 1.3030 (R3)
AUD/USD
Support: 0.7575 (S1), 0.7525 (S2), 0.7500 (S3)
Resistance: 0.7630 (R1), 0.7680 (R2), 0.7710 (R3)
GBPUSD Bearish In Short-Term, Prices Falling In Down Sloping Channel
GBPUSD is in a downtrend in the short-term after falling from the June 30 high of 1.3029. The risk remains to the downside as the market is falling in a down sloping channel on the 4-hour chart.
The RSI indicator is below 50, which also asserts the bearish bias in the market. However, the indicator has flattened out, suggesting downside momentum has faded, leading to consolidation in the near-term or possibly a pullback in prices.
GBPUSD has found support in the 1.2860 area. This is the 38.2% Fibonacci retracement level of the upleg from 1.2588 to 1.3029. Should this level fail to hold and prices break below the channel, then the 50% Fibonacci at 1.2808 will be targeted. A deeper decline from here would strengthen the bearish bias.
Only a move above resistance at the 23.6% Fibonacci at 1.2925 would shift the outlook and could bring about a move towards resistance at 1.2983 (6 July high) with scope to re-test the June 30 peak at 1.3029. From there, there would be a resumption of the uptrend that started from the June 21 low of 1.2588.
The short-term bearish bias remains intact for now as the 20-period moving average (MA) crossed below the 50-period MA on July 7, giving a bearish signal.
XAU/USD Analysis: Meets Resistance
The yellow metal continues to trade in accordance with the descending channel pattern, as the commodity price bounced off the support of the channel on Monday. That means that a short term ascending pattern is highly set to reveal itself. The reason or that is the fact that in accordance with the theory the bullion’s price should surge up to the resistance of the channel down. However, the surge has already been hindered by the 55-hour SMA, which on Tuesday morning was located just below the 1,215 mark. Although, it could be observed already during the early hours of the trading session that the metal will make another attempt at breaking through the SMA. If the metal succeeds at that, it will face additional resistance from the 100-hour SMA, which was fluctuating below 1,220 level.
AUD/USD Daily Outlook
Daily Pivots: (S1) 0.7589; (P) 0.7602; (R1) 0.7617; More...
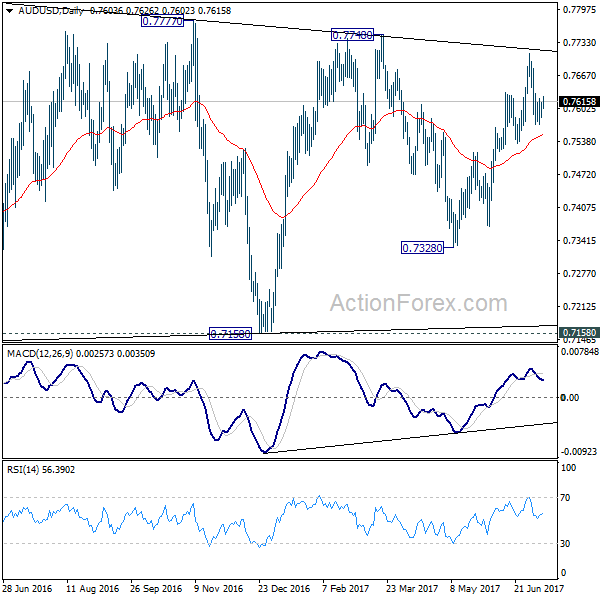
Intraday bias in AUD/USD remains neutral for the moment. With 0.7534 support intact, another rise is in favor. Above 0.7643 minor resistance will bring retest of 0.7711. Break will extend the rally from 0.7328 to 0.7748 resistance and above. At this point, there is no clear sign of range breakout yet. Hence, we'd be cautious on topping again as it approaches medium term fibonacci level at 0.7849. On the downside, break of 0.7534 will indicate near term reversal and turn bias back to the downside for 0.7370 support.
In the bigger picture, we're still treating price actions from 0.6826 low as a corrective pattern. And, as long as 38.2% retracement of 0.9504 to 0.6826 at 0.7849 holds, long term down trend from 1.1079 is expected to resume sooner or later. Break of 0.6826 low will target 0.6008 key support level. However, firm break of 0.7849 will indicate that rise from 0.6826 is developing into a medium term rebound, rather than a sideway pattern. In such case, stronger rise should be seen to 55 month EMA (now at 0.8082) and above.
USD/CAD Daily Outlook
Daily Pivots: (S1) 1.2861; (P) 1.2896; (R1) 1.2925; More....
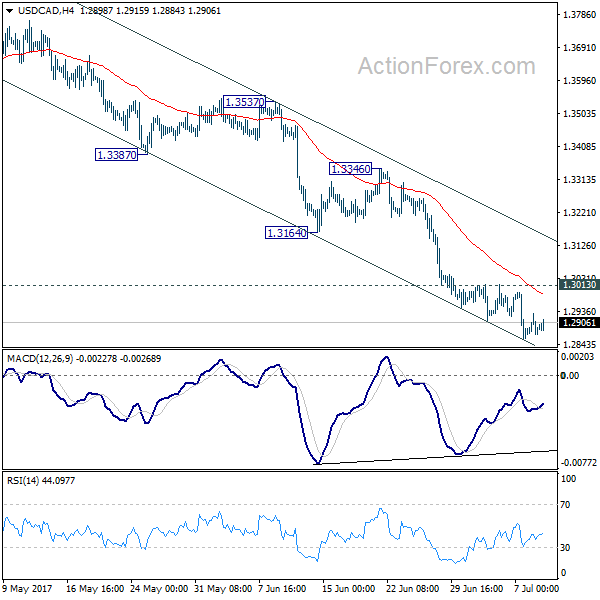
USD/CAD lost some downside momentum with 4 hour MACD crossed above signal line. But with 1.3013 resistance intact, further decline is still expected. Current fall from 1.3793 should extend to retest 1.2460 low. However, break of 1.3013 will indicate short term bottoming, on bullish convergence condition in 4 hour MACD. In such case, intraday bias will be turned back tot he upside for 1.3164/3346 resistance zone first.
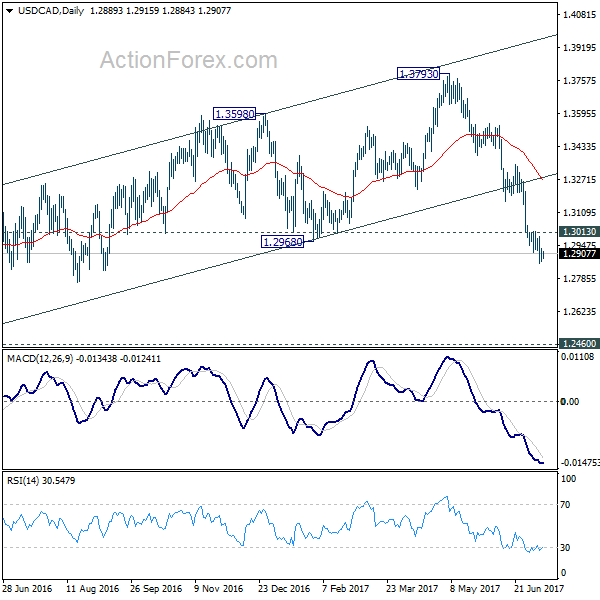
In the bigger picture, price actions from 1.4689 medium term top are seen as a correction pattern. The second leg should have finished at 1.3793. Break of 1.2460 will extend such correction to 50% retracement of 0.9406 to 1.4869 at 1.2048. At this point, we'd look for strong support from there to contain downside and bring rebound. However, firm break there will target 100% projection of 1.4689 to 1.2460 from 1.3793 at 1.1564.
USD/JPY Analysis: Edges Higher On Tuesday
The US Dollar was trading in a small range against the Yen on Monday. The pair entered a consolidation period, thus demonstrating the almost equal force of bulls and bears. The American currency edged higher in the morning session and surpassed the two-month high at 114.34. Technical indicators suggest that the upside momentum has not yet allayed, signalling to further increase in price. The nearest level of resistance is the upper channel boundary circa 114.80. However, the pair is more likely to trade sideways due to lack of major fundamental events, thus being located in the 114.70/80 area on Wednesday morning. In case of stronger downside risks, the 55-hour SMA should support the Greenback from falling lower.
GBP/USD Analysis: Tests Monthly PP
Bears prevailed on Monday's session, pushing the Sterling below the monthly PP at 1.2883. Subsequently, the pair fluctuated around the 20-hour SMA, but nevertheless failed to surpass the aforementioned PP. Apart from some bigger leaps in both directions, the pair demonstrated low volatility that resulted from a lack of market shakers. The same situation is likely to occur in this session, forming a consolidation phase. In this case, it should be apparent that the channel down will not hold any longer and some alteration may be due. Given the bearish sentiment, the pair may trade lower in the upcoming hours; however, upside risks should guide the Pound north in the evening. Gains may be capped at 1.2926, while the bottom limit should be circa 1.2828.
EUR/USD Analysis: Reveals Triangle Pattern
As it was expected, the EUR/USD currency pair has continued to trade near the 1.14 mark. However, recent fluctuations have revealed additional information, which is enforcing the previous forecasts. In general, the hypothesis of a decline of the Euro against the US Dollar is being strengthened by the fact that a new pattern was spotted. The new pattern is a short term descending triangle. The triangle shows that the currency exchange rate is building up downwards pressure, as the support levels from 1.1390 to 1.1380 are holding ground. Most likely the currency pair will fall by the end of the day and reach for the combined support of the weekly S1 and the monthly pivot point at the 1.1331 level.
Forex Technical Analysis: EUR/USD, USD/JPY, GBP/USD
EUR/USD
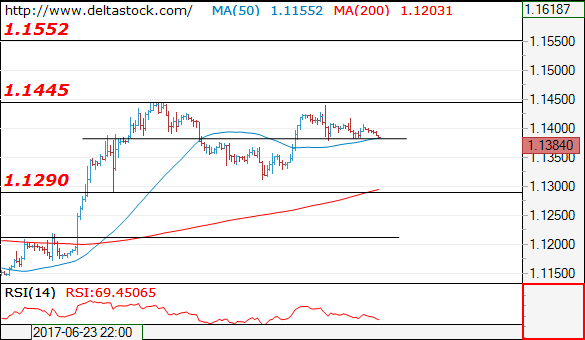
Current level - 1.1384
Yesterday's tight trading range signals a bearish bias, for a break through 1.1380 and slide towards 1.1290+ area. The mentioned dip should be the final leg of the consolidation pattern below 1.1445, before upmove towards 1.1550.
| Resistance | Support | ||
| intraday | intraweek | intraday | intraweek |
| 1.1445 | 1.1550 | 1.1380 | 1.1020 |
| 1.1550 | 1.1610 | 1.1290 | 1.0838 |
USD/JPY
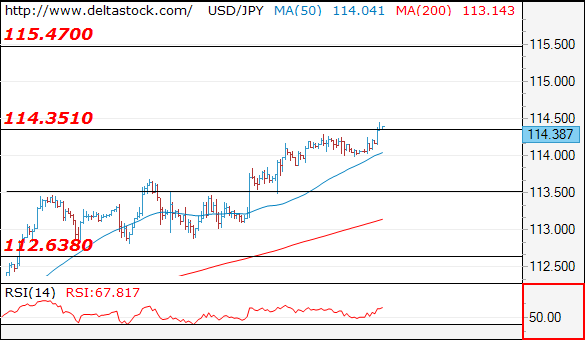
Current level - 114.38
My outlook remains bullish, for a rise towards 115.50 area. Key intraday support lies at 114.00, followed by the major one at 113.50.
| Resistance | Support | ||
| intraday | intraweek | intraday | intraweek |
| 114.50 | 115.50 | 114.00 | 112.60 |
| 115.40 | 115.50 | 113.50 | 108.81 |
GBP/USD
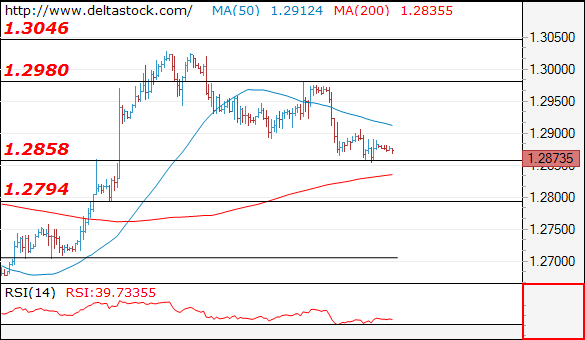
Current level - 1.2873
My outlook is bearish below 1.2900, for a violation of 1.2860, towards 1.2790 area. Crucial on the upside is 1.2980.
| Resistance | Support | ||
| intraday | intraweek | intraday | intraweek |
| 1.2900 | 1.3130 | 1.2860 | 1.2635 |
| 1.2980 | 1.3500 | 1.2790 | 1.2480 |
EUR/USD Daily Outlook
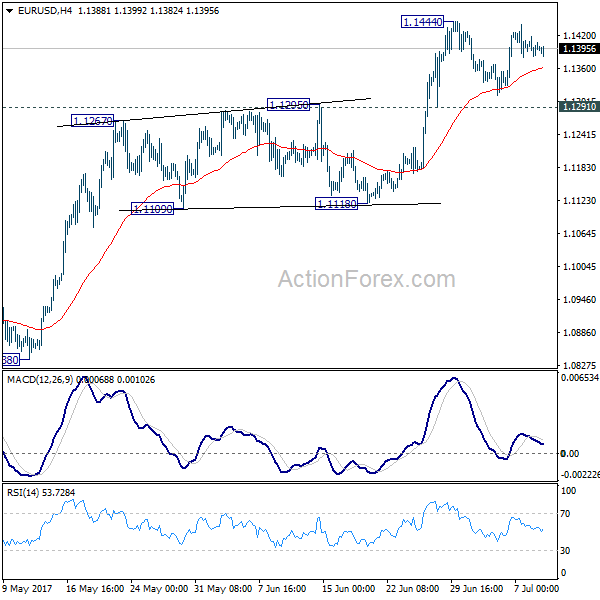
Daily Pivots: (S1) 1.1380; (P) 1.1399 (R1) 1.1417; More.....
EUR/USD's consolidation from 1.1444 is still in progress and intraday bias remains neutral. In case of another fall, downside should be contained by 1.1291 resistance turned support to bring rise resumption. Break of 1.1444 will extend the rally from 1.0339 low to 1.1615 resistance next. Meanwhile, break of 1.1291 will turn focus back to 1.1118 support instead.
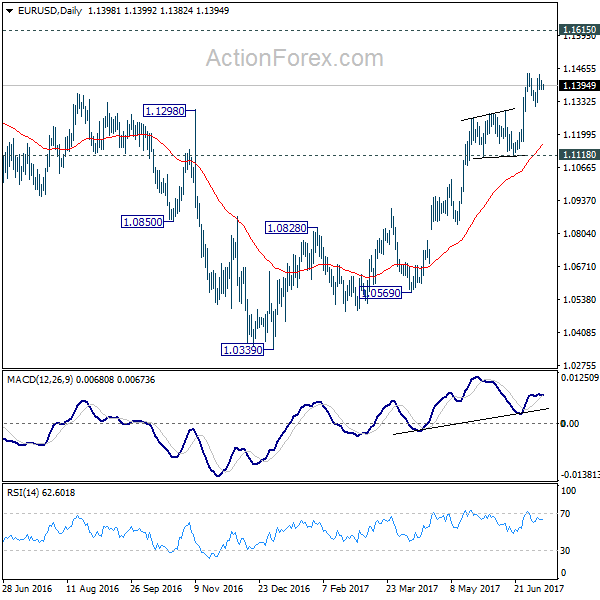
In the bigger picture, the firm break of 1.1298 resistance further affirm medium term reversal. That is an important bottom was formed at 1.0339 on bullish convergence condition in weekly MACD. Further rise would be seen to 55 month EMA (now at 1.1763). Sustained break there will pave the way to 38.2% retracement of 1.6039 (2008 high) to 1.0339 (2017 low) at 1.2516 next. This will now remain the favored case as long as 1.1118 support holds.