
Sample Category Title
Euro Remains Subdued, Markets Eye Yellen Testimony
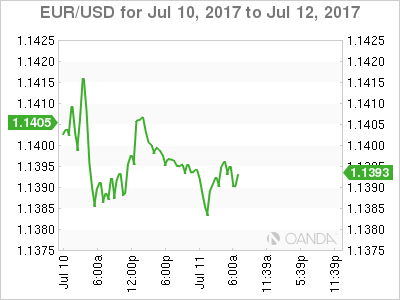
The euro is having a quiet week, as the pair continues to stay close to the 1.14 line. On the release front, there are no major events out of the eurozone. With a lack of data so far this week, investors have been consolidating positions, contributing to the lack of movement from EUR/USD. In the US, today’s key event is JOLTS Job Openings, which is expected to come in at 5.98 million, lower than the previous reading of 6.04 million. On Wednesday, Federal Reserve Chair Janet Yellen will testify before the House Financial Services Committee.
The US wrapped up last week with key employment numbers, and the results were mixed. Nonfarm Payrolls rebounded in June, climbing to 222 thousand. This easily beat the estimate of 175 thousand and marked a 4-month high. However, wage growth remained stuck at 0.2%, shy of the forecast of 0.3%. Weak wage growth has remained soft throughout the first half of 2017, which is somewhat puzzling, as the labor market remains extremely tight, with an unemployment rate of 4.4%. As well, there are widespread reports of a lack of qualified workers, but this hasn’t translated into higher wages.
The markets reacted positively to the solid Nonfarm Payrolls report, but there expectations of a third rate hike in 2017 remain lukewarm. A rate increase in September is very unlikely, with the odds pegged at just 13%, according to the CME Group. As for December, the likelihood of a rate hike is 50%, so the markets will need plenty of convincing that the Fed plans to make a move. What factors will raise the odds of a rate increase? First, second quarter growth will have to improve, after a weak performance in the first quarter, in which GDP rose just 1.4%. Second, stronger inflation levels would boost speculation of a rate hike. Currently, inflation is well below the Fed’s target of 2%, and although Janet Yellen recently stated that the factors weighing on inflation were temporary, investors aren’t convinced. Third, the Fed has outlined plans to reduce its bloated balance sheet, but has avoided providing any specifics. If the Fed started to lower the balance sheet in September, such a move would mark a vote of confidence in the economy and raise speculation of a rate hike to follow in December.
What is Price Action in Forex Trading?
Looking at a candlestick, bar or a line chart for the very first time is both captivating yet confusing. The typical response we hear from newer traders is that it reminds them of a hospital's heart monitor. While this medical appliance is designed to monitor the fluctuations of a heart, the chart is there to record a security's price.
Price action, or 'P.A' for short, is a term used to note the movement of price. To understand the basics of a price chart, however, knowing the anatomy of a candlestick is essential. Candlesticks are used extensively throughout the trading community and are, in our humble opinion, the more visually striking when compared to a bar or line chart.
The picture above shows how a candlestick formation is read. Each candle typically contains both a high (also known as a 'wick'), a low (also known as a 'tail'), an open, close and a body, with each closed candle telling a different story. The wick, assuming that the candle being studied is from the daily timeframe, displays how high the instrument traded throughout the day. By the same token, the tail demonstrates how low price managed to trade on the day. In the event that the newly-painted candle closes above the prior day's close, then a bullish/positive candle would be seen (green). Likewise, if the day's trading concludes with price action closing lower than the previous day's closing point, the candle will then be considered bearish/negative (red). Despite this, one must also take into account that during the trading day, even if the day's candle closes bullishly, bearish candles will still usually be seen if one examines the lower timeframes. Take the daily bullish candle seen below, for example. While the candle body closed positively, the H1 timeframe/chart shows a number of H1 bearish candles that played out over the course of the day.

For those of you completely new to the world of trading, a timeframe simply refers to the period that a trader selects to conduct his/her trading on. IC Markets provides the following timeframes on their MT4 platform to view price action:
The 'M1', or 1 minute timeframe, is the smallest timeframe a trader can view price action here, where candlesticks come in thick and fast, printing a fresh candlestick every minute. The 'MN', or monthly timeframe, is the largest scale one can view candle action here, which provides one with a freshly-painted candle each month. Of course, as demonstrated in our very own daily technical reports, one does not need to solely rely on one timeframe. A trader has the option of adopting a multi-timeframe style, which, in our belief, helps one establish more of a concrete picture of the market as a whole.
Next, we're going to touch on a fairly simple yet very significant aspect of price action. Below is a H4 chart, meaning that each candle close on this timeframe represents 4 hours of price action.
The gold stars are used to denote 'swing lows' and the red stars are there to signify 'swing highs'. You'll often here these terms thrown around forums when discussing technical analysis. Put simply, they are the extreme points that are visible on a particular timeframe. As can be seen from the above chart, it's relatively simple to recognize them visually. However, they are, without a doubt, essential concepts one needs to grasp in order to read the charts correctly. Do yourself an enormous favour and practice observing these extreme points, as it will certainly benefit you later in your trading career.
Being able to identify swing highs and lows helps traders/investors pin down market direction. In the example above, after noting the extreme points, where would be the more likely direction price may travel to next? Our expectation would, assuming the latest swing low holds steady, be for a new swing high to form essentially setting the stage for a trend continuation.
Knowing what a timeframe is and how to read a candlestick chart, nevertheless, is not enough. There is a plethora of price action patterns that traders use to analyse the markets. In order not to overwhelm our newer traders, we've kept this article relatively simple. In part 2, we'll look to dive into more juicy aspects of price action and touch on how one could potentially use this in their trading.
How To Trade Pullbacks With 5 Key Technical Tools
Trading forex can be both interesting and rewarding if one can spend the time learning how it really works. First you have to build a base or foundation. That includes developing a strategy that works for you, finding good money management techniques and training your mind to be disciplined in all facets of trading. Remember, at the end of the day you must muster up enough courage to pull the trigger for any strategies developed to work.
What you will learn in this article is a pullback trading strategy that utilizes stochastics, simple support and resistance as well as Fibonacci retracement ratios to time trades in the direction of the primary trend. In my opinion, simple strategies work best in trading. And as simple as this strategy appears, keep in mind that no system is a bad system as long as it works and produces results for the owner. My honest advice is that you should stick to what works for you. If your strategy produces more winners (profits) than losers (losses) stick with it but re-evaluate it from time to time because market conditions might change so re-evaluations allow you to incorporate new changes in the market you trade into your strategy.
Terminology Used In This Article
Before we go into the discussion of this strategy, it is important for us to understand the key technical analysis tools we will utilize in this strategy. Don't worry if you don't fully grasp the definitions below. They will become clearer when I walk you through my strategy.
Stochastics: It is based on the rule that, within a period of strong market action, a market will tend to close towards the upper end of the range, while in downtrends, the price will close near the bottom of the range. Stochastics is made up of two lines; %K and %D that oscillate between 0 and 100. Overbought and oversold conditions are functions of this indicator, which could range between 80 on the upside and 20 on the downside. In addition, stochastics sometimes generates a divergence condition, which occurs when the indicator fails to confirm a move to a new price high or low in the price action.
Support and Resistance: Resistance is a price level above the market where supply is strong enough to overcome demand while support is a price level below the market where demand is strong enough to overcome supply. Price highs and lows as well trading ranges can exemplify support and resistance. Rectangle pattern tops and bottoms can serve as good examples of support and resistance levels.
Fibonacci Ratios: Are a sequence of numbers in which each successive number is the sum of the two previous numbers: 1, 1, 2, 3, 5, 8, 13, 21, 34, 55, 89, 144, 610, etc. Leonardo Fibonacci, an Italian born mathematician around 1170 discovered the relationship of what is now referred to as Fibonacci ratios while he was studying the Pyramid in Egypt. These numbers possess interrelationships, such as any given number is approximately 1.618 times the preceding number and any given number is approximately 0.618 times the following number. Fibonacci levels are relevant to traders because markets often bounce off key Fibonacci price levels. These levels can also act as support and resistance and can be used as projected profit targets.
Candlesticks: Are a way of displaying the relationship between opening and closing prices during a time interval.
If the close is higher than the open - the candle is white.
If the open is higher than the close - the candle is black.
Now that the meanings of our technical tools are understood, we will now move on to the fundamentals of this strategy. The parameters are set below:
1. The strategy takes a top-down approach to analyze allowing it to start from the higher time frames(weekly charts) and drill down to lower time frames(240mins charts)
2. We look for overbought and oversold readings on the stochastics indicator after a pullback in an uptrend and a rally in a downtrend.
3. We then watch price actions at our defined support and resistance levels to see if it would hold or violate these levels.
4. After establishing support & resistance, we will now plot our Fibonacci ratios to determine which Fib levels coincide with support and resistance zones, keeping an eye on the stochastic extreme readings.
5. Our focus is on signals that are going in the direction of the primary trend. We do not take trades or open positions against the primary trends, whether downtrends or up trends.
6. Lastly, we use reversal candle patterns as our entry triggers. These reversal candle patterns include hammers, bullish engulfing patterns and dojis etc.
7. Putting it all together: A close above the high of the previous days low when the stochastic indicator crosses over from the oversold zone and is above 20 (reading) coinciding with our established support & resistance/Fibonacci retracement and a reversal candlestick pattern gives us an entry.
Step One
Establishing A Trend: Establish an uptrend (downtrend) on the weekly time frame. In this case, EMAs (50,100 & 200) and trendlines are used to determine the direction of the main trend. Below is a weekly chart of EURNZD cross, which has been in an uptrend since July 2007.
Figure 1
Step Two
Monitoring Pullbacks: After determining the direction of the trend on the weekly time frame, we will drill down to the daily chart in order to establish the trend (in the direction of the weekly trend) and also monitor pullbacks to know if it meets our strategy as defined above.
As you can see below, a pullback is already in place and price has moved into our defined support zone, but we still need to drill down further to 240-minute chart to see what price action and the stochastic indicator are doing. If price is hesitating or consolidating while stochastic is oversold, we then look for a reversal candle and a bullish stochastic crossover above oversold zone (reading above 20).
Figure 2
Step Three
On the 240-minute chart, price actually stalled ahead of our defined support/fib levels from the daily chart and a few ours later closed above the previous bearish candle to form a bullish candle pattern(bullish harami pattern). Furthermore, our stochastic indicator has already turned bullish above the oversold zone on the formation of the bullish engulfing pattern giving us an entry on the formation of the next candle. Stop losses are set 10 pips below the reversal candle.
Figure 3
Conclusion
This strategy works on both downtrends and uptrends provided its defined parameters are followed. I use it as a swing trading strategy but for those interested in using it for day trading a little adjustment might be needed. Furthermore, refining your entries for low risk trades may take you below the 240mins chart, it is still all right as long as you are trading in the direction of the main trend. Depending on how you want to utilize the strategy, either as day trading or swing trading you can set your exit points based on your preferences but for me, I like using trailing stops. As stated in the beginning, simplify, simplify, simplify are the words I read every day as I begin my trading day. I love simple strategies because they work.
Will Central Bankers Follow Through On Hawkish Warnings?
- BoC and Yellen remains this week's headline events;
- Will BoE's Broadbent echo his colleagues hawkish rhetoric?
- Oil inventory data released as prices near 11-month lows.
As is likely to be the case for much of this week, central banks will be in focus again on Tuesday with two policy makers from the Bank of England and one Federal Reserve official scheduled to appear.
Wednesday remains the most notable session of the week, with Fed Chair Janet Yellen testifying before the House Financial Services Committee and the Bank of Canada potentially raising interest rates for the first time in almost seven years. A rate hike from the BoC would come as a number of the G7 central banks adopt a more hawkish stance, despite the economic data not necessarily supporting such a move.
It would appear there is a sudden coordinated desire to start moving away from the ultra-accommodative monetary policies that have been necessary over the past decade, even if the economic data doesn't necessarily warrant higher rates. The ECB is widely expected to lay out plans for ending its asset purchase program later this year, while the Fed is likely to announce plans to reduce its balance sheet in September and the BoE and BoC have, somewhat out of the blue, deciding the time to raise interest rates has arrived.
We'll have to wait 24 hours to find out what the BoC is going to do and whether more hikes are planned for the months ahead, and to hear what Yellen has to say about the path of interest rates and the balance sheet. Today though, we could get more insight from two prominent BoE policy makers and two FOMC voters, which should be of interest to traders.
The BoE's Chief Economist Andy Haldane has already recently made his feelings known, suggesting that while he never backed a hike at the last meeting, he could be persuaded to do so if the data performs as expected. Deputy Governor Ben Broadbent has been relatively quiet until now though and should he echo the views of Haldane in recent weeks, it could send a strong signal to the markets that the BoE won't be far behind the BoC, if it does in fact raise interest rates tomorrow.
The data will be less of a focal point today, although we will get JOLTS job openings for the US and oil inventory data later on in the session from API. Brent and WTI remain under pressure despite inventories having fallen consistently in recent months, with traders instead focusing on rising oil rigs in the US and higher output from Nigeria and Libya. Another large drawdown last week may provide some reprieve for oil, with it not trading far from its 11-month lows.
Rate Differentials Hinders Yen
Tuesday July 11: Five things the markets are talking about
Capital markets continue to watch for cues on monetary policy.
Questions on the U.S inflation outlook are certain to be front and center for Fed head Janet Yellen tomorrow – she is due to testify on the semi-annual Monetary Policy Report before the House Financial Services Committee.
Inflation data will in fact cap this week with Friday's consumer price report where minimal pressure is the market consensus. Also on Friday, U.S retail sales is expected to show a minimal gain once again, held down by weak auto sales.
Currently, global equities are little changed, unlike bonds, which are extending their slump triggered by more ‘hawkish' rhetoric from central banks.
Normalization of monetary policy is holding the ‘big' dollar firm and limiting its downside.
1. Stocks mixed results
Asian markets mostly climbed overnight supported by technology companies who mirrored gains in their U.S counterparts.
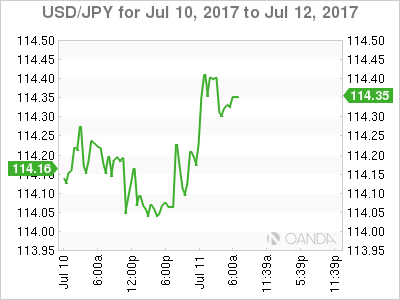
In Japan, the Nikkei stock index ended up +0.6%, buoyed by the weaker yen (¥114.32), while Australian shares erased losses and ended slightly higher.
In Hong Kong, stocks extended this week's rally, posting their best day in four months overnight, bolstered by strong gains among financial sector stocks. The Hang Seng Index rose +1.5%, while the China Enterprises Index gained +2.0%.
In China, stocks diverged, with the blue-chip index hitting a fresh 18-month high as investors favoured solid fundamentals, while small-caps extended a fall on expectations more equity issuance would soften valuations. The blue-chip CSI300 index rose +0.5%, while the Shanghai Composite Index lost -0.3%.
In Europe, stocks opened higher, but have since turned due to little major news. Crude prices are again dragging down energy stocks in the FTSE 100 as investors turn their attention to Fed Chair Yellen's comments in Congress tomorrow and upcoming U.S reported earnings.
U.S stocks are set to open little changed.
Indices: Stoxx50 flat at 3,477, FTSE -0.6% at 7,324, DAX +0.2% at 12,472, CAC-40 flat at 5,168, IBEX-35 -0.2% at 10,491, FTSE MIB +0.4% at 21,268, SMI -0.5% at 8,894, S&P futures flat
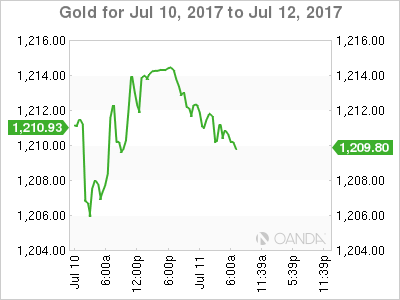
2. Oil steadies but outlook remains weak, gold lower
Oil prices have steadied overnight after almost a week of sharp falls, but the outlook remains weak amid oversupply issues.
Benchmark Brent crude is down -10c at +$46.78 a barrel, while U.S light crude is -5c lower at +$44.35.
Signs of strong short-term demand are capping losses for now – gas demand tends to increase in the northern hemisphere in the summer as U.S drivers take to the road.
Fundamental and technical dynamics for crude have not changed; the world is awash with crude supply.
Note: Brent prices are -17% below their 2017 opening despite a deal OPEC to cut production from January.
On Friday Baker Hughes data showed that U.S energy firms added +7 oil drilling rigs last week, marking a 24th week of increases out of the last 25 and bringing the total count up to +763, the most since April 2015.
Note: U.S oil production has risen over +10% since mid-2016 to +9.34m bpd.
Gold prices (-0.3% to +$1,210.88 an ounce) have edged lower on a firmer dollar after touching near four-month lows in the previous session as the market waits for cues from the central bank on the path of U.S. interest rate hikes.
3. Bonds market selloff resumes, yields approaching last weeks high
San Francisco Federal Reserve President John Williams said overnight in Sydney that “it was a reasonable view to expect one more rate hike this year, and his own view was to start adjusting the central bank's balance sheet in the next few months.”
Yields on 10-year Treasury's have backed up +2 bps to +2.392%, while German bund yields climbed to +0.559% from +0.539%.
Investors should expect further pressure on yields as the U.S Treasury this week will auction a combined +$56B in notes and bonds.
Note: +$24B in three-year notes will be auctioned today, while +$20B in reopened 10-year notes on Wednesday, and +$12B in opened 30-year bonds on Thursday.
Elsewhere, Japan's Ministry of Finance confirmed that Japanese investors have returned to owning French government bonds (OAT's) after Macron's election win.
4. Dollar makes new highs against yen
Rate differentials are hurting JPY (¥114.27). The yen remains under pressure as Japanese monetary policy looks set to remain ultra loose, while the Fed is raising interest rates and other central banks, including in the eurozone, U.K, Canada and Scandinavia, switch their bias toward tightening policy.
The market believes that the Bank of Japan (BoJ) would be the only G-10 central bank not starting a rate normalization process at the latest by next year.
Elsewhere, sterling (£1.2916) is rallying before a speech by Bank of England policymaker Ben Broadbent (07:00 am EST) – anymore rate rise hints is expected to lift the pound further. GBP/USD is up +0.2%, while EUR/GBP is down -0.2% at €0.8833.
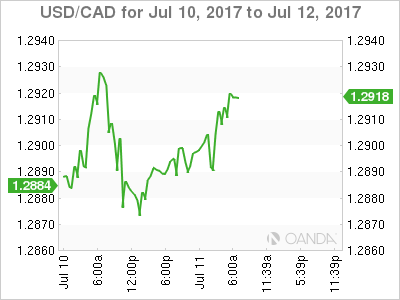
For the loonie (C$1.2909), the market seems somewhat divided on whether the Bank of Canada (BoC) will raise rates tomorrow (10:00 am EST), but data from the overnight index swaps market shows that money markets are almost fully priced for a +25 bps increase, while an +80% chance of a second hike has been implied by December.
5. U.S small-business confidence dragged by senate gridlock
Data this morning stateside showed that small-business owners' confidence about their economic situation declined last month as the U.S Senate remains in gridlock over the health-care reform bill.
The National Federation of Independent Business's (NFIB) small-business optimism index fell to 103.6 from May's reading of 104.5.
Note: The index rose sharply after the 2016 presidential election and reached a peak of 105.9 in January.
The result sunk well below market expectations of 104.5.
GOLD Targeting Support At 1195, SILVER Strong Bearish Momentum, CRUDE OIL Short-Term Selling Pressures Are Fading.
GOLD Targeting support at 1195.
Gold's is trading lower towards strong support given at 1214 (09/05/2017 low). Hourly resistance can be found at 1258 (23/06/2017 high). Expected to show continued weakness.
In the long-term, the technical structure suggests that there is a growing upside momentum. A break of 1392 (17/03/2014) is necessary ton confirm it, A major support can be found at 1045 (05/02/2010 low).
SILVER Strong bearish momentum.
Silver has broken support at 15.63 (27/12/2016 low). Key resistance is given at a distance at 17.75 (06/06/2017 high). The road seems wide open for further decline.
In the long-term, the death cross indicates that further downsides are very likely. Resistance is located at 25.11 (28/08/2013 high). Strong support can be found at 11.75 (20/04/2009).
CRUDE OIL Short-term selling pressures are fading.
Crude oil is consolidating above $44. Support is given at 42.05 (21/06/2017 low). Expected to show short-term bullish improvement.
In the long-term, crude oil has recovered after its sharp decline last year. However, we consider that further weakness are very likely. Strong support lies at 35.24 (05/04/2016) while resistance can now be found at 55.24 (03/01/2017 high).
EUR/JPY Continued Increase, EUR/GBP Failed To Break Resistance Area Around 0.8900, EUR/CHF Breaking 1.10 For The First Time In...
EUR/JPY Continued increase.
EUR/JPY is back above 130 for the first time in a year and half. Hourly support can be found at 127.10 (30/06/2017). Next support is given at 122.56 (18/05/2017 low). Further upside is favored.
In the longer term, the technical structure validates a medium-term succession of lower highs and lower lows. As a result, the resistance at 149.78 (08/12/2014 high) has likely marked the end of the rise that started in July 2012. Strong support at 94.12 (24/07/2012 low) looks nonetheless far away.

EUR/GBP Failed to break resistance area around 0.8900.
EUR/GBP is testing for the third time in two months resistance area around 0.8900. Hourly support is given at 0.8719 (16/06/2017 low). Expected to show further buying pressures.
In the long-term, the pair has largely recovered from recent lows in 2015. The technical structure suggests a growing upside momentum. The pair is trading above from its 200 DMA. Strong resistance can be found at 0.9500 psychological level.
EUR/CHF Breaking 1.10 for the first time in a year.
EUR/CHF has broken psychological level at 1.1000. Selling pressures will definitely be important at this point. Hourly support is located at a distance at 1.0922 (30/06/2017 low). Expected to inch higher.
In the longer term, the technical structure is mixed. Resistance can be found at 1.1200 (04/02/2015 high). Yet,the ECB's QE programme is likely to cause persistent selling pressures on the euro, which should weigh on EUR/CHF. Supports can be found at 1.0184 (28/01/2015 low) and 1.0082 (27/01/2015 low).
USD/CHF Short-Term Bullish, USD/CAD Consolidating Above 1.2900, AUD/USD Strengthening.
USD/CHF Short-term bullish.
USD/CHF is pushing higher. Hourly resistance can be found at 0.9771 (09/06/2017 high). Strong resistance is given at 1.0107 (10/04/2017 high). Hourly support is given at 0.9553 (30/06/2017 low).
In the long-term, the pair is still trading in range since 2011 despite some turmoil when the SNB unpegged the CHF. Key support can be found 0.8986 (30/01/2015 low). The technical structure favours nonetheless a long term bullish bias since the unpeg in January 2015.
USD/CAD Consolidating above 1.2900.
USD/CAD's bearish momentum continues. Support given at 1.2913 (04/07/2017 low) has been broken. Resistance is located at 1.3014 (02/15/2017). Expected to show renewed bearish pressures.
In the longer term, the pair lies in a bullish channel since a year. Strong resistance is given at 1.4690 (22/01/2016 high). Long-term support can be found at 1.2461 (16/03/2015 low).
AUD/USD Strengthening.
AUD/USD's technical structure is bullish since early May despite some consolidation move. The pair should further head back towards resistance at 0.7712 (30/06/2017 high). However, a break of support at 0.7520 (09/06/2017 low) would nonetheless indicate a renewed bearish trend.
In the long-term, we are waiting for further signs that the current downtrend is ending. Key supports stand at 0.6009 (31/10/2008 low) . A break of the key resistance at 0.8295 (15/01/2015 high) is needed to invalidate our long-term bearish view.
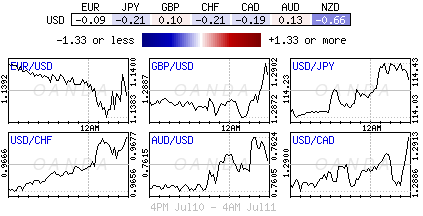
EUR/USD Weakening, GBP/USD Bouncing Higher Within Symmetrical Triangle, USD/JPY Breaking Resistance At 114.37.
EUR/USD Weakening.
EUR/USD bearish pressures are weak and the pair should head back toward resistance at 1.1445 (29/06/2017 high). Hourly support can be found at 1.1292 (28/06/2017 low). Stronger support lies at 1.1076 (18/05/2017 low).
In the longer term, the momentum is clearly negative. We favour a continued bearish bias towards parity. Key resistance holds at 1.1714 (24/08/2015 high) while strong support lies at 1.0341 (03/01/2017 low).
GBP/USD Bouncing higher within symmetrical triangle.
GBP/USD is still trading higher. The pair failed to monitor resistance given at 1.3046 (18/05/2017 high). The road is wide-open for further weakness.
The long-term technical pattern is even more negative since the Brexit vote has paved the way for further decline. Long-term support given at 1.0520 (01/03/85) represents a decent target. Long-term resistance is given at 1.5018 (24/06/2015) and would indicate a long-term reversal in the negative trend. Yet, it is very unlikely at the moment.
USD/JPY Breaking resistance at 114.37.
USD/JPY is still riding within symmetrical triangle towards resistance given at 114.37 (10/05/2017 high). Hourly support can be found at 112.83 (05/07/2017 low). Stronger support is located at 108.13 (17/04/2017 low). Expected to show continued bullish pressures.
We favor a long-term bearish bias. Support is now given at 96.57 (10/08/2013 low). A gradual rise towards the major resistance at 135.15 (01/02/2002 high) seems absolutely unlikely. Expected to decline further support at 93.79 (13/06/2013 low).
Euro Expected To Rise Even More Against The Swiss Franc
Euro expected to rise even more against the Swiss Franc
EUR/CHF finally managed to break somehow the 1.10 resistance to the upside yesterday. However further gains are needed to clear the way towards 1.11. The general environment for EUR/CHF has improved substantially since the French Presidential election and the many setbacks faced by populist movements across EU members overall, allowing to reduce buying pressure on the Swiss franc. This also helped return confidence to investors and translated into a yield rally that allowed German 10-year to climb back into positive territory.
Nevertheless, the prospect of the ECB reducing its Quantitative Easing program was the most significant driver recently. It gave a fresh boost to European yields and fuelled the EUR/CHF rally as investors moved to higher-yielding currencies. However, the excess cautiousness of the ECB together will faltering inflation pressures will keep investors in their toes until the next ECB meeting on July 20.
We remain constructive on EUR/CHF and believe there is room for further appreciation of the pair. However, investors should remain cautious and especially not create unrealistic expectations about an abrupt unwinding of the ECB’s monetary policy. Mario Draghi will take it slow, as usual.
Yen will keep falling, as Bank of Japan defies other central banks on rate hikes
The Bank of Japan looks likely be the only major central bank that will not to raise its interest rates this year. This is one great reason why investors are staying away from the JPY.
The yen keeps just keeps on falling. The USD is now at around 114 JPY, the yen’s weakest since mid-May, compared to levels of around 100 JPY in September of 2016. JPY’s movements against the EUR have been similar. JPY’s decline is driven be monetary tightening from other central banks: first the US Federal Reserve, then the ECB, with similar moves expected from the Bank of England, Bank of Canada, Norway’s Norges Bank and Sweden Riksbank.
Meanwhile, nothing has changed in BoJ’s monetary policy. The Japanese institution is still set to purchase an unlimited amount of bonds at a defined yield.