Sample Category Title
EUR/USD Bearish Consolidation Below Resistance At 1.3000, GBP/USD Holding Below 1.3000, USD/JPY Renewed Growing Pressures.
EUR/USD Bearish consolidation below resistance at 1.3000.
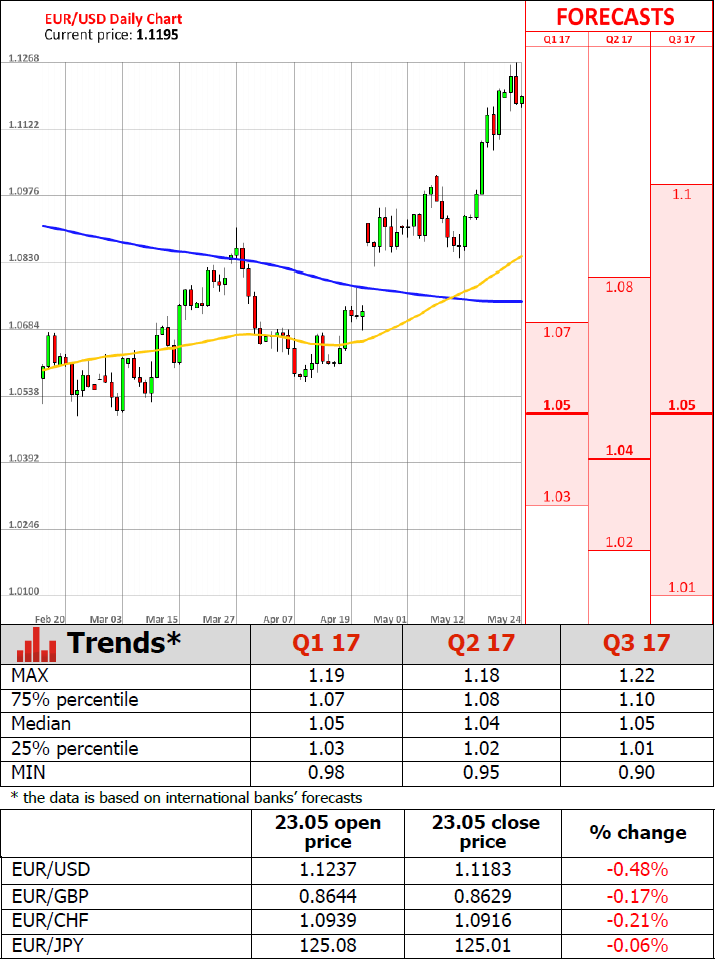
EUR/USD is trading higher towards strong resistance at 1.1300 (09/11/2017 high). Hourly support can be found at 1.0842 (11/05/2017 low). Strong support is now given at 1.0682 (21/04/2017 base) and key support can be found at 1.0494 (22/02/2017 low). Expected to continue growing higher.
In the longer term, the death cross late October indicated a further bearish bias. The pair has broken key support given at 1.0458 (16/03/2015 low). Key resistance holds at 1.1714 (24/08/2015 high). Expected to head towards parity.
GBP/USD Holding below 1.3000.
GBP/USD is trading sideways. Hourly resistance is given at 1.3048 (18/05/2017 high). Hourly support are given at 1.2831 (04/05/2017 low) and1.2757 (21/04/2017 low). An unlikely break of this last support would indicate further weakness. Expected to push higher.
The long-term technical pattern is even more negative since the Brexit vote has paved the way for further decline. Long-term support given at 1.0520 (01/03/85) represents a decent target. Long-term resistance is given at 1.5018 (24/06/2015) and would indicate a long-term reversal in the negative trend. Yet, it is very unlikely at the moment.
USD/JPY Renewed growing pressures.
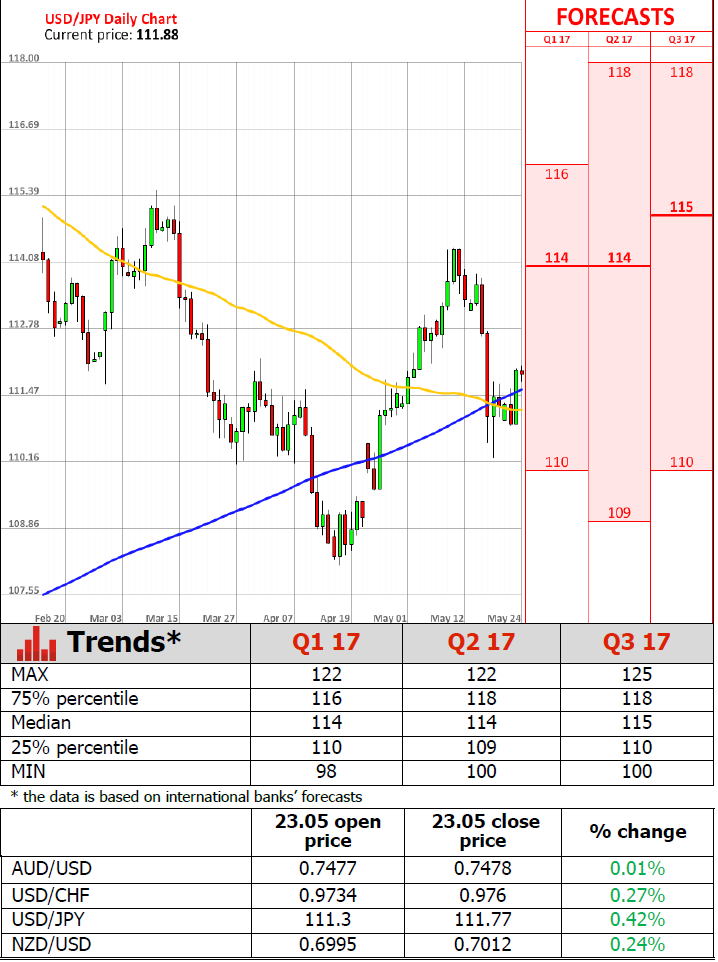
USD/JPY has exited the symmetrical triangle and keeps pushing lower despite ongoing bullish consolidation. Hourly support is given at 110.24 (18/05/2017 low). Stronger support is located at 108.13 (17/04/2017 low). Other key supports lie at a distant 106.04 (11/11/2016 low). The road is now wide-open for further decline.
We favor a long-term bearish bias. Support is now given at 96.57 (10/08/2013 low). A gradual rise towards the major resistance at 135.15 (01/02/2002 high) seems absolutely unlikely. Expected to decline further support at 93.79 (13/06/2013 low).
Technical Outlook: Oil Continues To Trend Higher On Expectations Of Positive OPEC Meeting Outcome
US oil remains steady on Wednesday and continues to trend higher, approaching round-figure barrier at $52.00. Bull-leg from $48.02 (17 May trough) extends into sixth straight day of gains, as bullish technicals and strong expectations that OPEC will verify agreed extension of production cut for another nine months, keep the price well supported. OPEC and other major oil producing countries will meet on Thursday in Vienna to make a final decision whether to extend their current output cut program which end at the end of June. Positive decision from oil producers would give an additional boost to oil prices for possible extension towards $53.74 (12 Apr high). Tuesday's break and close above pivots at $51.10/38 (100SMA/Fibo 76.4% of $53.74/$43.74) generated bullish signals, with former barriers now acting as supports. Strongly overbought slow stochastic on daily chart warns of correction in the near –term, but no firmer bearish signals being generated so far.
Res: 52.00, 52.62, 53.18, 53.37
Sup: 51.38, 21.10, 50.56, 50.00
Technical Outlook: AUDUSD Falls On China Downgrade/Weak Data, But Dips Were So Far Contained
The Aussie dollar slipped to 0.7442 low in Asia, extending pullback from Tuesday's spike high at 0.7517, where gains were capped by weekly cloud top, reinforced by falling weekly Tenkan-sen.
Fresh weakness came after Moody's cut China's sovereign rating and weaker than expected Australian data overnight (Construction work done fell by 0.7% in Q1, beating -0.2% forecast).
The pair managed to recover the largest part of overnight's losses in late Asian/early Europe trading, however, risk of fresh weakness remains in play after Tuesday's trading ended in Doji candle with very long upper shadow that could be seen as initial signal of recovery stall. Session low/daily Tenkan-sen/Fibo 38.2% of 0.7328/0.7517 mark first pivot at 0.7442, followed by converged 10/20SMA at 0.7432, break of which would generate stronger bearish signal and expose supports at 0.7400 (round-figure/Fibo 61.8%) and 0.7388 (17 May low).
Release of US data today may give fresh direction signals.
Res: 0.7482, 0.7500, 0.7517, 0.7534
Sup: 0.7456, 0.7442, 0.7432, 0.7400
FOMC Minutes In Focus, BoC To Stay On Hold
BoC to stay on hold, USD/CAD subject to downside pressure
The Bank of Canada (BoC) is broadly expected to leave its benchmark rate unchanged at 0.50% today. The central bank will go on with its neutral approach as Governor Poloz does not want to derail the ongoing recovery. Despite a setback in the first quarter, inflation has been slowly moving toward the centre of the target band. On the growth side, the Canadian economy has been able to maintain a positive momentum and grew 2.5% y/y in February.
Besides the highly uncertain oil prices path, the President Trump threat remains one of the main concerns. After introducing tariffs on timber imports from Canada, a re-negotiation of NAFTA will be another painful shock for the economy. Therefore, we anticipate that the BoC will mainly stress the uncertainties surrounding the inflationary outlook and the threat of a tighter trade relationship with the US.
USD/CAD's reaction should remain limited. The currency pair is currently erasing early morning gains and returned to 1.3510. We remain bullish on the pair as we expect market participants will slowly start to switch attention towards the Fed's tightening path and reload bullish bets on the greenback.
China's ratings cut
As expected, Moody's has downgraded China's sovereign credit rating to A1 from Aa3 with revised outlook stable. According to Moody's, the cut was due to growing leverage and the fact indirect liabilities will be pressured as economic growth decelerates. However, the upgrade to a stable outlook indicates that at A1, the risks are balanced.
China's Ministry of Finance was quick to reject Moody's assessment on the grounds that local government and SOE debt should not be considered obligations of the federal government. Markets will be watching the S&P rating for a probable reaction as China still has an AA- credit rating and negative watch. While the credit rating cuts failed to hurt China's stock markets, AUD headed lower following industrial commodities weakness and risk in China.
In our view the probability of a full blown collapse is low considering their ability to control capital flows. However, today's rating move is another warning shot from the markets that pace of credit growth and sustainably of debt is worrying. It is uncertain whether China authorities have the nerve to tighten further at the risk of damaging already weak economic growth.
Oil upside limited
OPEC's meeting tomorrow is expected to see a 9-month extension to the production cut agreement. We suspect that much of the production cuts are already priced in as WTI climbed from $44 to $51.60 since 5th May. Clearly a no-extension result would deliver an asymmetrical negative reaction, while an unexpected deeper cut would send oil higher.
With expectations elevated and further crude price gains unlikely, watch for oil sensitive currencies RUB, CAD and NOK to fall back. In addition, the US budget proposed to sell 270 million barrels of oil from the Strategic Petroleum Reserves over the next 10 years. Traders will be watching US crude inventories today. Given our negative oil outlook (past production cuts deals have only had a transitory positive effect on prices) and a more optimistic view on EU inflation, we would trade long EURNOK.
Markets expect upbeat FOMC meeting minutes
Today will be released the FOMC meeting minutes. Traders will monitor carefully any further hint about the Fed rate path until the end of the year. For the time being, markets are expecting an optimistic tome from May's FOMC policy meeting.
Next US central bank's meeting will be held the 14th of June. A rate hike probability is around 88.8% according to the OIS (Overnight Index Swap). It may be surprising that markets are overly optimistic despite last week's strong arising political uncertainties and the Trump issue with the FBI.
Markets seem clearly skewed towards a rate hike, by moving (slightly) away this week from gold which prices have been declining since the start of the week losing -0.5% in the last 3 days. The US 2-year government bond rose to 1.32 Treasury yield and the US dollar is getting stronger.
Anyway, Fed's Bullard – President of the St Louis Federal Reserve – is concerned by the weak March data and believes that the Fed rate path for this year is maybe too aggressive. When looking at the US Equity Markets, we may believe that the era of low interest rates is far from over. The S&P 500 is back around 2'400 points. We reload very short-term dollar position, the time that the EURUSD to head back towards 1.10.
Is The Bank Of Canada Going To Shift To A Dovish Bias?
Today, all eyes will be on the Bank of Canada rate decision. The forecast is for the Bank to remain on hold once again. Policymakers maintained a neutral to dovish tone the last time they met, balancing every upbeat comment about the economy with a worried follow-up remark. The key message we got was that economic data are improving, but the Bank thinks it is too soon to materially alter its concerned stance, mainly due to uncertainties related to the outlook for trade.
Indeed, BoC policymakers now probably feel vindicated about their cautious view, considering that shortly after that policy meeting, the US imposed tariffs on Canada. Given also that some recent economic data have been soft, with the core CPI rate falling further in April and February's GDP stagnating, we consider it likely that the BoC will maintain, if not amplify further, its concerned message. Something like that could reverse some of CAD's recent gains. However, we should note that the currency's forthcoming direction may be decided to a large extent by the outcome of the OPEC & non-OPEC meeting tomorrow as well, considering Canada's heavy reliance on oil exports.
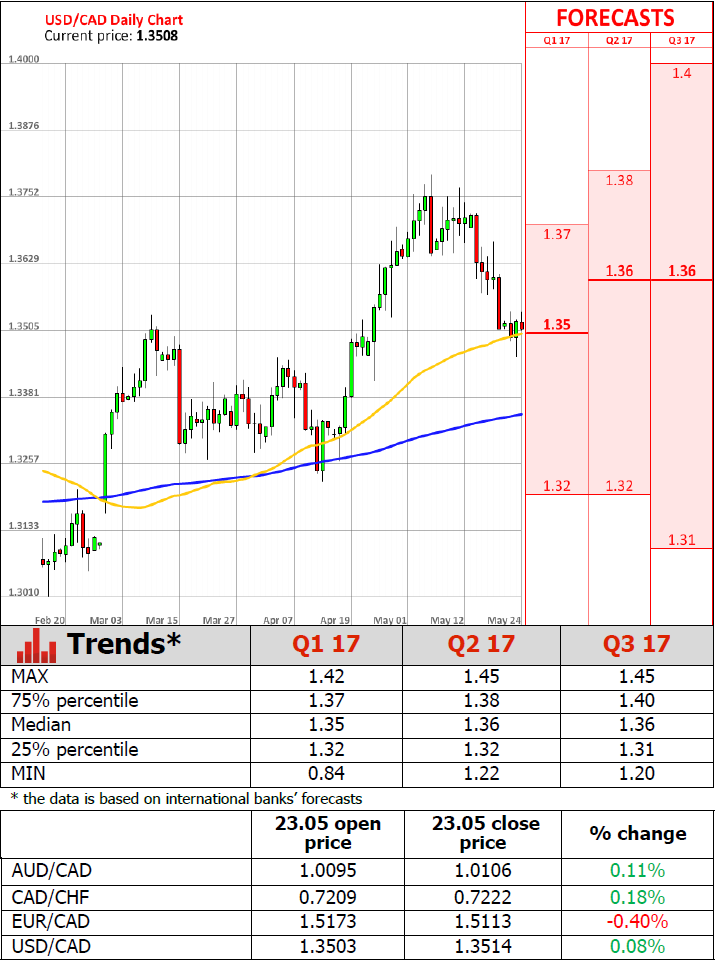
USD/CAD traded somewhat lower yesterday during the European morning, but the decline was halted near the 1.3460 (S2) support level and the rate then rebounded to break above the resistance (now turned into support) barrier of 1.3510 (S1). In case of a worried tone today by the BoC, the current rebound could continue and aim for the 1.3570 (R1) resistance territory. If the bulls manage to overcome that level, they could initially aim for the key hurdle of 1.3600 (R2).
FOMC minutes: Is a June rate hike on the cards?
In the US, the Fed will release the minutes from its May policy meeting, where the Committee kept its policy unchanged and offered very few hints regarding the timing of the next rate hike. The most noteworthy point in the statement was that policymakers view the slowdown in Q1 GDP as transitory, implying this softness will not deter them from hiking rates again in the near-term should growth rebound in Q2. Besides that point, the statement was more or less a reiteration of the previous one and as such, we expect investors to scan the minutes for any clear clues as to whether the next hike is likely to come as early as June.
At the time of writing, the probability for a June hike rests at 83%. If the minutes confirm the Bank is likely to act again as early as June, that probability could rise further and the dollar may gain somewhat. Having said that though, given the elevated expectations for a June action, any signs in the minutes that the Fed may not act as the market currently expects could generate a notable negative reaction in USD, in our view.
USD/JPY traded higher yesterday, breaking above the resistance (now turned into support) barrier of 111.50 (S1). Should the FOMC minutes confirm the Bank is likely to raise rates again in June, we could see the rate move higher and challenge the 112.35 (R1) resistance zone. On the other hand, any cautious signals indicating that a June action is not as likely as market pricing suggests could cause the bears to retake control and push the battle notably lower. A decisive break below the 111.50 (S1) support could initially aim for 111.00 (S2).
As for the rest of today's highlights:
During the European morning, the economic calendar is relatively light. The only noteworthy indicator we get is Norway's oil investment survey for Q2, though no forecast is available.
As for the US economic indicators, we get existing home sales for April.
We have two speakers on the agenda: ECB President Mario Draghi and ECB Executive Board Member Peter Praet. We think that market participants are likely to focus primarily on Draghi's comments, amid heightened speculation regarding the prospect of a more optimistic tone by the ECB at one of its upcoming meetings.
USD/CAD
Support: 1.3510 (S1), 1.3460 (S2), 1.3410 (S3)
Resistance: 1.3570 (R1), 1.3600 (R2), 1.3640 (R3)
USD/JPY
Support: 111.50 (S1), 111.00 (S2), 110.50 (S3)
Resistance: 112.35 (R1), 113.10 (R2), 113.80 (R3)
German Investor Morale Improves More Than Expected In May
'Today's strong German data add to the evidence that, not only the German economy, but the entire euro zone economy could become the positive growth surprise of 2017.' - Carsten Brzeski, ING
The mood of German investors improved markedly in May, official data showed on Tuesday. The Munich-based Ifo Institute for Economic Research reported that its Business Climate Index climbed to 114.6 points in the reported month, following April's 113.0 and surpassing analysts' expectations for an increase to 113.1. That marked the strongest reading since 1991. May's jump was mainly driven by Emmanuel Macron's victory in the French 2017 Presidential Election, which boosted confidence across the Euro zone. Taking into account the stronger-than-expected Ifo Index and other quite optimistic economic data, the German economy is set to hit a 0.6% growth rate in the second quarter. The Ifo Institute's economist Klaus Wohlrabe noted that Brexit and the US President Donald Trump's policies had not had an impact on the German economy yet. The largest sentiment improvement was seen in the manufacturing sector. Strong economic growth is expected to provide a significant support to the Chancellor Angela Merkel's Party ahead of the September General Election.
Canadian Wholesale Sales Rebound But Less Than Expected In March
'We still have ground to recover. I think there's more room to grow before we're going to peak out.' - Todd Hirsch, ATB Financial
Canadian wholesale sales rose less than expected in the third month of the year, data revealed on Tuesday. Statistics Canada reported that the value of Canadian wholesale trade climbed 0.9% in March, surpassing the C$60B mark for the first time, up from the preceding month's upwardly revised gain of just 0.3%. Nevertheless, March's figure missed analysts' expectations, as they anticipated an increase of 1.1% during the reported month. In volume terms, sales were up 0.6% in March. Gains were registered in four out of seven subsectors, representing 60% of the wholesale trade total. Sales of building materials and supplies surged 3.9%, boosted by higher demand for lumber, millwork and hardware as well as metal services. In the meantime, sales of beverages and tobacco increased 1.1% between February and March. However, two biggest subsectors posted unexpected drops. Sales of machinery and supplies fell 0.5%, whereas sales of motor vehicles and parts plunged 0.2% in March. Overall, wholesale sales were up 3.6% year-over-year in the Q2, the biggest quarterly gain since the second quarter of 2008.
US New Home Sales Drop 11.4% In April
'Demand for housing remains strong and the usual list of support factors hasn't changed, with the key items being job growth and wage gains.' - Jennifer Lee, BMO Capital Markets
New home sales in the United States dropped more than expected last month, probably amid weaker demand. The Department of Commerce reported on Tuesday that sales of new houses dropped 11.4% to a seasonally adjusted annualised pace of 569K units in April, following the prior month's upwardly revised pace of 642K units, the highest since October 2007, and falling behind expectations for a decrease to a 611K-unit pace. On an annual basis, new home sales were up 0.5% in April. The average selling price dropped to $309.2K in April from $318.7K seen in the preceding month. Despite April's unexpected drop, analysts suggested that the housing market maintained its momentum and would continue growing in the upcoming months, supported by low mortgage rates. New home sales plunged in all four regions; however, the largest drop of 26.3% was registered in the West. The inventory level rose 1.5% to 268K units last month, the highest since July 2009. AT the past month's sales pace it would likely take 5.7 months to sell all houses available on the market.
EUR/USD Analysis: Retreats Below Significant Resistance
'The euro's 7 percent gain this year means it's the best-performing currency against the dollar among the Group of 10 industrialized nations. History suggests its advance may carry on.' – Mark Gilbert, Bloomberg
Pair's Outlook
After a retreat back below the 1.12 mark during the second half of Tuesday's trading session the EUR/USD currency exchange rate has retreated below a significant resistance. On Wednesday early morning the pair was flat below the combined resistance of the monthly R2 at 1.1187 and the 61.80% Fibonacci retracement level at the 1.1190 mark. As the pair remains flat, it can be clear that clues are being expected to reveal the future short term direction. Two possibilities exist. In the case of a breaking of the resistance, the 1.13 mark will be in reach. On the other hand a decline to the weekly PP at 1.1114 might occur.
Traders' Sentiment
SWFX traders are clearly bearish in regard to the pair, as 59% of open positions are short, and 53% of trader set up orders are to sell.
GBP/USD Analysis: Another Drop Expected
'There is still scope for further upside in the near term. The long-term downtrend currently stands at approximately 1.35 and it is still possible that we could see that tested before the dollar begins to reassert itself.' – Charles Stanley (based on PoundSterlingLive)
Pair's Outlook
The GBP/USD currency pair weakened on Tuesday, resulting in the consolidation trend's preservation. Consequently, the British Pound should edge lower for another day, with the 1.29 major level likely to be the bottom, despite the 20-day SMA and the weekly S1 forming support around 1.2930. On a slightly larger scale the given pair should be unable to drop under 1.2830, where the consolidation trend's lower border, the lower Bollinger band, the weekly S2 and the wedge's support line all form a strong demand cluster. This point is also likely to be able to shift polarity and spark sufficient GBP-buying for a solid surge above 1.30, eventually.
Traders' Sentiment
Traders retain a neutral outlook towards the Sterling, with 52% of all open positions being short. Still 56% of all orders are to buy the Pound.