Sample Category Title
Trade Idea: AUD/USD – Hold short entered at 0.7605
AUD/USD – 0.7525
Recent wave: Wave 5 ended at 1.1081 and major correction has commenced for fall to 0.7000 and then towards 0.6500-10
Trend: Near term up
Original strategy :
Sold at 0.7605, Target: 0.7450, Stop: 0.7585
Position: - Short at 0.7605
Target: - 0.7450
Stop: - 0.7585
New strategy :
Hold short entered at 0.7605, Target: 0.7450, Stop: 0.7585
Position: - Short at 0.7605
Target: - 0.7450
Stop:- 0.7585
Although aussie has recovered after falling yo 0.7491 yesterday and minor consolidation above this level would be seen, reckon upside would be limited to previous support at 0.7543 and bring another decline, below said support would extend recent decline from 0.7741 top for retracement of early upmove to 0.7449 support but reckon downside would be limited and reckon 0.7400-10 would hold from here.
In view of this, we are holding on to our short position entered at 0.7605. Only above indicated resistance at 0.7633 would abort and risk a stronger rebound to 0.7665-70, above there would signal low is formed instead and suggest the retreat from 0.7741 has ended, bring a stronger rebound to 0.7700 but price should falter well below said resistance at 0.7741, bring another decline.
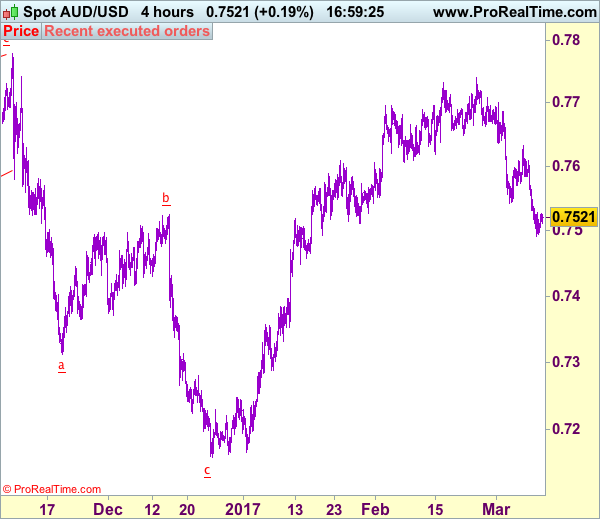
On the 4-hour chart, the move from 0.8066 is the wave 5 with i: 0.8860, ii: 0.8315, wave iii is an extended move ended at 1.0183, iv: 0.9706 and wave v has ended at 1.1081 (also the top of entire wave 5). The subsequent selloff is the major correction which is unfolding as ABC-X-ABC and 2nd A leg has ended at 0.8848, followed by a-b-c wave B which ended at 0.9758, hence, 2nd C wave is now in progress and indicated downside target at 0.7000 and 0.6950 had been met, so further fall to 0.6710-20 cannot be ruled out.
Forex Technical Analysis
EUR/USD
Current level - 10589
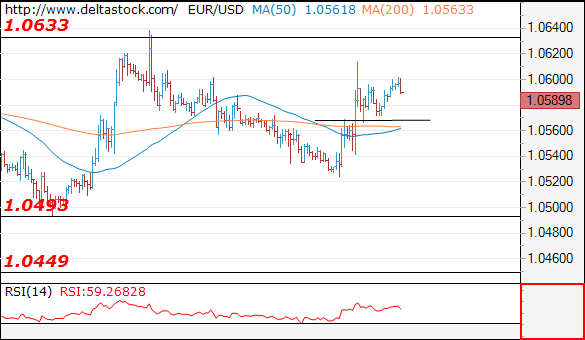
Yesterday's reversal at 1.0523 has put and end to the whole slide from 1.0638 high and the intraday bias is positive above 1.0565, with a risk of another upswing towards 1.0640 area. On the senior frames I favor a downtrend to emerge, towards 1.0450 zone.
| Resistance | Support | ||
| intraday | intraweek | intraday | intraweek |
|
1.0638 |
1.0705 |
1.0565 |
1.0450 |
|
1.0680 |
1.0870 |
1.0490 |
1.0350 |
USD/JPY
Current level - 115.41
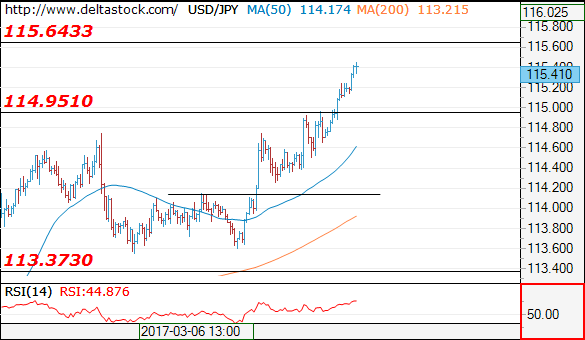
The pair is approaching 115.65 resistance area and my outlook is already counter-trend, for a reversal and slide towards 114.10 support.
| Resistance | Support | ||
| intraday | intraweek | intraday | intraweek |
|
115.65 |
118.65 |
114.95 |
114.10 |
|
116.90 |
120.00 |
114.10 |
113.37 |
GBP/USD
Current level - 1.2156
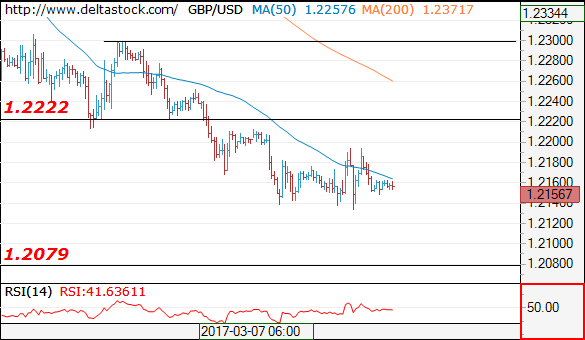
The bias remains negative below 1.2220 crucial area, for a slide towards 1.2080 zone.
| Resistance | Support | ||
| intraday | intraweek | intraday | intraweek |
|
1.2220 |
1.2570 |
1.2115 |
1.2080 |
|
1.2300 |
1.2705 |
1.2080 |
1.1984 |
EUR/JPY Candlesticks and Ichimoku Analysis
Weekly
- Last Candlesticks pattern: Hammer
- Time of formation: 19 Sep 2016
- Trend bias: Down
Daily
- Last Candlesticks pattern: Hammer
- Time of formation: 9 Nov 2016
- Trend bias: Near term up
EUR/JPY – 121.60
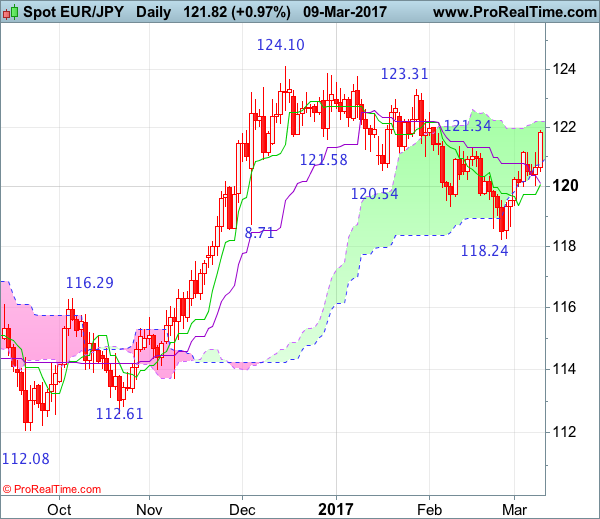
The single currency found renewed buying interest at 120.02 earlier this week and has rallied again, the breach of previous resistance at 121.35 confirms the rise from 118.24 low is still in progress and may extend further gain to 122.00 and then 122.50-55 but price should falter well below resistance at 123.31, bring retreat later. Looking ahead, only a daily close above resistance at 123.31 would signal the entire fall from 124.10 top has ended at 118.24 back in Feb and bring further subsequent rise towards this level which is likely to hold on first testing.
On the downside, whilst initial pullback to 121.00 cannot be ruled out, reckon 120.50 would limit downside and bring another upmove later. Only a daily close below said support at 120.02 would abort and suggest a temporary top is formed instead, risk weakness to 119.50-60 and possibly 119.00, however, still reckon 118.80 would limit downside and price should stay well above said support at 118.24, bring another rebound later.
Recommendation: Buy at 120.80 for 122.80 with stop below 119.80.
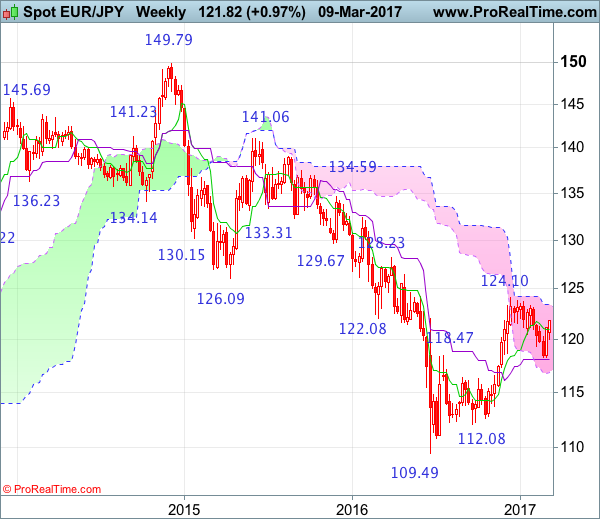
On the weekly chart, the single currency has edged higher again after forming a long white candlestick last week, adding credence to our view that low has been formed at 118.24 and consolidation with upside bias remains for further gain to indicated level at 122.52 but break there is needed to retain bullishness, bring test of key resistance at 123.31. Looking ahead, only above this level would signal recent rise from 109.49 low has resumed for retracement of early decline to 125.25-30 (50% Fibonacci retracement of 141.06-109.49), having said that, reckon resistance at 126.47 would cap upside and price should falter below resistance at 128.23, bring retreat later.
On the downside, expect pullback to be limited to the Tenkan-Sen (now at 120.99) and support at 120.02 (this week’s low) should hold, bring another rise to aforesaid upside targets. Below 120.02 would risk weakness to 119.30-35 but only a drop below 118.80 would suggest the rebound from 118.24 has ended, bring retest of this level, a break there would signal the retreat from 124.10 top is still in progress and near term downside bias remains for this move to bring retracement of recent upmove, hence weakness towards the Kijun-Sen (now at 118.09), however, a weekly close below there is needed to signal the rise from 109.49 has ended, bring further decline to 117.30-35 but previous resistance at 116.29 should contain downside due to near term oversold condition, bring rebound later.
Daily Technical Analysis
EURUSD
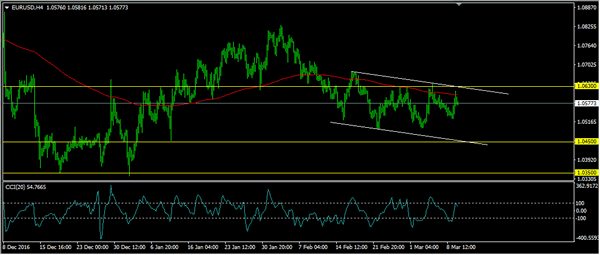
The EURUSD attempted to push higher yesterday topped at 1.0615 but closed lower at 1.0576. The bias remains neutral in nearest term. Immediate resistance is seen around 1.0630 and the upper line of the bearish channel (see my H4 chart below) which is a good place to sell with a tight stop loss as a clear break above the bearish channel would expose 1.0700 – 1.0750 area. On the downside, 1.0500 – 1.0450 remains a key support and good place to buy with a tight stop loss. Fundamental focus will be on the US NFP number. Overall I remain neutral.
GBPUSD
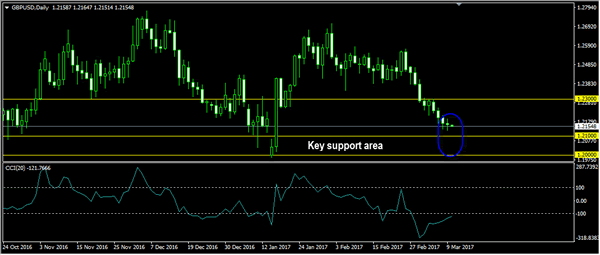
The GBPUSD was indecisive yesterday but overall still able to maintain its bearish bias so far. The bias remains bearish in nearest term testing 1.2100 – 1.2000 region, which is a key support area and good place to buy with a tight stop loss below 1.2000 psychological support. Immediate resistance is seen around 1.2200. A clear break above that area could lead price to neutral zone in nearest term testing 1.2250 – 1.2300 region. Fundamental focus will be on the US NFP number. Overall I remain neutral.
USDJPY
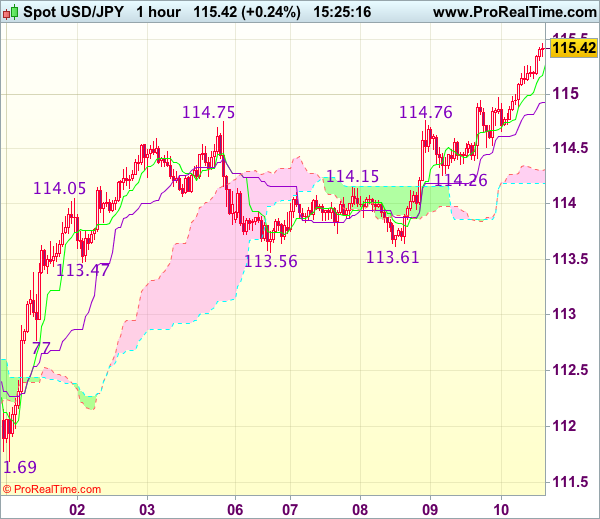
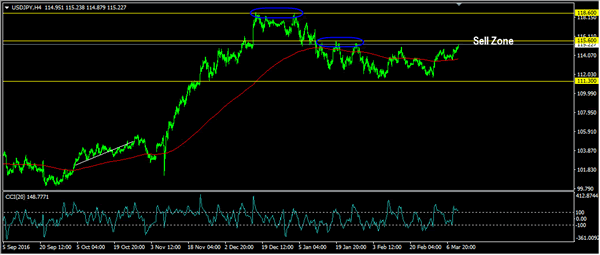
The USDJPY continued its bullish momentum yesterday topped at 115.00 and hit 115.25 earlier today. The bias remains bullish in nearest term testing 115.60 key resistance which is a good place to sell with a tight stop loss as a clear break above that area would expose 116.50 or higher. Immediate support is seen around 114.75. A clear break below that area could lead price to neutral zone in nearest term testing 114.25/00 area. Fundamental focus will be on the US NFP number
USDCHF
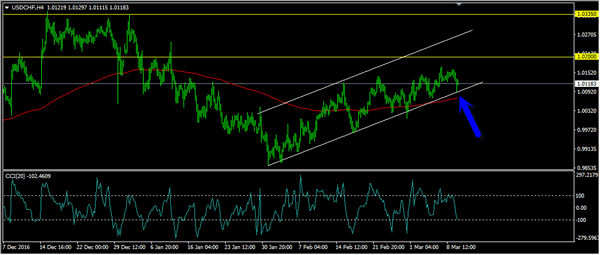
The USDCHF attempted to push lower yesterday bottomed at 1.0091 but closed a little bit higher at 1.0121 after touched the lower line of my bullish channel as you can see on my H4 chart below. The bias is neutral in nearest term. Immediate support is seen around 1.0090. A clear break below that area would expose 1.0050 – 1.0000 region. Immediate resistance is seen around 1.0150 followed by 1.0200. Fundamental focus will be on the US NFP number. Overall I remain neutral.
USD/CAD Candlesticks and Ichimoku Analysis
Weekly
- Last Candlesticks pattern: Bullish engulfing
- Time of formation: 02 May 2016
- Trend bias: Up
Daily
- Last Candlesticks pattern: Hammer
- Time of formation: 19 Oct 2016
- Trend bias: Up
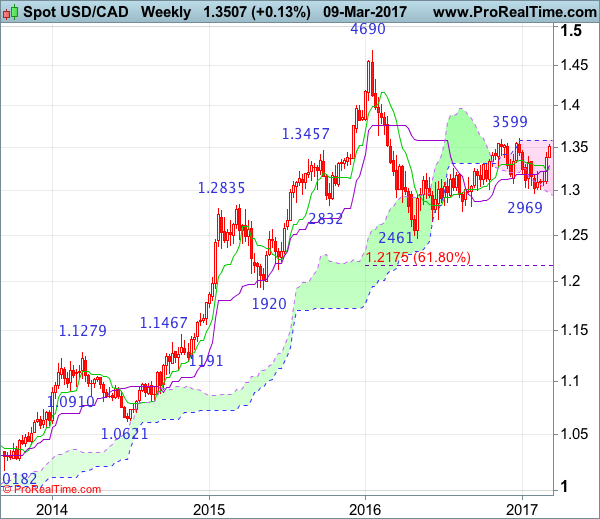
USD/CAD – 1.3505
The greenback has surged again after brief pullback, suggesting easy fall from 1.3599 top has ended at 1.2969 and mild upside bias remains for the rise from there to extend further giant 1.3550-55, however, reckon said resistance at 1.3599 would hold on first testing due to near term overbought condition. Only a break of this level would retain bullishness and extend early erratic upmove from 1.2461 low to 1.3660-70 and then 1.3700 but still reckon upside would be limited and risk from there is seen for a retreat later.
On the downside, whilst pullback to 1.3430-40 cannot be ruled out, reckon minor support at 1.3372 would limit downside and bring another rise later. Only a drop below the Tenkan-Sen (now at 1.3309) would defer and suggest top is possibly formed, bring test of the Kijun-Sen (now at 1.3258) but a daily close below there is needed to add credence to this view, bring retracement of recent rise to 1.3220-25 but downside should be limited to 1.3165 and bring rebound later.
Recommendation: Stand aside for this week.
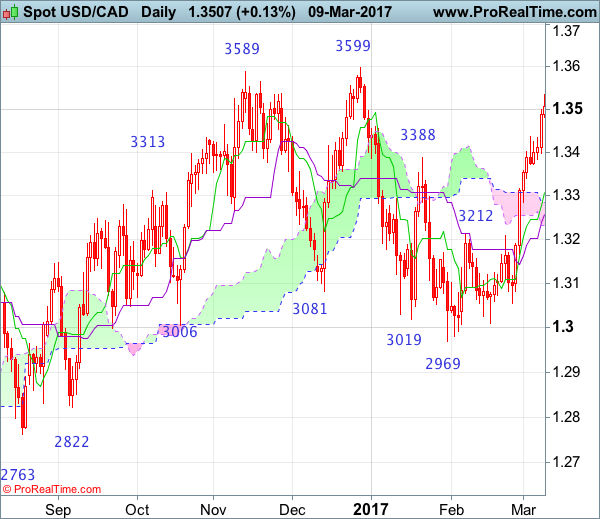
On the weekly chart, after forming a long white candlestick last week, the greenback has continued moving higher this week and another white candlestick looks set to be formed this week, adding credence to our view that the fall from 1.3599 has ended at 1.2969 earlier, hence consolidation with mild upside bias is seen for further gain towards said resistance at 1.3599, however, a break of this resistance is needed to retain bullishness and extend the erratic rise from 1.2461 (2016 low) to 1.3700 and later towards 1.3835-40 (61.8% Fibonacci retracement of 1.4690-1.2461) which is likely to cap upside.
On the downside, although pullback to 1.3400-10 cannot be ruled out, reckon downside would be limited to 1.3372 minor support and bring another rise later. A drop below this week's low at 1.3372 would risk test of the Kijun-Sen (now at 1.3284) but a weekly close below there Tenkan-Sen (now at 1.3252) is needed to suggest a temporary top is formed instead, risk weakness to 1.3210, break there would add credence to this view and bring further fall to 1.3150 and possibly towards 1.3083, however, indicated support at 1.3056 support should hold.
Trade Idea : USD/CHF – Buy at 1.0100
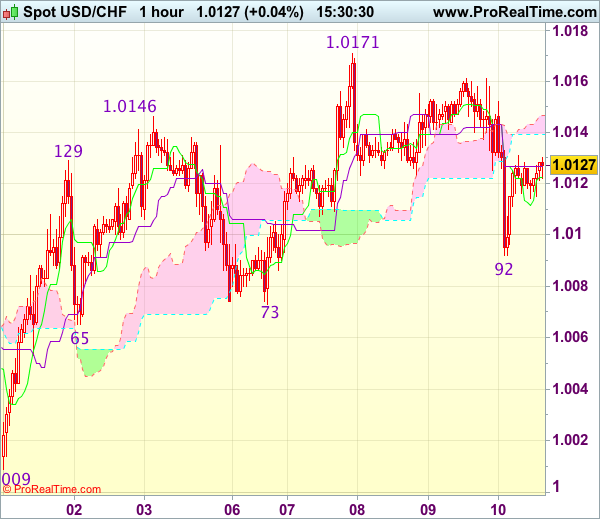
USD/CHF - 1.0125
Most recent candlesticks pattern : N/A
Trend : Near term up
Tenkan-Sen level : 1.0122
Kijun-Sen level : 1.0127
Ichimoku cloud top : 1.0147
Ichimoku cloud bottom : 1.0139
Original strategy :
Buy at 1.0080, Target: 1.0200, Stop: 1.0045
Position : -
Target : -
Stop : -
New strategy :
Buy at 1.0100, Target: 1.0200, Stop: 1.0070
Position : -
Target : -
Stop : -
As the greenback found good support at 1.0092 and has staged a strong rebound, suggesting low is possibly formed there and consolidation with mild upside bias is seen for gain to 1.0145-50, however, break of resistance at 1.0171 is needed to signal recent erratic rise from 0.9861 low has resumed and extend further gain to 1.0200-10 but near term overbought condition should limit upside to 1.0220-25 and price should falter below previous chart resistance at 1.0248.
In view of this, we are looking to buy dollar on dips as 1.0100 should limit downside and bring such rise. Below support at 1.0073 would abort and signal top has been formed instead, risk weakness to 1.0040-45 but reckon support at 1.0009 would remain intact.
Trade Idea : GBP/USD – Sell at 1.2215
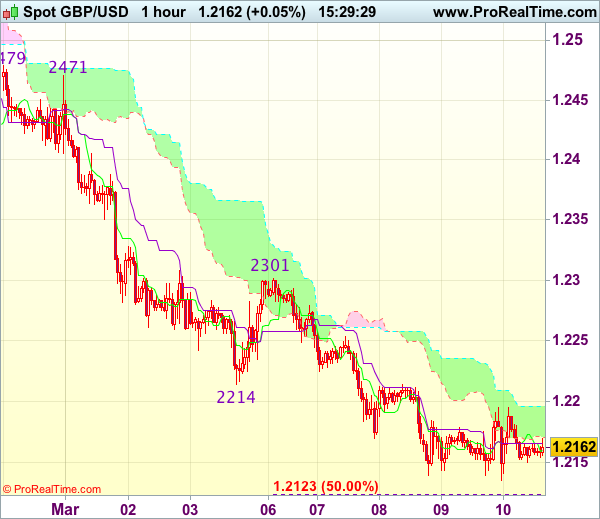
GBP/USD - 1.2159
Most recent candlesticks pattern : N/A
Trend : Near term down
Tenkan-Sen level : 1.2160
Kijun-Sen level : 1.2165
Ichimoku cloud top : 1.2196
Ichimoku cloud bottom : 1.2170
Original strategy :
Sell at 1.2215, Target: 1.2115, Stop: 1.2250
Position : -
Target : -
Stop : -
New strategy :
Sell at 1.2215, Target: 1.2115, Stop: 1.2250
Position : -
Target : -
Stop : -
As cable has continued to trade defensively, adding credence to our bearish view that recent decline from 1.2706 is still in progress and may extend further weakness to 1.2110-15, then 1.2090, however, loss of near term downward momentum should prevent sharp fall below 1.2070-75 and price should stay above 1.2050, risk from there is seen for a rebound later.
In view of this, would not chase this fall here and would be prudent to sell cable on recovery as 1.2210-15 should limit upside. Above resistance at 1.2253 would defer and suggest a temporary low is possibly formed instead, risk a stronger rebound to 1.2275-80 but price should falter below resistance at 1.2301 and bring another selloff.
Payrolls To Decide On Next Directional Move Of The Dollar
- Rates: Bar for payrolls too high after the intense sell-off?
The sell-off in US Treasuries accelerated this week and the bar for today's payrolls is high (200k consensus, decline in unemployment rate and pick-up in wages). Therefore, we think that there is room for profit taking ahead of the weekend with afterwards consolidation into Wednesday's Fed meeting. We hold our sell-on-upticks approach. - Currencies: Payrolls to decide on next directional move of the dollar
The dollar recently showed a mixed picture with EUR/USD drifting sideways, but USD/JPY clearing first resistance on higher core bond yields. Today, markets already expect a strong payrolls report. Will the report contain enough positive news to trigger further broad-based USD gains?
The Sunrise Headlines
- US stock markets ended the pre-payrolls session unchanged yesterday. Overnight, Asian equity markets trade mostly positive with Japan outperforming on the back of a weaker yen (+1.5%).
- Poland's Tusk has been re-elected president of the EC in the face of bitter opposition from his own country's government. His re-election heads off the prospect of a EU leadership crisis as it prepares for the Brexit negotiation
- China's corporate debt levels are excessively high, the head of its central bank said, as policymakers grow increasingly concerned about the risks from a rapid build-up in debt and an overheating housing market.
- South Korea's president was ejected from office by the country's Constitutional Court, following her impeachment and suspension over accusations that she helped a friend win bribes from several South Korean conglomerates.
- Senior Saudi energy officials told top independent US oil firms in a closed-door meeting this week that they should not assume OPEC would extend output curbs to offset rising production from US shale fields, two sources told Reuters.
- EU and IMF negotiators said that they will continue talks next week with Greece in a bid to broker a deal on reforms that Athens must undertake to unlock the next stages of its international bailout programme.
- Today's eco calendar contains UK industrial production data, but all attention turns to the US payrolls report. Consensus expects a strong report (200k) with a decline of the unemployment rate (4.7%) and a pick-up in wages (to 2.8% Y/Y)
Currencies: Payrolls To Decide On Next Directional Move Of The Dollar
Payrolls to decide on next directional USD move
The ECB's press conference directed trading in the major euro and dollar cross rates on Thursday. ECB's Draghi reiterated that ample policy stimulation is needed, but also said that there was no urgency anymore to take further action. TLTRO's won't be prolonged. European yields and the euro rebounded on these headlines. EUR/USD jumped temporary north of 1.06 and closed the day at 1.0577 (from 1.0541 on Wednesday). USD/JPY was also supported by the rise in core (USD/European) yields and an ongoing constructive equity sentiment. The pair finished the session at 114.95. So, the test of the 115 resistance continued.
Overnight, there are plenty of headlines on a Korean Court decision to remove the Korean President from power, but the direct impact on global markets is limited. The global reflation trade continues. Especially core bond yields maintain their uptrend . Asian equities mostly show modest losses. Japan is again the exception as equities profit from a further, broad-based decline of the yen. USD/JPY finally cleared the 114.96/115 resistance and trades currently in the 115.35 area. EUR/JPY also succeeded a nice break higher (122.26). EUR/USD hovers in the 1.06 area. PBOC governor Zhou indicated that the yuan exchange rate could remain relatively stable this year. Zhou also said that the a decline in the high amount of China FX reserves is ‘not bad'.
Today, the focus for global trading is on the US payrolls. With US interest markets at key technical levels, the report might decide on a new upleg in rates (cf fixed income part of this report) and in the dollar. Almost all recently published US data, including Wednesday's ADP report, point to a strong payrolls report. With 200 000, the consensus already assumes quite some good news. Aside from job growth, we also keep a close eye at the wage growth data (AHE expected to rise from 2.5% Y/Y to 2.8% Y/Y). An upward surprise in this measure might be at least as important for markets (and for the Fed) than strong payrolls growth. Even as the consensus is already quite high, we see chances for strong report. If so, the dollar might resume its uptrend. Of late USD/JPY profited most from higher core/US bond yields. 115.62 is the next short-term resistance (range top). Recent gains of the dollar against the euro were less convincing. Even so, in case of strong payrolls, broad-based USD strength will prevail. EUR/USD 1.0494 remains the first important support. A soft payrolls report might trigger some further USD consolidation. However, with the Fed already stepping up its normalisation process, any USD correction still should be modest and shouldn't question the MT USD uptrend yet. The 1.0679 correction top might come under test. We still assume EUR/USD 1.0829/74 will be difficult to regain. A sell EUR/USD on upticks remains favoured.
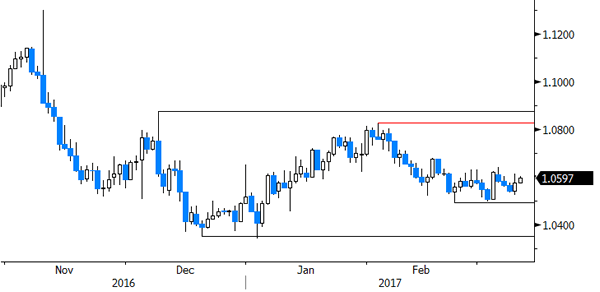
EUR/USD: USD fails to extend gains against the euro. Will the payrolls be storng enough for a new USD up-leg
EUR/GBP
EUR/GBP clearing the 0.87 big figure
On Thursday, sterling trading was driven by global factors and technical considerations. Especially the intraday swings of EUR/USD were important. A first new test of the 0.87 area was rejected, but a broad-based euro rebound during the ECB's press conference caused EUR/GBP to fill offers just north of 0.87. However, a sustained break didn't occur. EUR/GBP closed the session at 0.8695 (from 0.86663). Cable showed no clear trend as the dollar remain also rather well bid. The pair closed the session at 1.2165 (from 1.2168).
Today, the UK production data, construction output, the trade balance and the monthly NIESR GDP estimate will be published. January production is expected to fall back on the monthly basis after strong growth in December. The trade deficit is expected to stabilise at a high level. Of late, sterling became a bit more sensitive to signs of a deceleration of the ‘post-Brexit boom'. A big deviation from consensus in the trade balance probably has most potential to move sterling. Even so, we don't expect today's data to change the broader picture. There will also be plenty of headlines on the Brexit strategy of both the EU and the UK from the EU summit in Brussels. Last but not least, the global market reaction to the payrolls will also affect sterling. In the past, a decline of EUR/USD often also triggered losses in EUR/GBP. We have the impression that this effect is becoming less pronounced short-term.
Sterling sentiment softened of late. The euro was in better shape at the end of last week, helping EUR/GBP to break the 0.8592 resistance, which improved the short-term EUR/GBP picture. We don't expect a sustained EUR/USD rebound , but a combination of temporary euro consolidation and ongoing sterling softness might trigger some further ST EUR/GBP gains. The break north of 0.8645 reinforced the ST positive momentum. The 0.8854 correction top is the next key resistance.
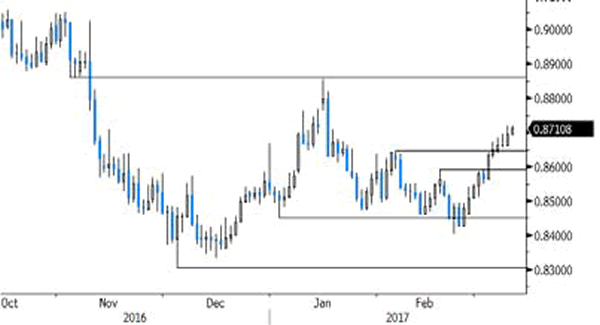
EUR/GBP uptrend continues. 0.8854 Jan top is next key resistance
Trade Idea : EUR/USD – Buy at 1.0560
EUR/USD - 1.0595
Most recent candlesticks pattern : N/A
Trend : Sideways
Tenkan-Sen level : 1.0588
Kijun-Sen level : 1.0570
Ichimoku cloud top : 1.0566
Ichimoku cloud bottom : 1.0544
Original strategy :
Buy at 1.0560, Target: 1.0660, Stop: 1.0525
Position : -
Target : -
Stop : -
New strategy :
Buy at 1.0560, Target: 1.0660, Stop: 1.0525
Position : -
Target : -
Stop : -
Yesterday’s strong rebound after finding support at 1.0525\ suggests the retreat from 1.0640 has ended at 1.0525 and consolidation with mild upside bias is seen for further gain towards said resistance at 1.0640, however, break there is needed to retain bullishness and signal another leg of the erratic rise from 1.0493 low is underway for retracement of early decline to 1.0660-65 (50% Fibonacci retracement of 1.0829-1.0493) and possibly towards resistance at 1.0680 but price should falter well below 1.0700-05 (61.8% Fibonacci retracement).
In view of this, we are looking to buy euro on dips as 1.0560 should limit downside and bring another rise later. Below said support at 1.0525 would abort and risk test of 1.0493-96 but only break there would shift risk back to the downside and signal recent decline from 1.0829 has resumed for further selloff to 1.0470 and then towards previous support at 1.0454.

Trade Idea : USD/JPY – Buy at 114.90
USD/JPY - 115.38
Most recent candlesticks pattern : N/A
Trend : Near term up
Tenkan-Sen level : 115.27
Kijun-Sen level : 114.93
Ichimoku cloud top : 114.31
Ichimoku cloud bottom : 114.19
Original strategy :
Buy at 114.20, Target: 115.20, Stop: 113.85
Position : -
Target : -
Stop : -
New strategy :
Buy at 114.90, Target: 115.90, Stop: 114.55
Position : -
Target : -
Stop : -
As the greenback has surged again today and broke above indicated previous resistance at 115.38, adding credence to our bullishness for recent upmove to extend further gain to another previous resistance at 115.62, however, near term overbought condition should prevent sharp move beyond 115.90-00, risk from there has increased for a retreat to take place later.
In view of this, would not chase this rise here and we are looking to buy dollar on pullback as 114.90-00 should limit downside and bring another rise. Below previous resistance at 114.75-76 would defer and risk test of 114.50-55 but break of support at 114.26 is needed to signal top is formed instead.