Sample Category Title
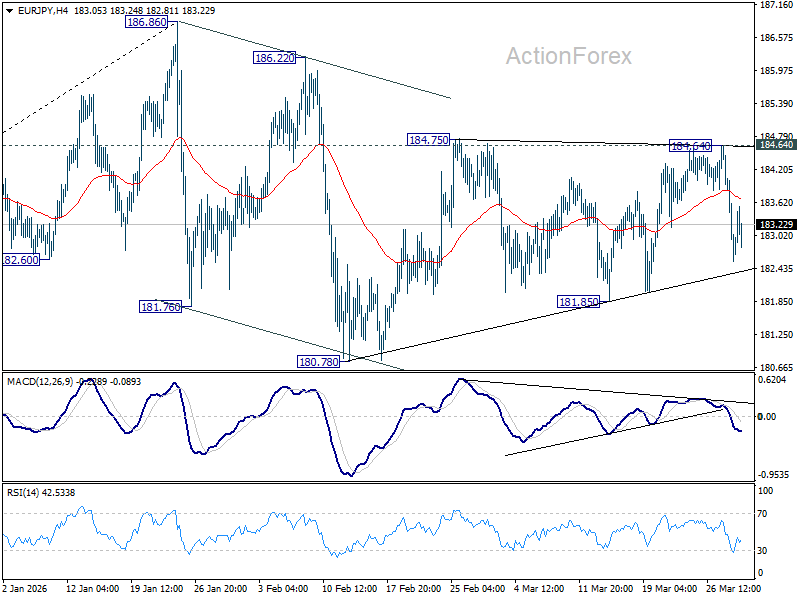
EUR/JPY Daily Outlook
Daily Pivots: (S1) 182.27; (P) 183.39; (R1) 184.20; More...
Risk remains on the downside for EUR/JPY with 185.64 resistance intact. Correction from 186.86 is probably in the third leg already. Break of 181.85 support will target 180.78 and below. Nevertheless, break of 184.64 resistance will invalidate this view, and bring retest of 186.86 high instead.
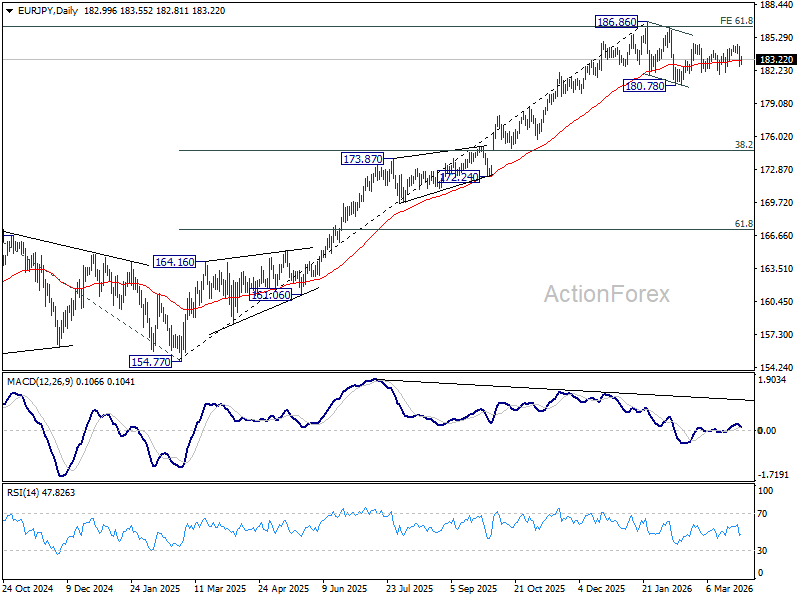
In the bigger picture, a medium term top could be in place at 186.86 and some more consolidations would be seen. Nevertheless, as long as 55 W EMA (now at 175.93) holds, the larger up trend from 114.42 (2020 low) remains intact. Firm break of 186.86 will pave the way to 78.6% projection of 124.37 (2022 low) to 175.41 (2025 high) from 154.77 at 194.88 next.
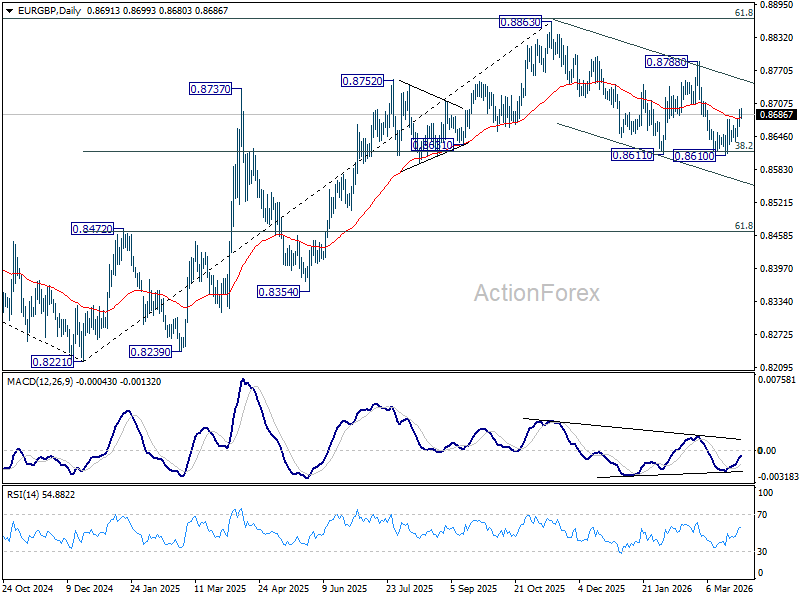
EUR/GBP Daily Outlook
Daily Pivots: (S1) 0.8674; (P) 0.8687; (R1) 0.8706; More…
EUR/GBP's rebound from 0.8610 is still in progress. A short term bottom should be formed and intraday bias remains on the upside for 0.8788 resistance. For now, risk is mildly on the upside as long as 0.8610 support holds, in case of retreat.
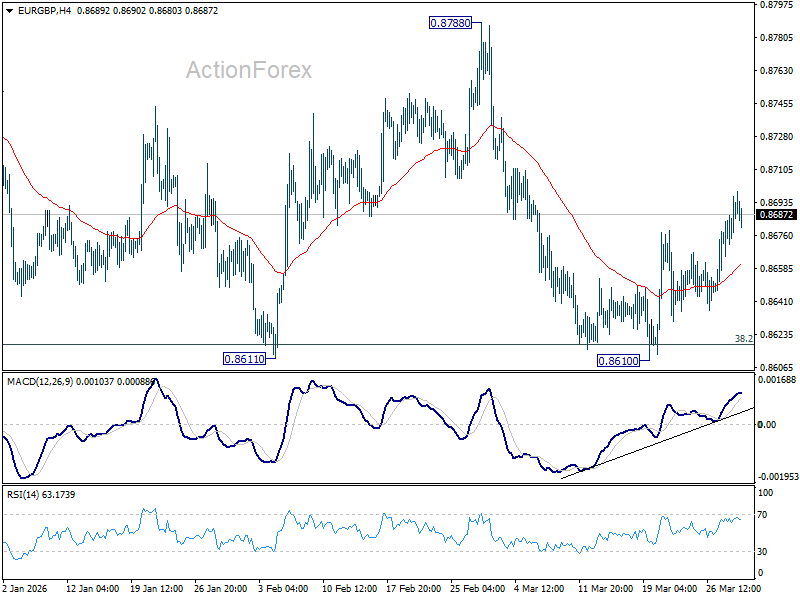
In the bigger picture, current development revived the case that whole rise from 0.8221 (2024 low) has completed at 0.8863, after rejection by 61.8% retracement of 0.9267 (2022 high) to 0.8221 at 0.8867. Sustained trading below 38.2% retracement of 0.8821 to 0.8863 at 0.8618 will confirm this case, and bring deeper fall to 61.8% retracement at 0.8466 at least. For now, medium term outlook is neutral at best as long as 0.8863 resistance holds.
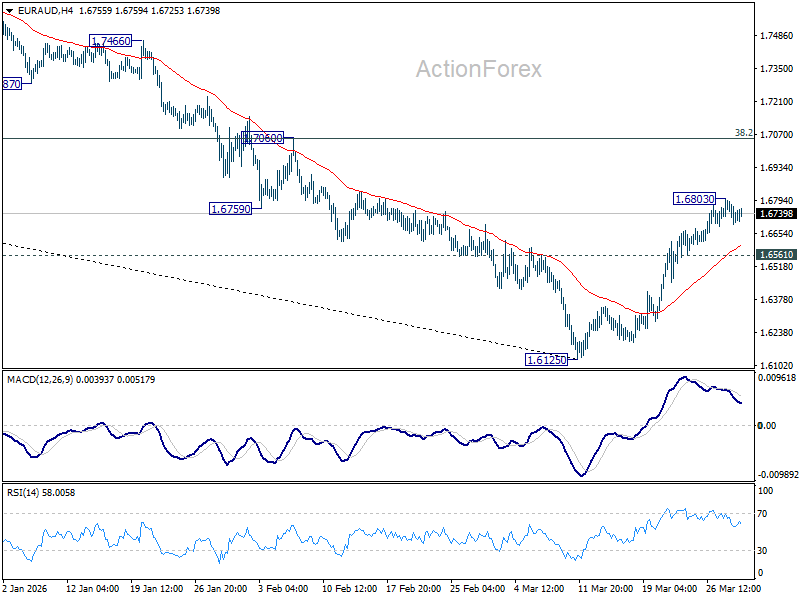
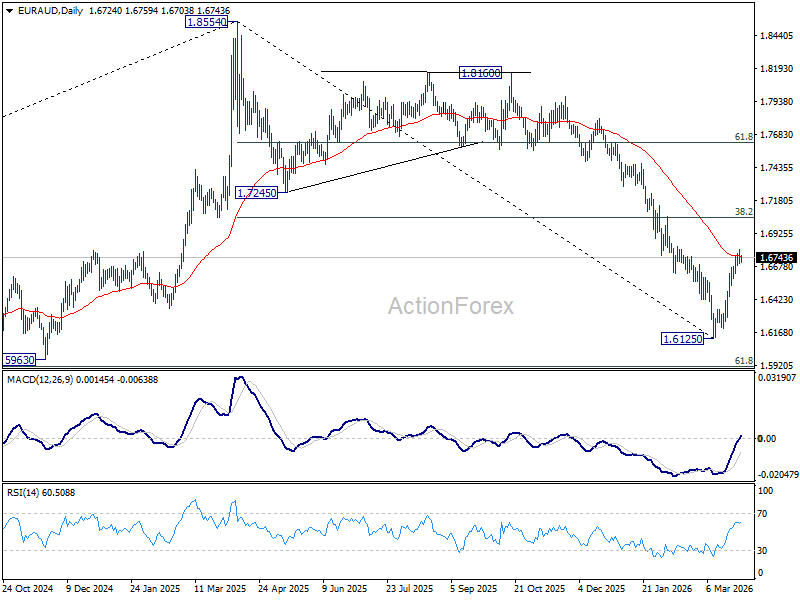
EUR/AUD Daily Outlook
Daily Pivots: (S1) 1.6680; (P) 1.6746; (R1) 1.6793; More...
Intraday bias in EUR/AUD is turned neutral first with current retreat. On the upside, above 1.6803 will extend the rebound from 1.6125 to 38.2% retracement of 1.8554 to 1.6125 at 1.7053. However, break of 1.6561 minor support will argue that the rebound has completed, after rejection by 55 D EMA (now at 1.6754). Retest of 1.6125 low should be seen next.
In the bigger picture, fall from 1.8554 medium term top is seen as reversing the whole up trend from 1.4281 (2022 low). Deeper decline should be seen to 61.8% retracement of 1.4281 to 1.8554 at 1.5913, which is slightly below 1.5963 structural support. Decisive break there will pave the way back to 1.4281. For now, risk will stay on the downside as long as 55 W EMA (now at 1.7226) holds, even in case of strong rebound.
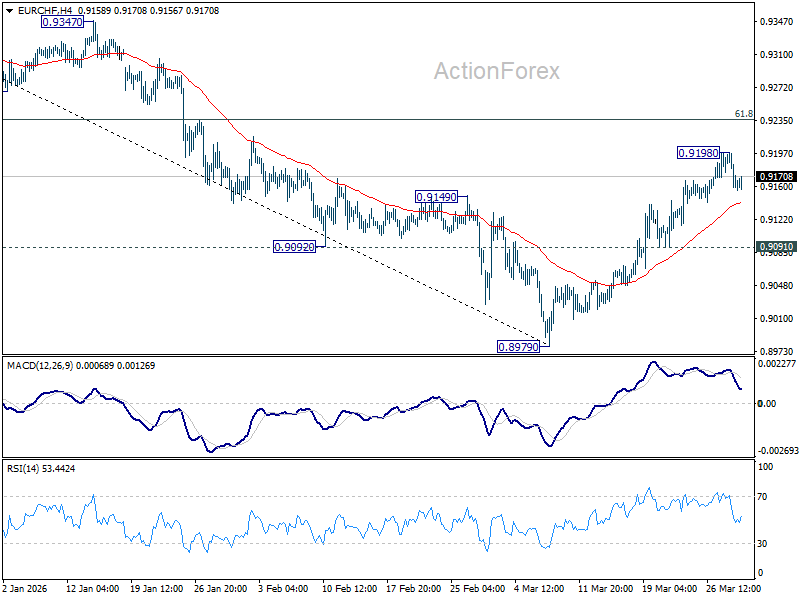
EUR/CHF Daily Outlook
Daily Pivots: (S1) 0.9149; (P) 0.9176; (R1) 0.9192; More....
Intraday bias in EUR/CHF is turned neutral first with current retreat. On the upside, above 0.9198 will extend the rebound from 0.8979 short term bottom to 61.8% retracement of 0.9394 to 0.8979 at 0.9235. Sustained break there will pave the way to 0.9394 key resistance next. However, firm break of 0.9091 support will argue that the rebound has completed, and turn bias back to the downside for retesting 0.8979 low.
In the bigger picture, as long as 55 W EMA (now at 0.9286) holds, the larger down trend from 0.9928 (2024 high) is still expected to continue through 0.8979 at a later stage. However, sustained break of 55 W EMA should confirm medium term bottoming, and bring stronger rise through 0.9394 resistance, even as a corrective move.

Brent Crude Trading at $113.5/b This Morning Indicative to Lack of Confidence in an Off-Ramp
Markets
The fog of war thickens as we’ve entered the US’s initial 4-to-6 weeks timeline to achieve its military goals in Iran. Only yesterday, US President Trump indicated that the US is in serious discussions with the (new) regime in Iran, but that it can still destroy Iranian energy infrastructure if the Strait of Hormuz isn’t immediately open for business. This morning, the WSJ reports that Trump told aides he’s willing to end the war without reopening the Strait of Hormuz as such operation could extend the total war timeline easily by another 4-to-6 weeks. Recall that the same WSJ yesterday headlined that a ground invasion to extract Iran’s uranium was under consideration. The FT focused on the possibility of seizing the strategic Khargh island (oil export hub). Add into the mix this weekend arrival of the USS Tripoli and the 31st Marine Expeditionary Unit, Houthi involvement (Red Sea is key trade choke point), continuous US/Israeli bombing and targeted Iranian retaliation (eg Kuwaiti oil tanker off Dubai overnight) and it remains anyone’s guess whether the Gulf War is about to escalate or de-escalate.
Brent crude trading at $113.5/b this morning is indicative to lack of confidence in an off-ramp. Key US equity indices (S&P & Nasdaq) eventually closed at new sell-off lows despite a slightly better start. Volatility on fixed income markets remains elevated with core bonds coming off the lows. Hawkish repositioning went far enough for now to navigate through the current fog. US Fed Chair Powell yesterday laid out the case for patience in case of the Federal Reserve. By pushing against the “emergency” rate hike case, he helped US Treasuries during their intraday rally. The US yield curve eventually bull steepened with yields ending 5.3 bps (30-yr) to 8.3 bps (2 to 7-yr) lower. Powell did warn for the impact on inflation expectations: “You can have a series of these supply shocks and that can lead the public generally—businesses, price setters, households—to start expecting higher inflation over time. Why wouldn’t they?” In FX space, the dollar gained for a fifty consecutive session. The trade-weighted greenback is bumping heavily against the 100.25/50 resistance area which is the neckline of a multiple bottom formation. A weekly close above this zone would be technically very relevant and strengthen the case for further USD-gains. EUR/USD keeps drifting lower, closing below 1.15 yesterday for only the third time this year and the sixth time since the start of H2 2025. Today’s eco calendar contains EMU CPI inflation, US Chicago PMI, consumer confidence and JOLTS job openings. Our in-house nowcast model sees headline inflation rising from 1.9% Y/Y to 2.5% Y/Y, slightly less than the consensus estimate (2.6%). We expect today’s numbers to be of limited importance as the market still navigates from the one Iran-related headline to the other.
News & Views
Inflation in Japan’s capital cooled to the slowest pace in almost two years in March. Consumer prices in Tokyo rose 1.4%, decelerating from an downwardly revised 1.5%. The gauge excluding fresh food ticked lower to 1.7% from 1.8%. Energy subsidies explained much of the easing with overall prices falling 7.5%. Gas prices, however, only dropped 1% compared to a whopping 14.7% decline in February in what are most likely spillover effects from the Iran war. The inflation measure excluding fresh food & energy costs still came in at an elevated 2.6% (from 2.7%). The currently higher oil and gas prices are expected to add further upward inflation pressure in coming months. Additional yen weakness adds fuel to the fire. USD/JPY in recent days soared to the 160 mark compared with 156 at the beginning of March. It prompted again strong verbal warnings from the Ministry of Finance yesterday. The Japanese currency today barely trades stronger around USD/JPY 159.6.
The British Retail Consortium warned UK consumers that price increases are inbound. Goods prices sold in the UK rose by just 1.2% in March, slightly higher than the 1.1% seen in February. But that relatively benign price evolution is to be upended in the short-term as energy costs surge and the broader supply chain disruption triggered by the conflict in the Middle East are working their way through. BRC said it will take at least three months before the effect passes through to consumer prices with retailers first working with suppliers to try to mitigate the impact on prices as far as possible. The BRC data were collected between March 1 and March 7. Brent oil since the cut-off date has risen another 20%+.
AUD/USD Daily Report
Daily Pivots: (S1) 0.6833; (P) 0.6854; (R1) 0.6875; More...
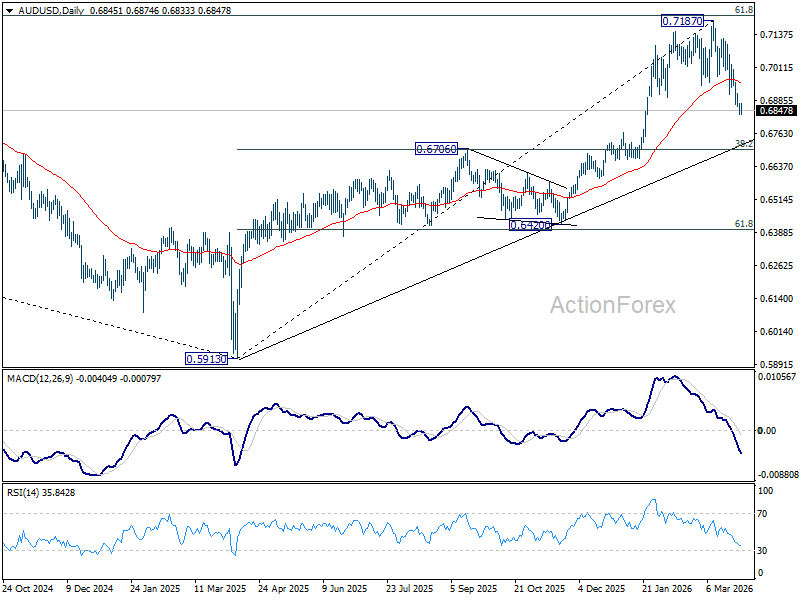
Intraday bias in AUD/USD remains on the downside at this point. Current fall from 0.7187 should target retracement of 0.5913 to 0.7187 at 0.6700. On the upside, above 0.6911 minor resistance will turn intraday bias neutral first. But risk will stay on the downside as long as 0.7187 resistance holds, in case of recovery.
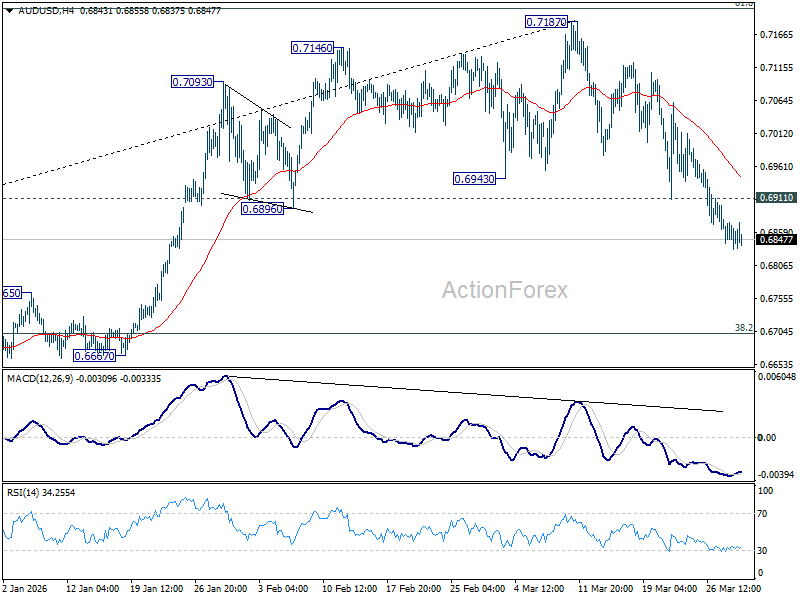
In the bigger picture, as long as 0.6706 cluster support holds, rise from 0.5913 (2024 low) should still be in progress. Decisive break of 61.8% retracement of 0.8006 to 0.5913 at 0.7206 will solidify the case that it's already reversing the down trend from 0.8006 (2021 high). However, firm break of 0.6706 will dampen this bullish case, and bring deeper fall back to 0.6420 support, and possibly below.
USD/CAD Daily Outlook
Daily Pivots: (S1) 1.3890; (P) 1.3918; (R1) 1.3955; More...
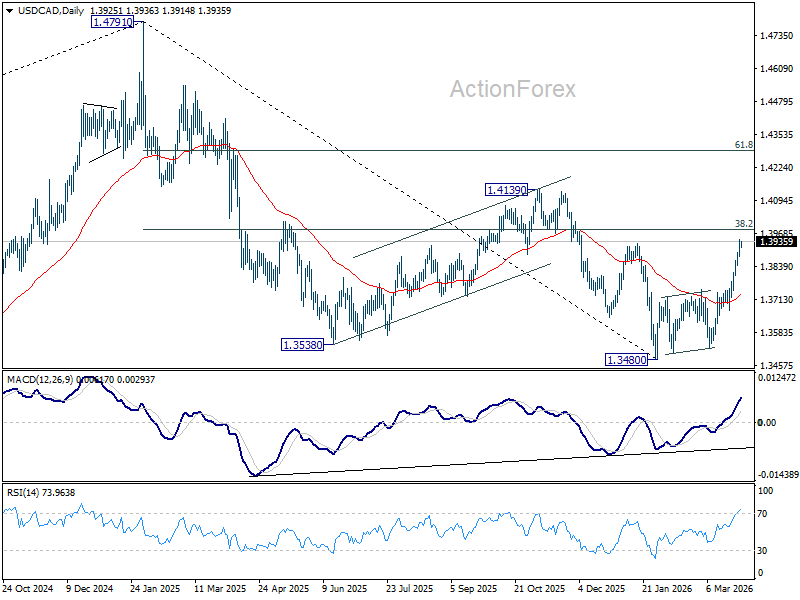
Intraday bias in USD/CAD stays on the upside at this point. Current rally from 1.3480 is in progress for 38.2% retracement of 1.4791 to 1.3480 at 1.3981. Decisive break there will argue that it's already reversing the whole down trend from 1.4791, and target 61.8% retracement at 1.4290. On the downside, below 1.3879 minor support will turn intraday bias neutral first. But risk will stay on the upside as long as 1.3751 resistance turned support holds, in case of retreat.
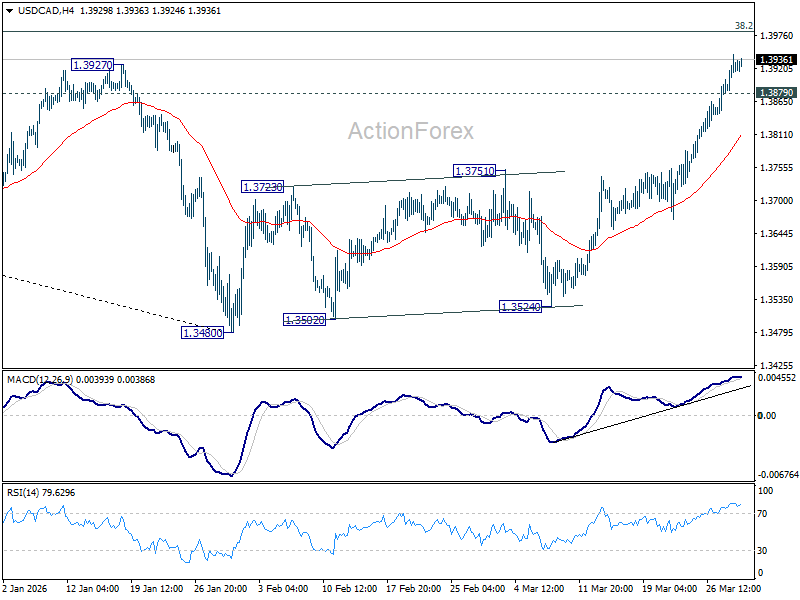
In the bigger picture, price actions from 1.4791 are seen as a corrective pattern to the whole up trend from 1.2005 (2021 low). Deeper fall could be seen, as the pattern extends, to 61.8% retracement of 1.2005 to 1.4791 at 1.3069. However, break of 1.3927 resistance will argue that the correction has completed with three waves down to 1.3480 already. Further break of 1.4139 will confirm and bring retest of 1.4791 high.
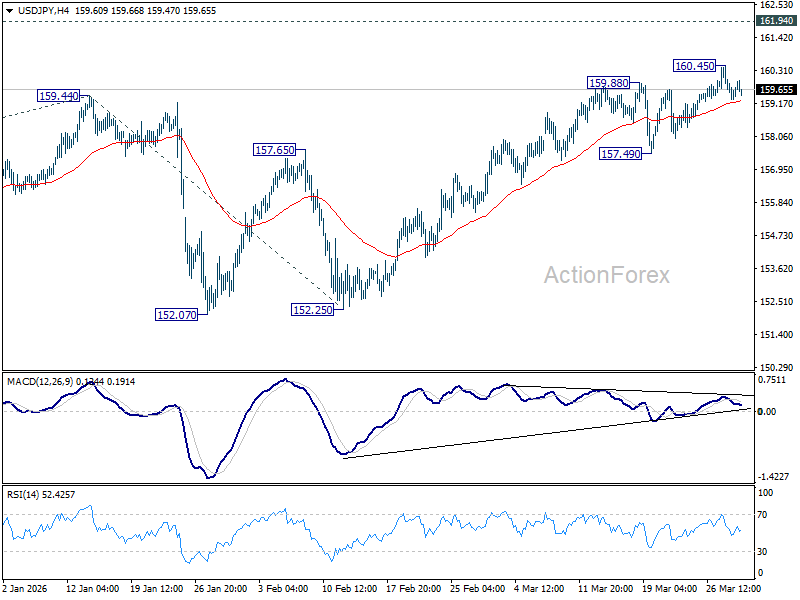
USD/JPY Daily Outlook
Daily Pivots: (S1) 159.17; (P) 159.82; (R1) 160.39; More...
Intraday bias in USD/JPY remains neutral for some more consolidations, and further rally is still in favor. Above 160.45 will bring retest of 161.94 high. Nevertheless, considering bearish divergence condition in 4H MACD, sustained break of 55 4H EMA (now at 159.27) will indicate short term topping, and turn bias to the downside for 157.94 support instead.
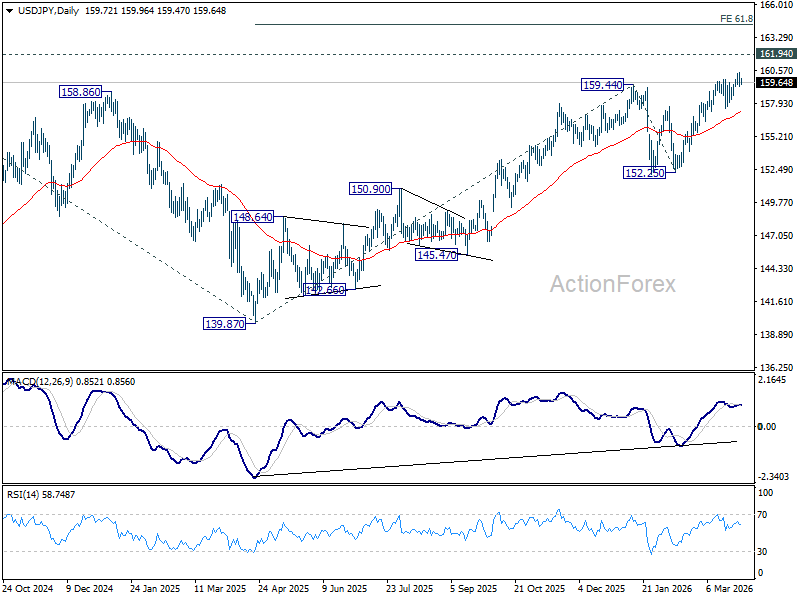
In the bigger picture, outlook is unchanged that corrective pattern from 161.94 (2024 high) should have completed with three waves at 139.87. Larger up trend from 102.58 (2021 low) could be ready to resume through 161.94. This will remain the favored case as long as 55 W EMA (now at 152.97) holds. Firm break of 161.94 will pave the way to 61.8% projection of 102.58 to 161.94 from 139.87 at 176.75.
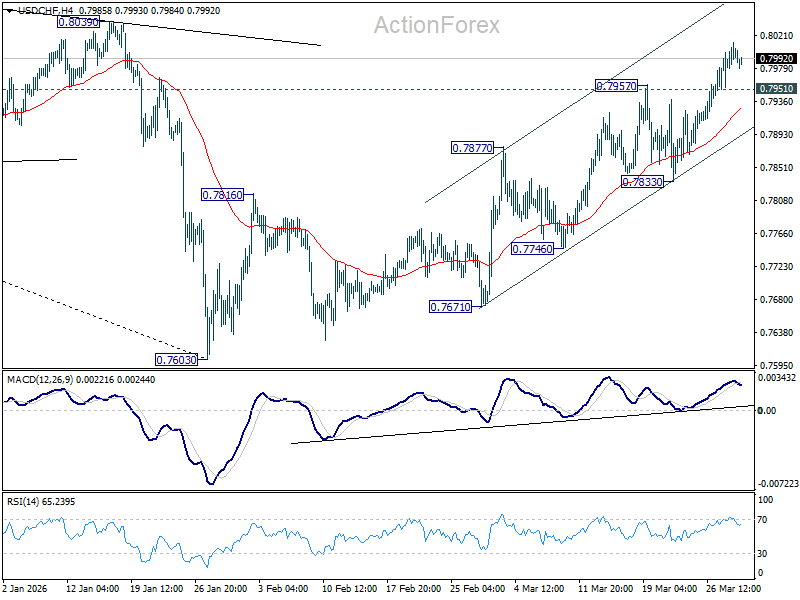
USD/CHF Daily Outlook
Daily Pivots: (S1) 0.7969; (P) 0.7991; (R1) 0.8019; More….
Intraday bias in USD/CHF remains on the upside at this point. Current rally from 0.7603 should target 38.2% retracement of 0.9200 to 0.7603 at 0.8213. On the downside, below 0.7951 minor support will turn intraday bias neutral first. But further rally is expected as long as 0.7833 support holds, in case of retreat.
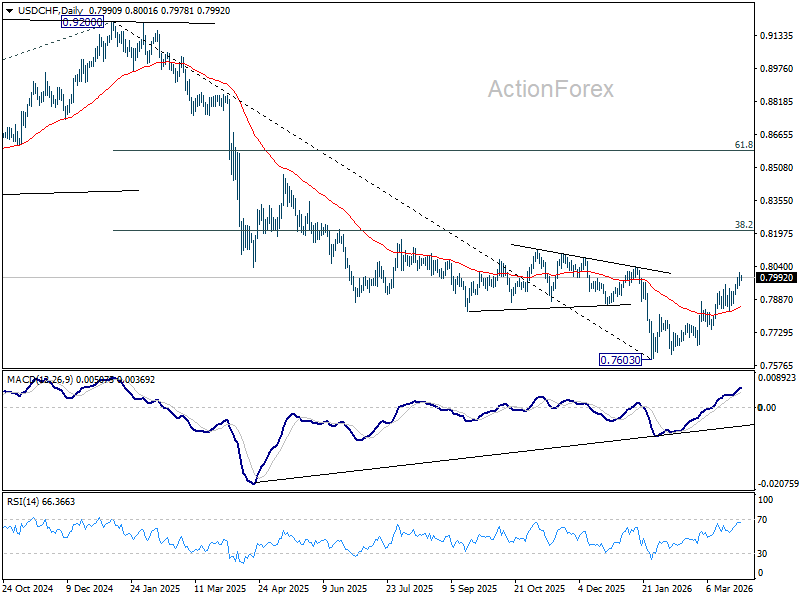
In the bigger picture, a medium term bottom should be in place at 0.7603 on bullish convergence condition in D MACD. Rebound from there is seen as correcting the fall from 0.9200 only. However, decisive break of 55 W EMA (now at 0.8088) will suggest that it's probably correcting the larger scale down trend from 1.0146 (2022 high). On the other hand, rejection by the 55 W EMA will setup down trend resumption to 100% projection of 1.0146 (2022 high) to 0.8332 from 0.9200 at 0.7382 at a later stage.
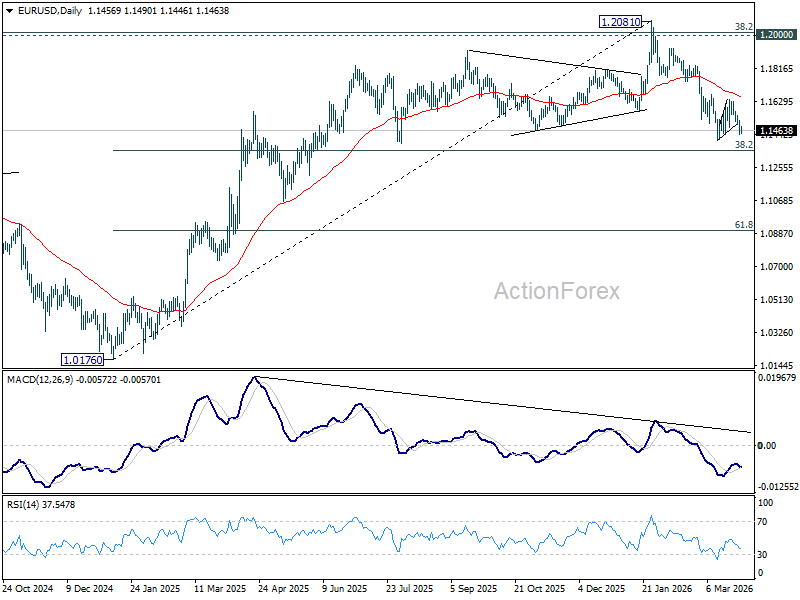
EUR/USD Daily Outlook
Daily Pivots: (S1) 1.1429; (P) 1.1476; (R1) 1.1509; More….
Intraday bias in EUR/USD remains neutral and more consolidations could still be seen above 1.1408. Further decline is expected with 1.1666 cluster resistance (38.2% retracement of 1.2081 to 1.1408 at 1.1665) intact. On the downside, firm break of 1.1408 will resume the fall from 1.2081 to 38.2% retracement of 1.0176 to 1.2081 at 1.1353. However, decisive break of 1.1666 will argue that the fall from 1.2081 has completed, and turn bias back to the upside for 61.8% retracement of 1.2081 to 1.1408 at 1.1824.
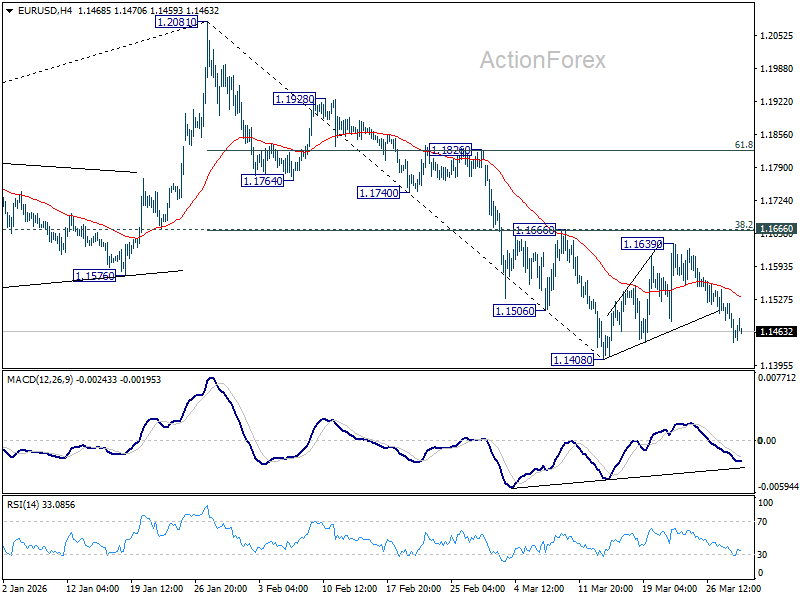
In the bigger picture, prior break of 55 W EMA (now at 1.1497) should confirm rejection by 1.2 key cluster resistance level. The whole up trend from 0.9534 (2022 low) might have completed as a three wave corrective rise too. Deeper fall is expected to long term channel support (now at 1.0535). Meanwhile, risk will stay on the downside as long as 1.2081 holds, even in case of strong rebound.