
Sample Category Title
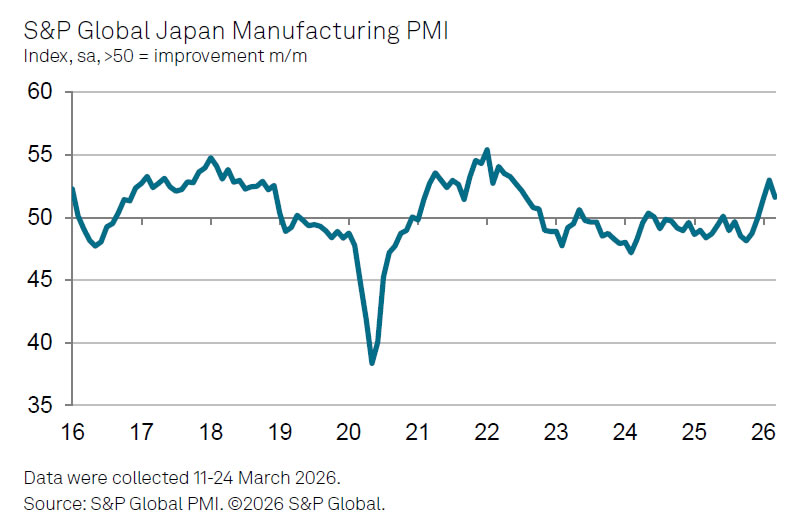
Japan PMI Manufacturing Finalized at 51.6, War-Driven Cost Pressures Build
Japan’s PMI Manufacturing was finalized at 51.6 in March, down from February’s 45-month high of 53.0, signaling moderation in growth momentum. Even so, the reading still marked the second-strongest performance since July 2022, with Q1 overall delivering the best quarterly showing since Q2 2022.
S&P Global Market Intelligence's Annabel Fiddes noted that the slowdown coincided with escalation of the Middle East conflict, which survey respondents linked directly to rising cost pressures. Input prices increased at the fastest pace in over a year-and-a-half, driven largely by higher energy costs. Firms responded by raising output prices "at a quicker pace as they sought to protect their margins".
“While the immediate impact of the war is already feeding through directly to price indicators, it will be important to monitor the PMI data in the coming months to see whether cost and supply chain pressures continue to intensify, and to assess how resilient global demand conditions are," Fiddles added.
Japan’s Strong Tankan Signals Support BoJ Normalization Despite External Risks
Japan’s Q1 Tankan survey showed business sentiment holding firm, with the Large Manufacturing Index rising from 16 to 17, beating expectations of 16. The Non-Manufacturing Index held steady at 36, also above forecasts of 33. The data points to stable domestic conditions even as external uncertainties persist, and strengthens the case for further normalization by the BoJ.
Capital expenditure plans added to the constructive tone, with large firms expecting to increase spending by 3.3% in fiscal 2026, slightly above the 3.0% market forecast.
The survey highlighted strong demand linked to artificial intelligence and semiconductors, reinforcing the view that Japan’s corporate sector continues to benefit from structural tech investment trends. However, the Middle East conflict weighed on petroleum, coal, and chemical sectors.
More importantly for the BoJ, inflation expectations rose notably. Firms now see inflation at 2.6% one year ahead, up from 2.4%. Projections for three and five years both climbed to 2.5%, the highest on record. This sustained rise reinforces the narrative of a gradual shift in Japan’s inflation dynamics, supporting expectations that the BoJ will continue its path toward policy normalization.
Brent-WTI Falls to 2026 Lows! Oil Corrects as War Resolution Nears – WTI Outlook
- Oil tumbles as traders are getting more convinced that the conflict is heading towards its end
- The Brent-WTI spread erases its entire War premium, hinting at softer conditions in a stressed Market
- Exploring an in-depth Technical Analysis of the commodity
Traders are now slowly preparing for an end to the US-Iran conflict after 5-weeks of ceaseless, methodical attacks from the US-Israel coalition on IRGC military targets.
The conflict has caused significant damage and volatility in global Markets, dampening equities and overall risk assets and even hurting traditional safe havens like Metals and bonds amid a rise in inflation expectations.
Precious Metals like Gold actually began to trade as if they were typical risk assets during the war, as flagged in a HSBC piece – We are indeed in a new age for Markets!
As always in the Middle East, Crude Oil is right in the center stage, having bounced about 50% since February 27, the Friday that preceded the commencement of the conflict.
As the war began, the Brent-WTI spread, a historical indicator of energy commodity Market stress, had spiked to $18.65, levels unseen since February 2019 (excluding the extreme COVID spikes).
This spread is now rushing back towards its yearly and pre-war lows.
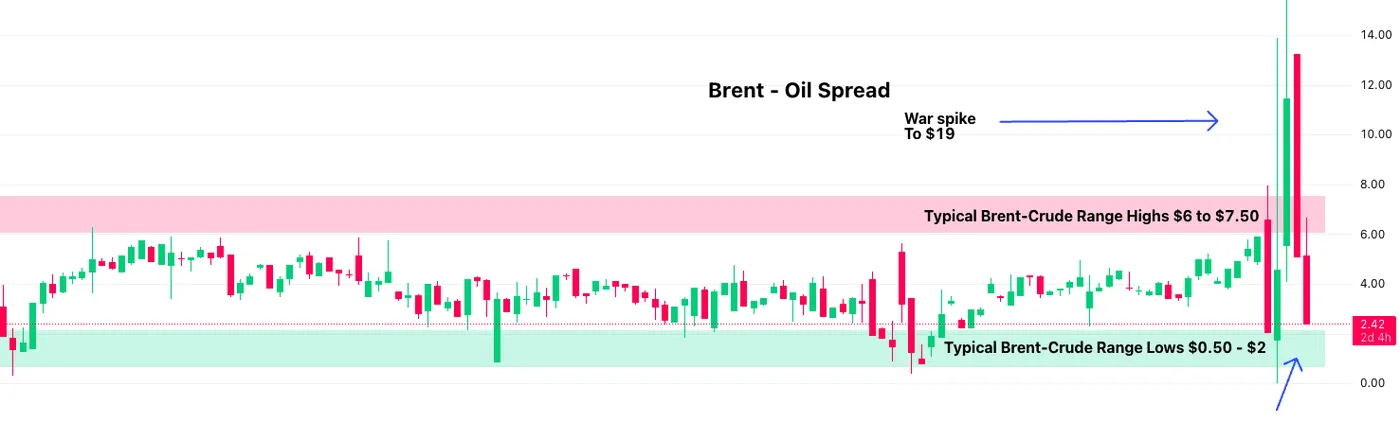
Brent-WTI Spread – Source: TradingView. March 31, 2026
This indicates a large easing in narrative, at least, which also could compromise Trump's threat to let European and Gulf nations take care of the Strait of Hormuz passage after the military operation.
In any case, the spread easing in such a manner could further ease tensions in the Energy Market, as the two enemy-counterparties confirm they are engaged in more serious talks.
China and Pakistan have formulated their own 5-point Peace Plan for a smoother, peaceful process ahead. That same plan wasn’t even criticized by President Trump in his daily address – given how verbal the President typically is, this was a first- and Markets took this as a sign of significant progress, boosting Equity Indexes by 2.50% each in the afternoon session.
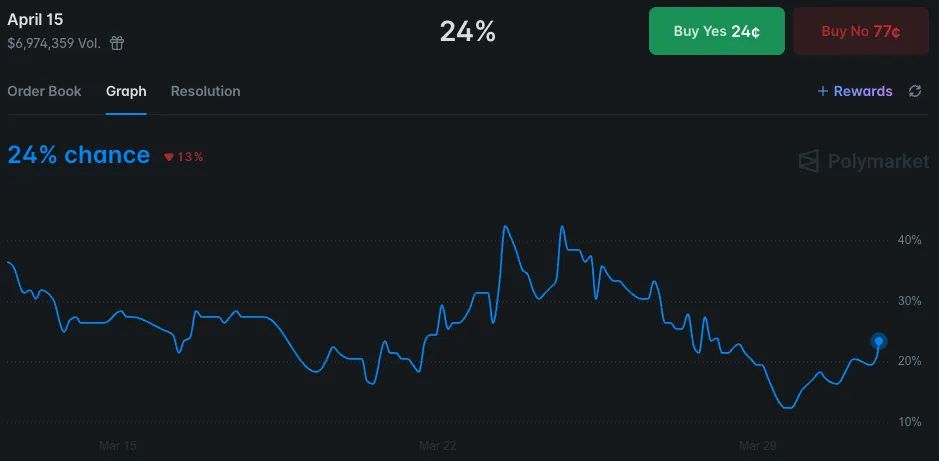
Odds for a US-Iran Ceasefire by April 15 – Source: Polymarket. March 31, 2026
For now, Polymarket odds for a ceasefire by April 15 are still only around 25%. Still, a lack of a ceasefire doesn't prevent a truce – how volatile that truce will be and under what conditions will dictate whether more consistent upside is warranted in risk assets.
Upcoming headlines and developments will have to be contrasted heavily by Participants, particularly as expectations from here will be elevated, and today's session moves might be exaggerated by the Month-End flows.
As the situation becomes clearer as the week continues, let's dive into a multi-timeframe analysis of WTI (US) Oil to identify levels of interest and put the odds in the trader's favor to capitalize on the situation.
US Oil Multi-Timeframe Analysis
WTI Daily Chart
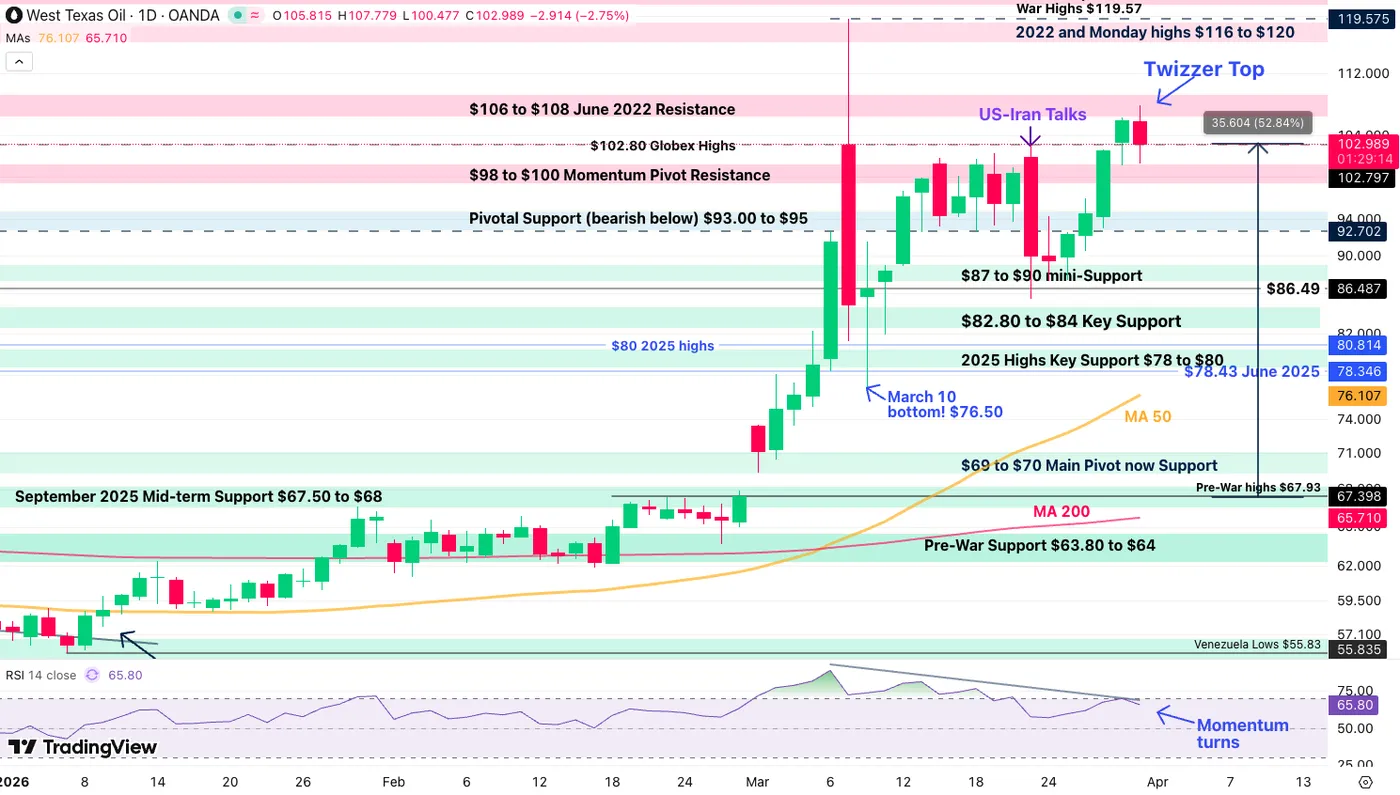
WTI Oil Daily Chart – March 31, 2026. Source: TradingView
WTI's steep rise in previous sessions has seen a significant stop with the turn in narrative.
Testing $107.80 in the overnight trading, the key resistance was then rejected, but the price action isn't so clear yet.
Tumbling to $100 and reverting higher, traders will want to see a clear rejection to the downside to assume a clearer path ahead.
The past two daily candlesticks have formed a Tweezer top, which coincides with a turn in RSI plus a bearish RSI pattern, all pointing to some downside.
But timing will be important to avoid getting tricked by a sudden change in atmosphere – Waiting for a clear break below today's lows could be a better way to avoid getting stuck short.
WTI 4H Chart and Technical Levels
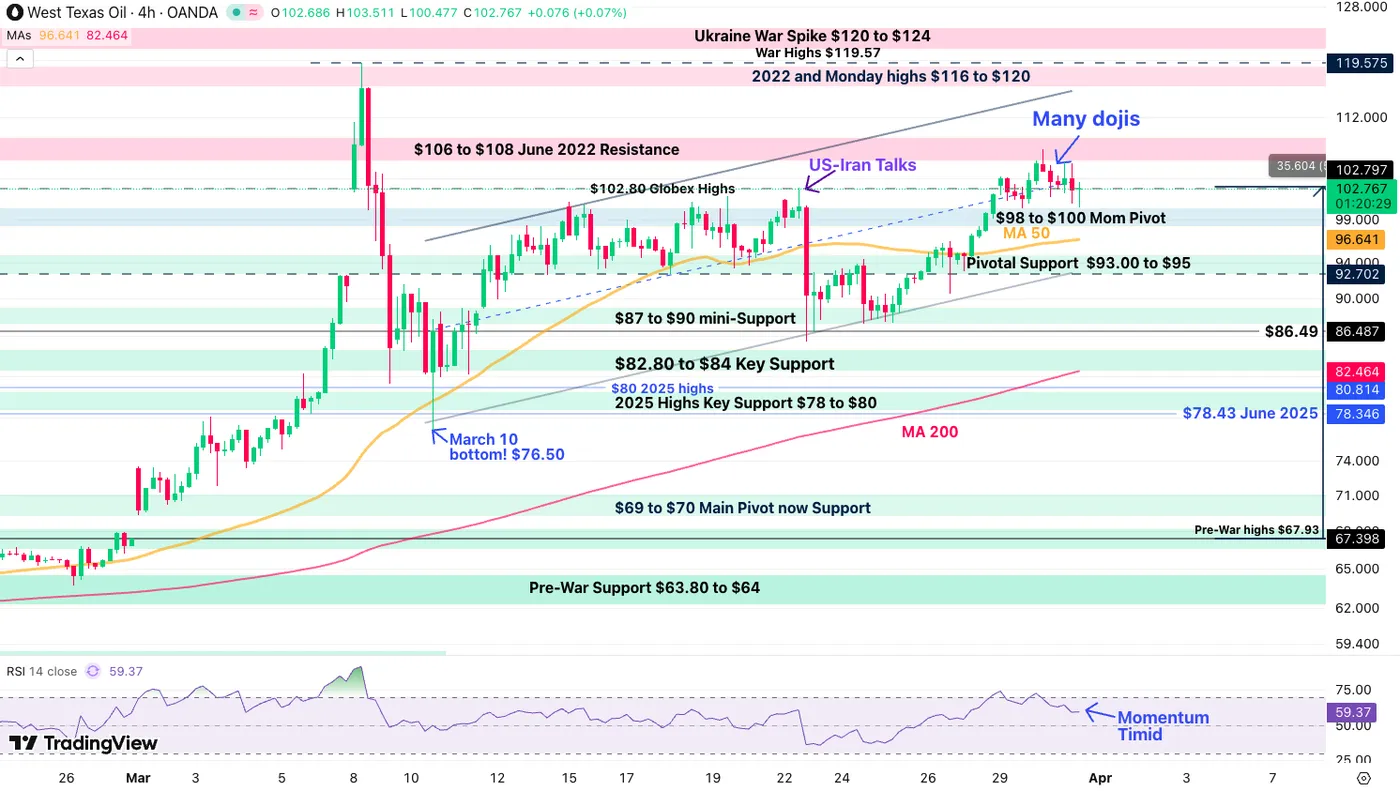
WTI Oil 4H Chart – March 31, 2026. Source: TradingView
As seen in the intraday charts, recent candles are more pointing towards a very hesitant price action that a decidedly bearish reversal – In such setups, waiting for breakouts with Stop orders could prove a more efficient strategy.
- For bears, watch for a clean break below $100, with extra confirmation below $96.64 (4H 50 MA) and $92.70 for an final conflict support break.
- Bulls will want to see an extension and close above $108 to head back towards $116.
WTI Technical Levels:
Resistance Levels
- $106 to $108 June 2022 Resistance (morning highs)
- $110 psychological level
- 2022 and Monday highs $116 to $120
- Ukraine War Spike $120 to $124
Support Levels
- $98 to $100 Momentum Pivot
- $96.64 4H 50-MA
- Pivotal Support $93.00 to $95
- $87 to $90 mini-Support
- $82.80 to $84 Key Support
- War flows Pivot $65.00 to $66.00
1H Chart and action levels
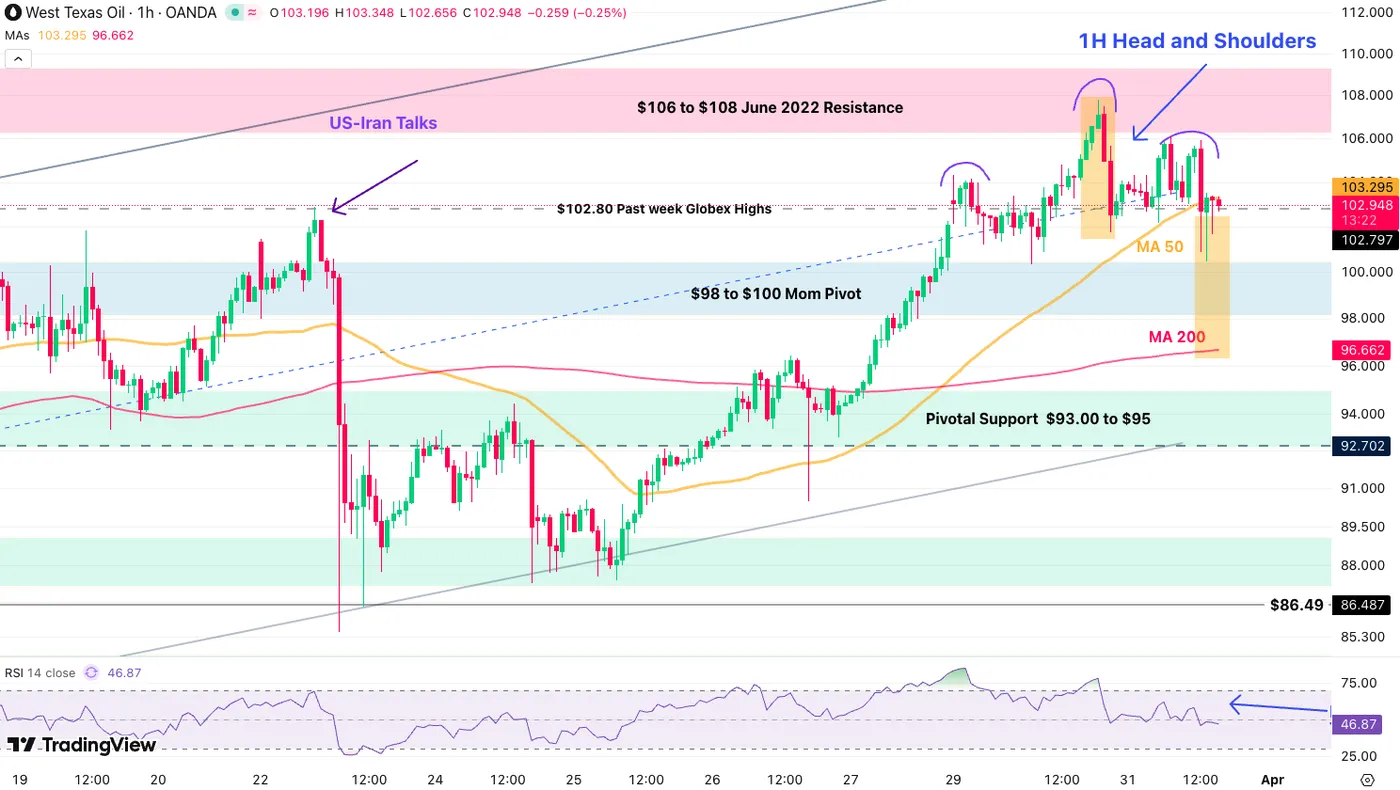
WTI Oil 1H Chart – March 31, 2026. Source: TradingView
The short-timeframe is more prone to fakeouts, particularly as headlines can quickly change the narrative, but for the most eager and impatient traders, a 1H Head and Shoulders pattern in arising, pointing towards $96.66 (200-Hour MA).
A rally back above $106 would void the technical pattern.
Safe Trades and keep your eyes on the news!
Gold (XAU/USD) Rallies 3%, Eyes Acceptance Above $4600/oz Handle for Bullish Momentum to Continue
- Gold (XAU/USD) prices have broken above the key $4,600/oz psychological barrier.
- Middle East tensions are escalating as diplomacy stalls and the US continues a military buildup, fueling market uncertainty.
- The rare negative correlation between Crude and Gold appears to be shifting, with rising Oil prices potentially benefiting Gold by compressing real interest rates and bringing back the "inflation hedge" narrative.
- Gold needs to find acceptance above the $4600/oz handle for bullish momentum to continue.
Gold prices have risen over the last two days to pierce above a key psychological barrier at the $4600/oz handle. The precious metal is eyeing acceptance above this level which could lead to further upside in the days ahead, if the geopolitical picture remains supportive.
Middle East Tensions: Diplomacy stalls as military buildup adds to market uncertainty
Hopes for a swift de-escalation in the Middle East have taken a hit as Iran signals a clear reluctance to engage in direct negotiations with the US. This friction is undermining what was already a fragile diplomatic process, leaving market participants wary of a prolonged standoff.
Iranian President Pezeshkian summed it up by saying Iran was attacked twice during the talks, proving the US does not believe in diplomacy. However, he followed this up by saying that Iran is ready to end the war, but wants guarantees. This mixed messaging is similar to what we have been seeing from the US administration as well.
Adding fuel to the fire, the US continues to deploy additional troops and military assets to the region. As uncertainty climbs, the focus remains firmly on how these developments will impact broader market sentiment and the demand for safe-haven assets.
Oil and Gold correlation shifts
Since the onset of the conflict in the Middle East, we have witnessed a rare and sustained negative correlation between Crude and Gold. Usually, these two move in tandem as hedges against geopolitical risk.
However, the recent spike in Oil prices forced a massive repricing of Fed expectations:
Rising Oil = Inflationary Pressure: As energy costs soared, markets were forced to price out previously anticipated Fed rate cuts.
Gold’s Sensitivity: With the "pivot" narrative delayed, Gold lost its luster as a non-yielding asset, leading to the sharpest decline in nearly two decades.
The tide may be turning. Over the last few sessions, we’ve seen Gold and Oil begin to rise at the same time, a signal that the negative correlation is changing.
With Fed funds futures now effectively ruling out further rate cuts, but the market remaining skeptical of additional hikes, we enter a new phase. If the Fed remains on hold while Oil continues to climb, inflation expectations will naturally rise. This scenario would lead to a compression in real interest rates (nominal rates minus inflation).
As long as the Fed remains sidelined and refuses to entertain further hikes, rising Oil prices may actually provide a tailwind for Gold by dragging real yields lower.
For gold bugs, the "inflation hedge" narrative might finally be back on the table.
Where to next?
The US dollar is still playing a role and with high impact US data ahead this week we could still see some volatility.
However, it is Easter this weekend and thus the closer to the weekend we get the greater the probability that we could see a thinning of liquidity and thus some sideways price action.
Market participants will still be keeping a close watch on the geopolitical developments in the Middle East and any changes to the situation could impact gold prices.
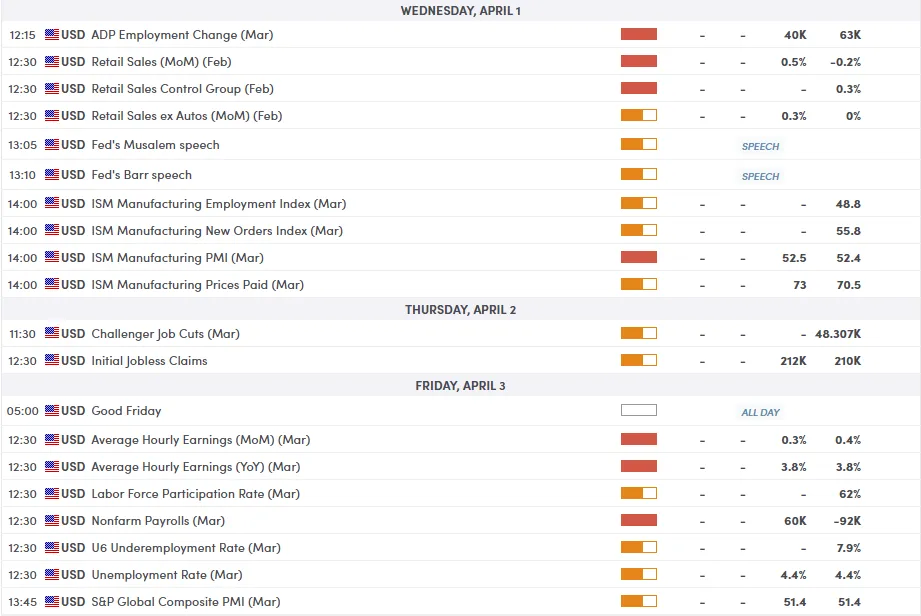
For all market-moving economic releases and events, see the MarketPulse Economic Calendar. (click to enlarge)
Technical Outlook - Gold (XAU/USD)
Gold (XAU/USD) is showing signs of a technical recovery on the H4 chart, successfully reclaiming the $4,600 handle.
After a period of aggressive selling, price action has established a solid ascending trendline, suggesting that the "buy the dip" mentality is returning to the market.
Key Levels to Watch:
- Resistance: The immediate hurdle sits at $4,700. A sustained break above this level could open the door for a retest of the $4,800 area.
- Support: The recent pivot at $4,500 remains a crucial psychological floor. As long as the ascending trendline holds, the bullish structure remains intact.
The RSI is currently hovering around 62, indicating that while momentum is positive, there is still room to run before hitting overbought territory. Bulls will be looking for a daily close above $4,600 to confirm this recovery phase.
Gold (XAU/USD) Four-Hour Chart, March 31, 2026
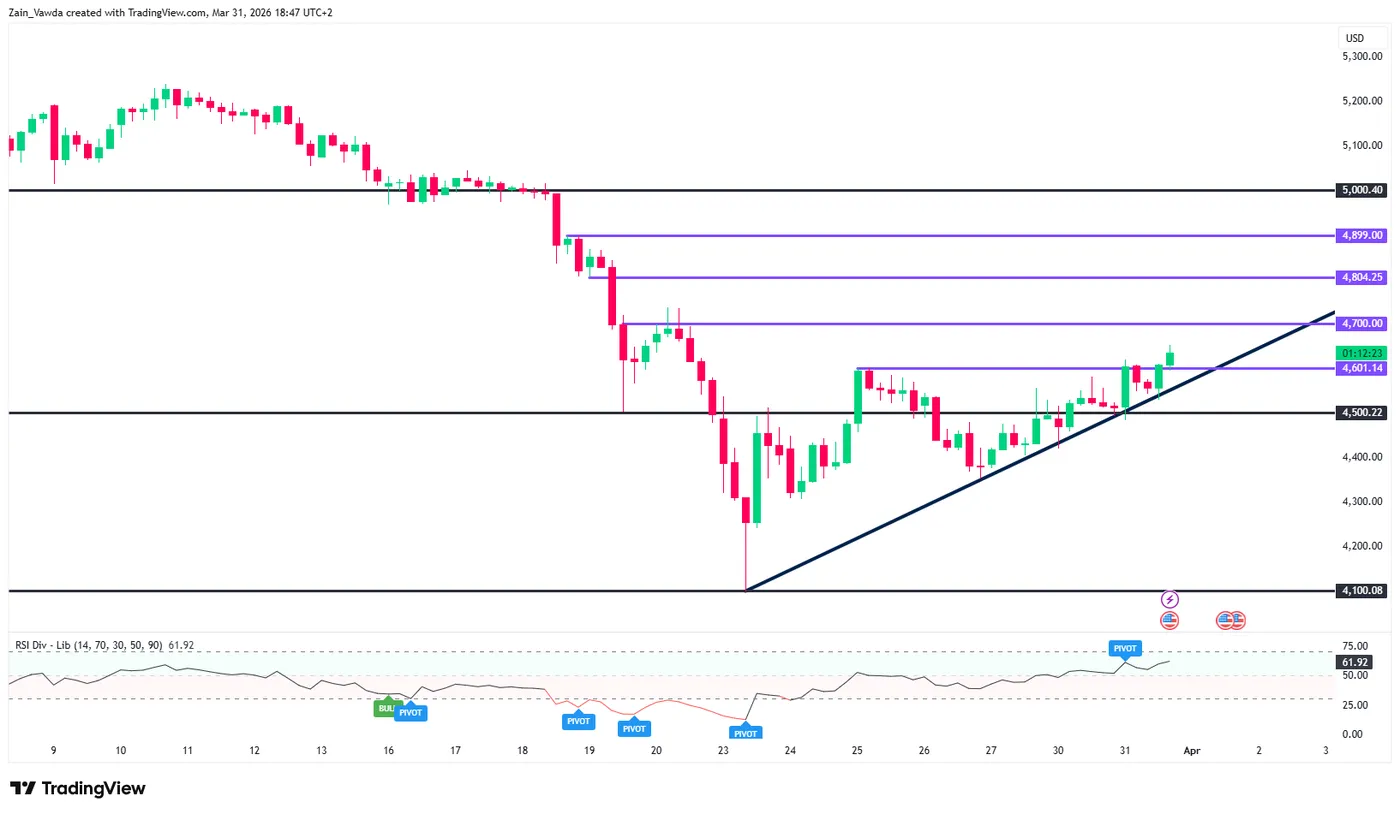
Source: TradingView (click to enlarge)
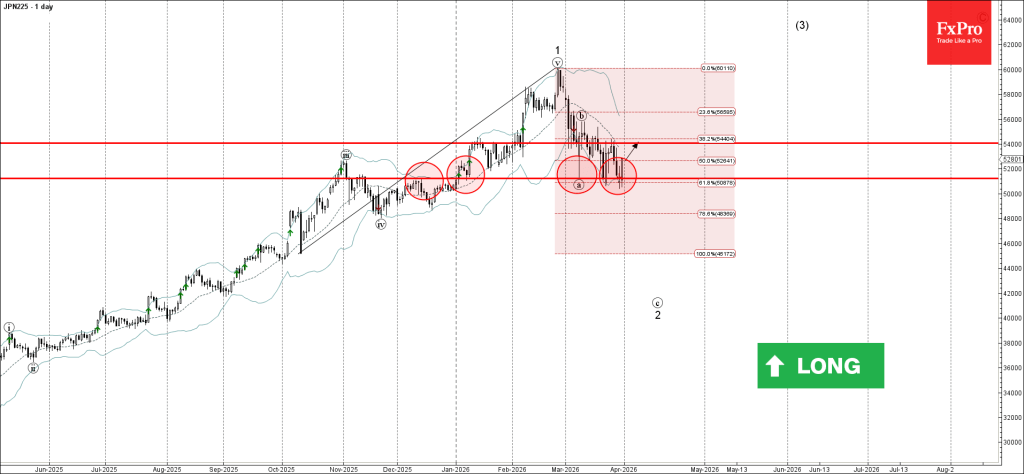
Nikkei 225 Wave Analysis
Nikkei 225: ⬆️ Buy
- Nikkei 225 reversed from support zone
- Likely to rise to resistance level 54000.00
Nikkei 225 recently reversed from the support zone between the pivotal support level 51235.00 (which has been reversing the price from January), lower daily Bollinger Band and the 61.8% Fibonacci correction of the upward impulse from October.
The upward reversal from this support zone is currently forming the daily Japanese candlesticks reversal pattern Morning Star – strong buy signal for Nikkei 225.
Given the long-term daily uptrend, Nikkei 225 can be expected to rise to the next resistance level 54000.00 (which has been reversing the price from the middle of March).
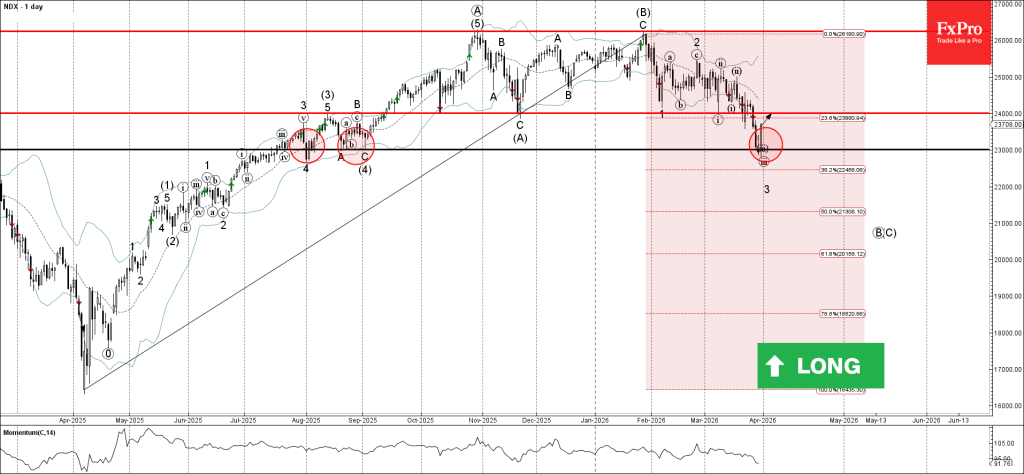
Nasdaq-100 Wave Analysis
Nasdaq-100: ⬆️ Buy
- Nasdaq-100 reversed from support level 23000.00
- Likely to rise to resistance level 24000.00
Nasdaq-100 index recently reversed from the support zone between the long-term support level 23000.00 (which has been reversing the price from August of 2025), lower daily Bollinger Band and the 38.2% Fibonacci correction of the upward impulse from last April.
The upward reversal from this support zone is currently forming the daily Japanese candlesticks reversal pattern Morning Star.
Nasdaq-100 index can be expected to rise to the next resistance level 24000.00 (former multi-month support from last September).
Eco Data 4/1/26
| GMT | Ccy | Events | Act | Cons | Prev | Rev |
|---|---|---|---|---|---|---|
| 23:50 | JPY | Tankan Large Manufacturing Index Q1 | 17 | 16 | 15 | 16 |
| 23:50 | JPY | Tankan Non - Manufacturing Index Q1 | 36 | 33 | 34 | 36 |
| 23:50 | JPY | Tankan Large All Industry Capex Q1 | 3.30% | 3.00% | 12.60% | |
| 00:30 | AUD | Building Permits M/M Feb | 29.70% | 6.20% | -7.20% | |
| 00:30 | JPY | Manufacturing PMI Mar F | 51.6 | 51.4 | 51.4 | |
| 01:45 | CNY | RatingDog Manufacturing PMI Mar | 50.8 | 51.8 | 52.1 | |
| 06:30 | CHF | Real Retail Sales Y/Y Feb | 0.90% | 0.90% | -1.10% | -0.60% |
| 07:30 | CHF | Manufacturing PMI Mar | 53.3 | 47.1 | 47.4 | |
| 07:50 | EUR | France Manufacturing PMI Mar F | 50 | 50.2 | 50.2 | |
| 07:55 | EUR | Germany Manufacturing PMI Mar F | 52.2 | 51.7 | 51.7 | |
| 08:00 | EUR | Eurozone Manufacturing PMI Mar F | 51.6 | 51.4 | 51.4 | |
| 08:30 | GBP | Manufacturing PMI Mar F | 51 | 51.4 | 51.4 | |
| 09:00 | EUR | Eurozone Unemployment Rate Feb | 6.20% | 6.10% | 6.10% | |
| 12:15 | USD | ADP Employment Change Mar | 62K | 42K | 63K | 66K |
| 12:30 | USD | Retail Sales M/M Feb | 0.60% | 0.40% | -0.20% | -0.10% |
| 12:30 | USD | Retail Sales ex Autos M/M Feb | 0.50% | 0.30% | 0.00% | |
| 13:30 | CAD | Manufacturing PMI Mar | 50 | 51 | ||
| 13:45 | USD | Manufacturing PMI Mar F | 52.3 | 52.4 | 52.4 | |
| 14:00 | USD | ISM Manufacturing PMI Mar | 52.7 | 52.3 | 52.4 | |
| 14:00 | USD | ISM Manufacturing Prices Paid Mar | 78.3 | 72.5 | 70.5 | |
| 14:00 | USD | ISM Manufacturing Employment Index Mar | 48.7 | 48.8 | ||
| 14:00 | USD | Business Inventories Jan | -0.10% | 0.20% | 0.10% | |
| 14:30 | USD | Crude Oil Inventories (Mar 27) | 5.5M | 2.0M | 6.9M |
| 23:50 | JPY |
| Tankan Large Manufacturing Index Q1 | |
| Actual | 17 |
| Consensus | 16 |
| Previous | 15 |
| Revised | 16 |
| 23:50 | JPY |
| Tankan Non - Manufacturing Index Q1 | |
| Actual | 36 |
| Consensus | 33 |
| Previous | 34 |
| Revised | 36 |
| 23:50 | JPY |
| Tankan Large All Industry Capex Q1 | |
| Actual | 3.30% |
| Consensus | 3.00% |
| Previous | 12.60% |
| 00:30 | AUD |
| Building Permits M/M Feb | |
| Actual | 29.70% |
| Consensus | 6.20% |
| Previous | -7.20% |
| 00:30 | JPY |
| Manufacturing PMI Mar F | |
| Actual | 51.6 |
| Consensus | 51.4 |
| Previous | 51.4 |
| 01:45 | CNY |
| RatingDog Manufacturing PMI Mar | |
| Actual | 50.8 |
| Consensus | 51.8 |
| Previous | 52.1 |
| 06:30 | CHF |
| Real Retail Sales Y/Y Feb | |
| Actual | 0.90% |
| Consensus | 0.90% |
| Previous | -1.10% |
| Revised | -0.60% |
| 07:30 | CHF |
| Manufacturing PMI Mar | |
| Actual | 53.3 |
| Consensus | 47.1 |
| Previous | 47.4 |
| 07:50 | EUR |
| France Manufacturing PMI Mar F | |
| Actual | 50 |
| Consensus | 50.2 |
| Previous | 50.2 |
| 07:55 | EUR |
| Germany Manufacturing PMI Mar F | |
| Actual | 52.2 |
| Consensus | 51.7 |
| Previous | 51.7 |
| 08:00 | EUR |
| Eurozone Manufacturing PMI Mar F | |
| Actual | 51.6 |
| Consensus | 51.4 |
| Previous | 51.4 |
| 08:30 | GBP |
| Manufacturing PMI Mar F | |
| Actual | 51 |
| Consensus | 51.4 |
| Previous | 51.4 |
| 09:00 | EUR |
| Eurozone Unemployment Rate Feb | |
| Actual | 6.20% |
| Consensus | 6.10% |
| Previous | 6.10% |
| 12:15 | USD |
| ADP Employment Change Mar | |
| Actual | 62K |
| Consensus | 42K |
| Previous | 63K |
| Revised | 66K |
| 12:30 | USD |
| Retail Sales M/M Feb | |
| Actual | 0.60% |
| Consensus | 0.40% |
| Previous | -0.20% |
| Revised | -0.10% |
| 12:30 | USD |
| Retail Sales ex Autos M/M Feb | |
| Actual | 0.50% |
| Consensus | 0.30% |
| Previous | 0.00% |
| 13:30 | CAD |
| Manufacturing PMI Mar | |
| Actual | 50 |
| Consensus | |
| Previous | 51 |
| 13:45 | USD |
| Manufacturing PMI Mar F | |
| Actual | 52.3 |
| Consensus | 52.4 |
| Previous | 52.4 |
| 14:00 | USD |
| ISM Manufacturing PMI Mar | |
| Actual | 52.7 |
| Consensus | 52.3 |
| Previous | 52.4 |
| 14:00 | USD |
| ISM Manufacturing Prices Paid Mar | |
| Actual | 78.3 |
| Consensus | 72.5 |
| Previous | 70.5 |
| 14:00 | USD |
| ISM Manufacturing Employment Index Mar | |
| Actual | 48.7 |
| Consensus | |
| Previous | 48.8 |
| 14:00 | USD |
| Business Inventories Jan | |
| Actual | -0.10% |
| Consensus | 0.20% |
| Previous | 0.10% |
| 14:30 | USD |
| Crude Oil Inventories (Mar 27) | |
| Actual | 5.5M |
| Consensus | 2.0M |
| Previous | 6.9M |
USD Double Top as Markets Slowly Price End of War – US Dollar Index (DXY) Outlook
- The US Dollar enjoyed a very consistent performance since the onset of the US-Iran conflict but now forms a double-top
- With Traders starting to price a resolution for the conflict, the Dollar could lose some steam, particularly at the top of its range
- US Dollar Index (DXY) in-depth Technical Analysis
Timing Markets is a difficult task, absolutely key to generating as much profit as possible from important fundamental setups.
It is indeed important to be timely with your trade to ensure that entries remain favorable and the risk-reward remains positive – but an essential part of timing is not being too early.
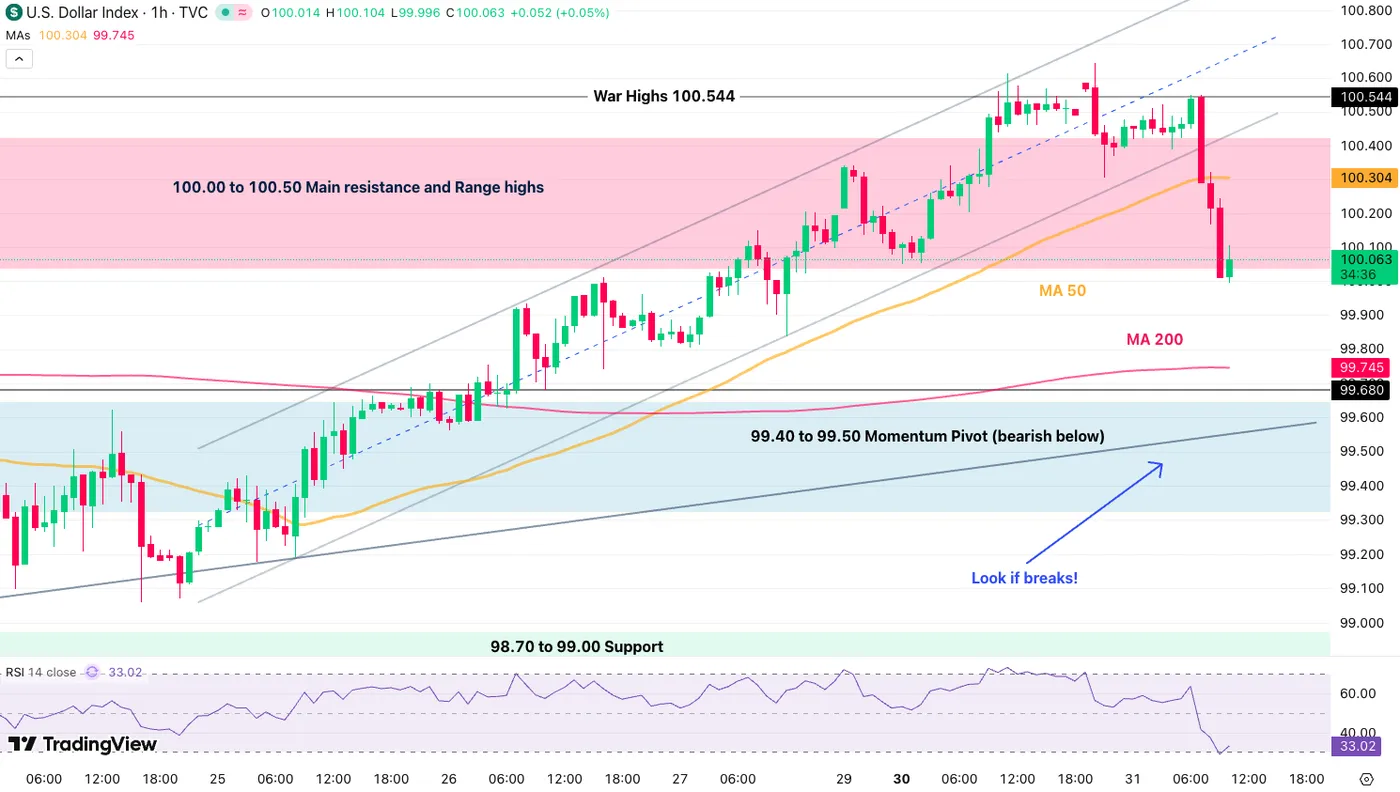
The US Dollar has been on a significant uptrend since the end of the January FOMC (as forecasted here) and is now testing the extremes of its gigantic 95.50-100.50 range.
This is where timing entries is a daunting task – one could just begin shorting the US Dollar as soon as it reaches its highs, but when double tops occur, they often come to get your stops.
That is when confirmation steps in to provide even more favorable entries and timing – It can be Fundamental, with a change in narrative (something that is kind of emerging as of late), or a confirmation in Technicals.
Sometimes it can actually be both, and this is what could now be offered in the US Dollar.
Nothing is sure in Markets, particularly during volatile periods when breaking news can change the entire picture in a matter of a few seconds – but at least, some setups can look better than others.
As we speak, the US Dollar is rejecting its War highs for the third consecutive test, forming a Double Top – Both the US and Israel are slowly looking to turn the page on the full month of operations, particularly with the Trump Administration considering ending the conflict without taking control of the Strait of Hormuz to punish against European and Asia allies that did not manifest their appetite for such operations (and even went against it, like Spain).
The reversal, if it does arrive, may not unfold in one session but progressive waves as the narrative slowly switches.
Crude Oil prices still dictate general Market flows, so its drop will have to be the extra confirmation signal.
We’ll explore a few scenarios for a potential large reversal in an in-depth technical analysis of DXY.
Dollar Index (DXY) Multi-Timeframe Analysis
Daily Chart
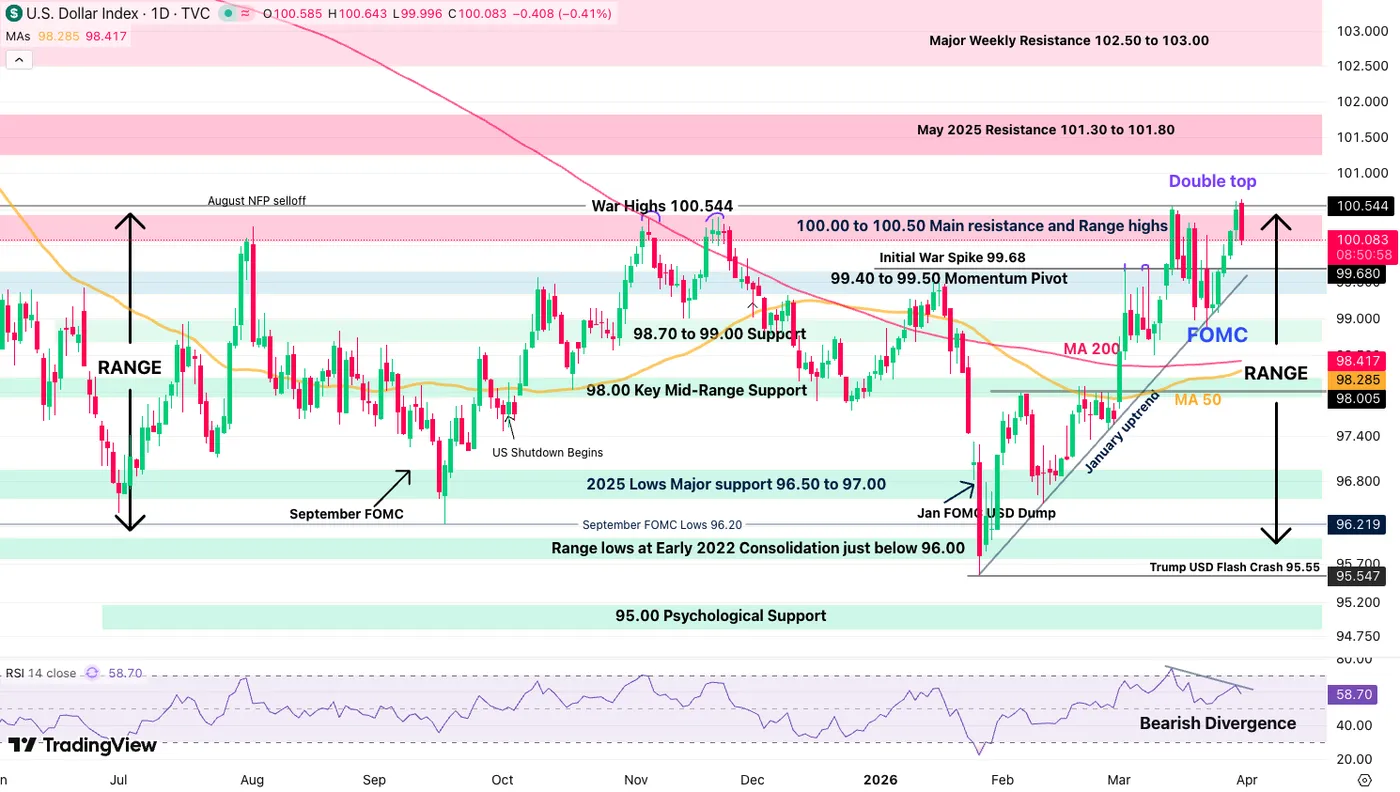
Dollar Index (DXY) Daily Chart. March 31, 2026 – Source: TradingView
While headline chasers are getting fooled by the latest dedollarization and end of the World narrative, as traders it is essential to take a step back, mute the noise, and see if any real trend is emerging to avoid falling into Confirmation Bias loops and miss on significant opportunities.
For example, the same happened after the pre-FOMC Trump-led US Dollar flash-crash, where the world of Finance could have swore as a whole that the USD was finished.
Yet here we are at 6-month highs. The significant range established after the July 2025 TACO Dollar lows is still holding (despite having wicked above and below).
Now reacting at its highs, it will be interesting to see if a downside reversal occurs from here, particularly after the double top and a Daily RSI bearish divergence.
4H Chart and Technical Levels
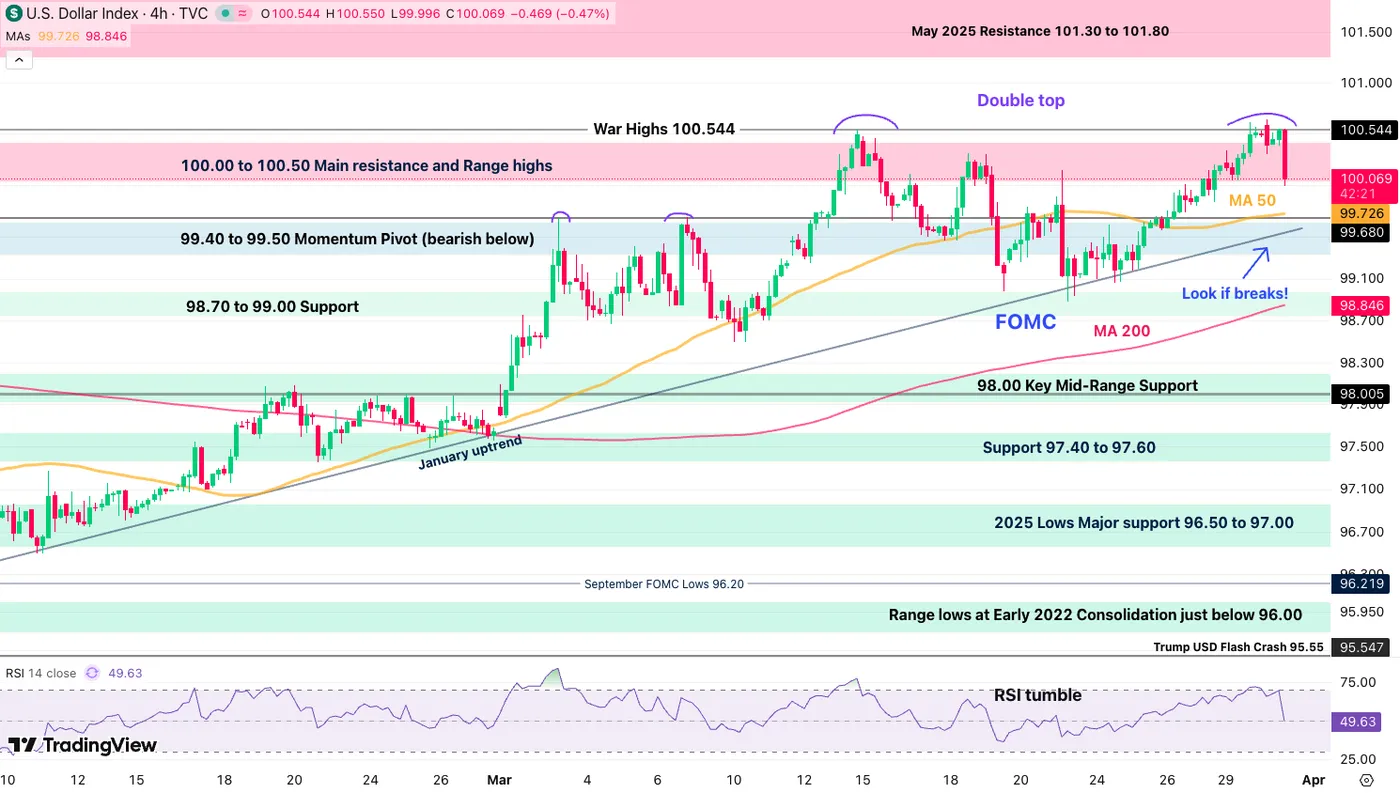
Dollar Index (DXY) 4H Chart. March 31, 2026 – Source: TradingView
The Dollar is officially rejecting its 100.50 War highs, forming the famous double top, with momentum quickly shifting.
As long as prices remain within the 100.00 to 100.50 Zone, the action is more balanced than bearish, hence it could be a decent time to look around Markets for interesting setups – Two elements to look for are:
- Are buyers returning at short-term support levels ?(4H 50-MA & January Uptrend ~ 99.70)
- If they don't, what is the most optimal FX pair to trade to capture the potential reversal?
- In that event, look for trades expressing this view in other FX pairs (AUD/USD, USD/JPY, USD/CAD?)
- And don't forget that such reversal don't occur in one swift move! They also have pullbacks and more.
Levels to place on your DXY charts:
Resistance Levels
- 100.00 to 100.50 Main resistance and Range highs
- War Highs 100.544 (Double Top)
- May 2025 Resistance 101.30 to 101.80
- Major Weekly Resistance 102.50 to 103.00
Support Levels
- 99.70 mini-support
- 99.40 to 99.50 Momentum Pivot (bearish below)
- 98.70 to 99.00 Support
- 98.00 Key Mid-Range Support
- Support 97.40 to 97.60
- 2025 Lows Major support 96.50 to 97.00
1H Chart
Dollar Index (DXY) 1H Chart. March 31, 2026 – Source: TradingView
The US Dollar is now slightly mean-reverting after quickly reaching oversold 1H RSI levels – look for a small retracement for entries on Major FX pairs.
Psychological levels tend to attract decent reactions in FX, returning to the 50-hour MA (100.30) would provide an optimal short-USD setup, as long as the narrative doesn't switch again and the war drags on for much longer.
To void the short-setup, watch if bulls manage to drag the Dollar above 100.55 and close above it on the daily.
Safe Trades!
US Consumer Confidence Rises Modestly to 91.8 as Present Conditions Improve, Inflation Fears Surge
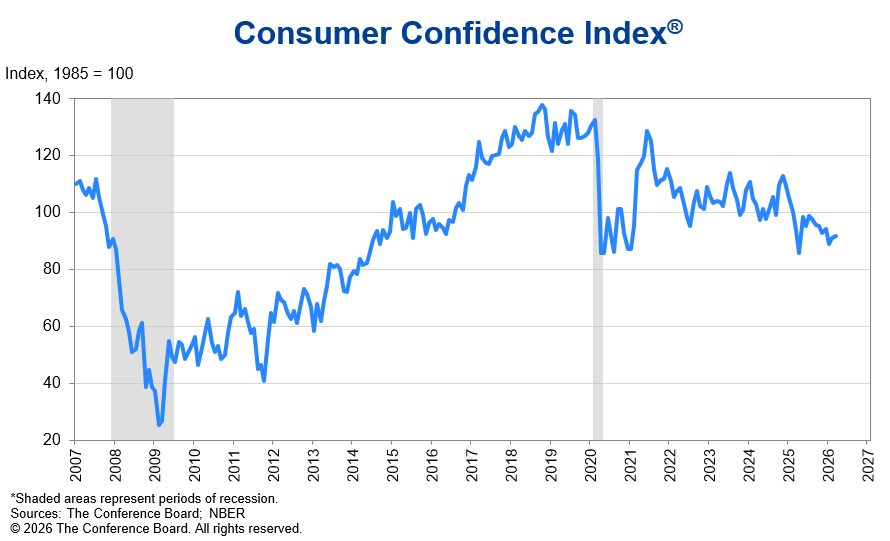
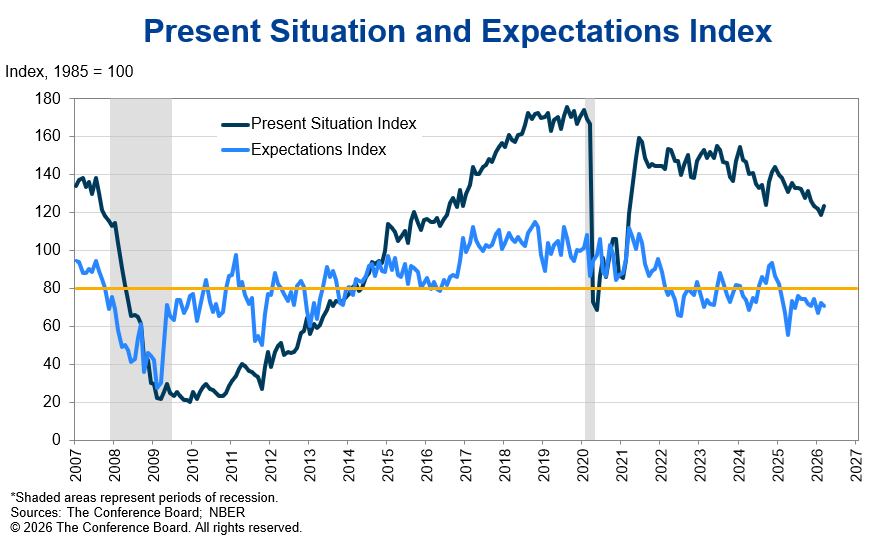
US consumer confidence edged higher in March, with the Conference Board index rising from 91.0 to 91.8, beating expectations of 88.3. The improvement was driven by a stronger assessment of current conditions, with the Present Situation Index jumping from the previous month by 4.6 points to 123.3. However, the forward-looking picture deteriorated. The Expectations Index fell from 72.6 to 70.9, remaining below the 80 threshold typically associated with recession signals.
The divergence highlights a consumer base that sees current conditions as stable but remains increasingly cautious about the outlook, particularly as geopolitical risks and rising costs weigh on sentiment.
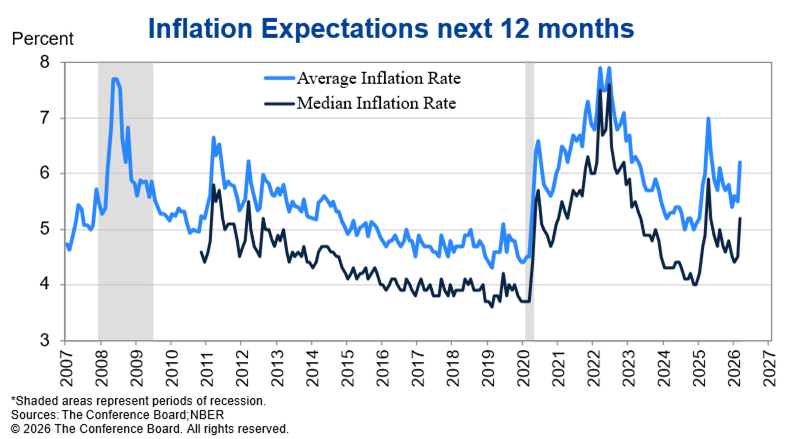
Inflation concerns are clearly re-emerging as a dominant theme. Survey responses showed heightened worries about the cost of living, with mentions of oil, gas, and war rising sharply alongside the Iran conflict. Consumers’ 12-month inflation expectations surged to levels last seen in August 2025, while expectations for higher interest rates jumped markedly, from 34.9% to 42.4%.
Sunset Market Commentary
Markets
Stock markets drew some minor comfort from the Wall Street Journal story. European equities rose another 0.8%, pulling the likes of the EuroStoxx50 away from key support areas around 5500. Main US indices add around 1%. The US business newspaper citing administration officials said that US president Trump is considering to exit the Iran war even if the Straight of Hormuz remains largely blocked. It’s another U-turn in tone which, just yesterday, was all about bombing plants, stealing uranium and sending more troops to the region. Meanwhile headlines hit the screen of a US-Israeli attacking desalination plants on the Qeshm island located near the Strait. We’d take it with a grain of salt. Brent does so to with the price of a barrel of oil holding well above the triple digits. That’s not enough to completely derail economies but materially higher than one month ago and destined to inject strong upward price pressures. While at the matter, European CPI captured the first impact of the energy price shock with the March print matching our inhouse nowcast of 2.5% y/y on a headline basis, up from 1.9%. Monthly prices rose a strong 1.2%, strongly lifted by a 6.8% m/m energy price rally. Core inflation eased to 2.3% from 2.4% while services CPI decelerated to 3.2% from 3.4%. That does little to ECB market expectations though. There’s still a cumulative 70bps+ in rate hikes priced in for this year with a 50-50 chance for a first move next month. ECB’s Muller said he cannot rule out such a scenario while Radev sees external shocks feeding into price expectations, perhaps referring to worrying signals coming from yesterday’s EC’s Economic Sentiment Indicator. German bund yields by and large ignored the CPI outcome and whipsawed to currently trade slightly lower at the long end of the curve (+/- 2 bps). USTs outperform, sending rates between 2.4 and 5 bps lower. An improved risk environment and having interest rate differentials working against, the US dollar loses out against most global peers. The trade-weighted DXY’s test of key resistance around 100.5 failed and prompted return action lower. EUR/USD bounced back to north of 1.15. Even JPY gets some respite, allowing USD/JPY to drift lower to 159.3.
News & Views
Polish consumer prices rose by 1% M/M and 3% Y/Y in March (vs 2.1% Y/Y last month). The rise was mainly due to fuel prices rising 15.4% M/M and 8.5% Y/Y. Electricity, gas and other fuel prices declined 0.1% M/M with yearly inflation holding at 3.9%. Food price inflation was flat on a monthly basis and 2% Y/Y. The National Bank of Poland (NBP) targets inflation of 2.5% ( +/- 1%pt tolerance). The NBP cut its policy rate by 25 bps at the March 4 meeting based on a further easing of inflation in at the start of the year and favourable new (inflation) forecasts available at the time. In first comments from NBP MPC members since the conflict in the Middle East mostly were reluctant at guiding for interest rate hikes anytime soon. Markets currently err to hikes in the second half of the year. The zloty weakened from near EUR/PLN 4.22 to test the 4.30 area at the early stages of the war in the Middle East. At EUR/PLN 4.29, an orderly correcting zloty now trades at the weaker side of the EUR/PLN 4.25/4.30 range that guided trading over the previous three weeks.
Riksbank (RB) governor Eric Thedeen today commented on the recent developments. At the March 19 meeting, the RB held the forecast for the policy rate to stay at 1.75% this year. As the war in the Middle East continues, Thedeen sees the economic consequences to be ‘more extensive and protracted’. Monetary policy cannot prevent energy prices from rising but the RB wants to avoid them from spreading. “One insight from recent years is that it is risky for a central bank to assume that it is possible to see through supply shocks. If the risks of spillover effects and persistently higher inflation increase, we may need to tighten monetary policy”, Thedeen assesses. However, for now, the RB governor assumes RB can take a wait-and-see approach as inflation is relatively low to start with. February CPIF and CPIF ex energy inflation were respectively 1.7% Y/Y and 1.4% Y/Y. Markets see only a limited (< 20%) chance on an RB rate hike in May. A 25 bps (+) step is only discounted by August. After a protracted rise against euro from November to early February (EUR/SEK 10.50 best since august 2022), the krone retreated. In February markets still saw a chance for the RB to cut the policy rate even further. In March, this was reversed, but the RB is still seen lagging the likes of the ECB when it comes to addressing inflationary risks. EUR/SEK currently trades near 11.95.