Sample Category Title
USD/CHF Daily Outlook
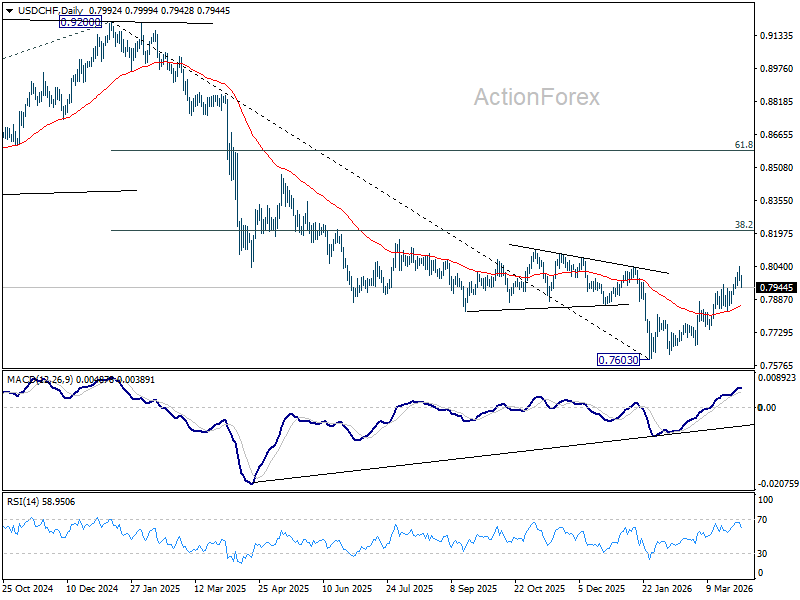
Daily Pivots: (S1) 0.7964; (P) 0.8004; (R1) 0.8033; More….
A temporary top is formed at 0.8041 with current retreat, and intraday bias in USD/CHF is turned neutral first. On the upside, break of 0.8041 will resume the whole rally from 0.7603, and target 38.2% retracement of 0.9200 to 0.7603 at 0.8213. However, decisive break of 0.7833 support will argue that the rebound has completed, and turn bias back to the downside for deeper fall.
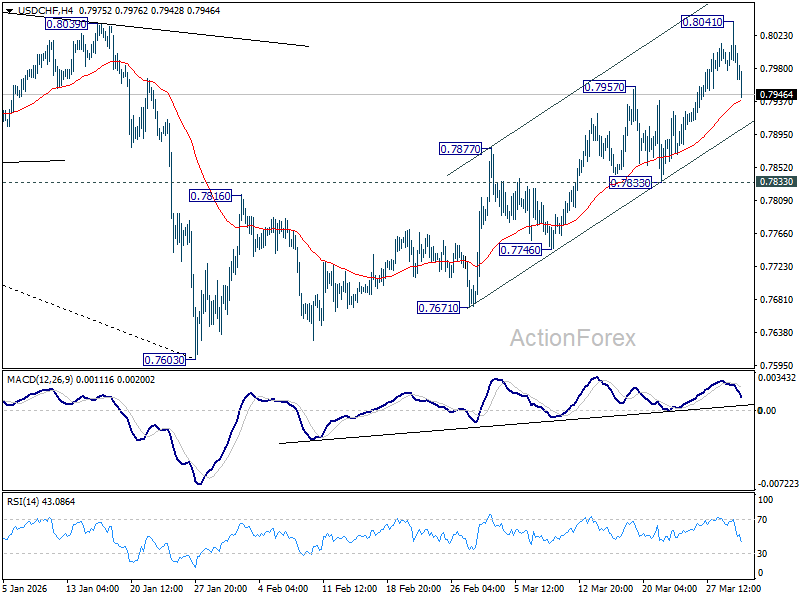
In the bigger picture, a medium term bottom should be in place at 0.7603 on bullish convergence condition in D MACD. Rebound from there is seen as correcting the fall from 0.9200 only. However, decisive break of 55 W EMA (now at 0.8088) will suggest that it's probably correcting the larger scale down trend from 1.0146 (2022 high). On the other hand, rejection by the 55 W EMA will setup down trend resumption to 100% projection of 1.0146 (2022 high) to 0.8332 from 0.9200 at 0.7382 at a later stage.
USD/CAD Daily Outlook
Daily Pivots: (S1) 1.3891; (P) 1.3929; (R1) 1.3952; More...
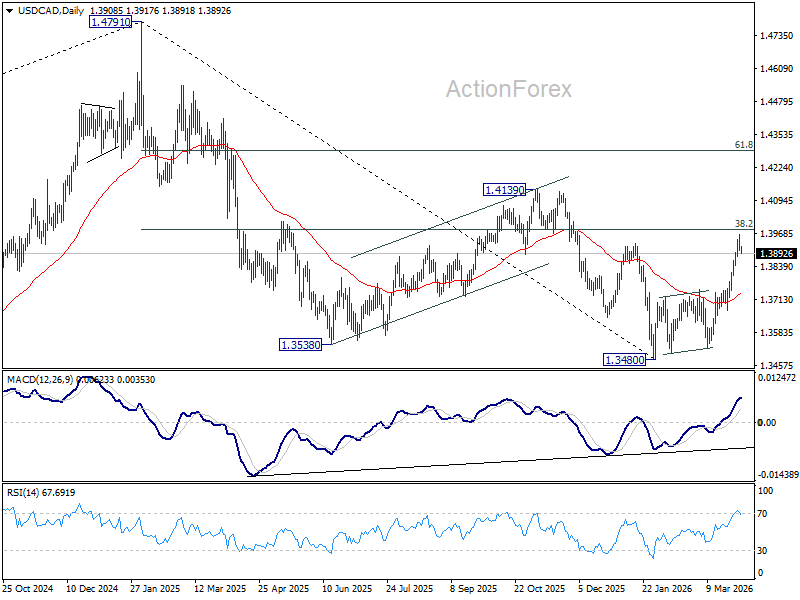
A temporary top is in place at 1.3965 in USD/CAD and intraday bias is turned neutral first. On the upside, decisive break of 38.2% retracement of 1.4791 to 1.3480 at 1.3981 will argue that it's already reversing the whole down trend from 1.4791, and target 61.8% retracement at 1.4290. However, firm break of 1.3751 should indicate rejection by 1.3981, and keep the fall from 1.4791 intact. Bias will be back on the downside for retesting 1.3480 low.
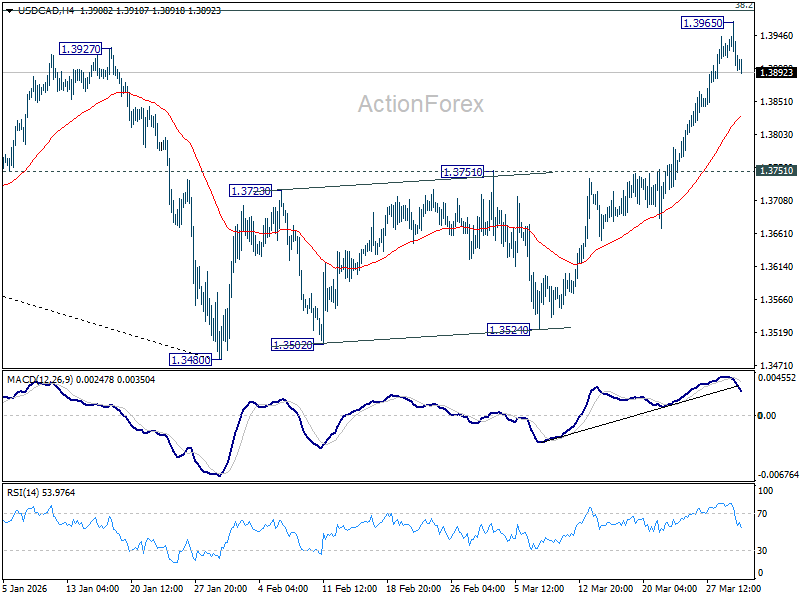
In the bigger picture, price actions from 1.4791 are seen as a corrective pattern to the whole up trend from 1.2005 (2021 low). Deeper fall could be seen, as the pattern extends, to 61.8% retracement of 1.2005 to 1.4791 at 1.3069. However, decisive break of 1.3927 resistance will argue that the correction has completed with three waves down to 1.3480 already. Further break of 1.4139 will confirm and bring retest of 1.4791 high.
Bank of Japan’s Quarterly Tankan Business Survey Comes in Strong Again
Markets
US markets rebounded at the start of trading on a WSJ report that president Trump was willing to end the war without reopening the Strait of Hormuz. He later indicated that the US will be leaving in 2-3 weeks with Defense Secretary Hegseth saying that the coming days of the conflict would be decisive. Trump will also deliver a speech tonight (9pm ET; 3am CET tomorrow) to give an important update on Iran. Yesterday’s risk rally only hit full pace after European close after the Iranian news agency (IRNA) reported that Iran’s president signaled readiness to end the war. He simultaneously reiterated Iran’s demands which haven’t changed from last week. They seek a complete halt of US/Israeli attacks on the country and against groups it back throughout the Middle East, pledges that history won’t repeat itself, war payments and reparations and sovereign right to exercise authority over the Strait of Hormuz. Yesterday’s risk rally pulled key US equity indices off the sell-off lows to rebound 2.5% (Dow) to 3.8% (Nasdaq) higher. US Treasuries recovered with the front and belly of the curve outperforming. US yields declined by up to 4.2 bps at the 5-yr tenor. US money markets now again err on the side of a Fed rate cut as a next move, attaching a 50% probability to such a scenario by year-end. From a data perspective, US consumer confidence (conference board) inched up in March as a modest improvement in consumers’ views of current conditions outweighed a slight downshift in expectations for the future. Consumers’ average (>6%) and median (>5%) 12-month inflation expectations surged in March to levels last seen in August 2025. The JOLTS job openings report printed near consensus with job openings again falling below 7mn. The German yield curve bull flattened with yields sliding by 0.5 bps (2-yr) to 4.6 bps (30-yr). Eurozone inflation accelerated to 1.2% M/M in March with the energy component up 6.8% M/M. The pace of core inflation stabilized at 0.8% (2.3% Y/Y from 2.4%). On an annual level, headline CPI rose from 1.9% to 2.5% with our in-house KBC Nowcast suggesting a further increase to 2.9% Y/Y in April. Depending on the evolution of the conflict, we might already hit 3%. On FX markets, the dollar sold off in yesterday’s risk rally with EUR/USD rebounding from the 1.1450 area towards 1.1550. Brent crude prices (June contract) fell from $107/b to $103/b after the Iranian president headlines. Today’s eco calendar contains (March) US ADP employment change, retail sales and manufacturing ISM, but the numbers will again be overshadowed by the developing narrative on the war in the Middle East. Asian stock markets join the risk rally this morning, but Brent crude currently treads water at the $103 level.
News & Views
The Bank of Japan’s quarterly Tankan business survey came in strong again. Sentiment among large manufacturers (17) improved to a four year peak while the sector’s outlook stabilized near the post-pandemic highs. Current conditions in the non-manufacturing segment (36) weren’t this benign in 35 (!) years. Its future looked bright too with the indicator only marginally retreating from 2025Q4 multidecade high (29). The image for small(er) companies looked similar. Price indicators picked up, hinting once again at growing inflationary pressures. Input pressures rose more than output, (partially) capturing the rising energy prices following the Iran war. But excluding the 2021-2022 inflation surge, the output price indicator is trading at its highest since the 1980s. Expectations for inflation in five years rose to 2.5%, another record. Meanwhile preliminary results of the shunto wage negotiations by the Japan’s largest union (Rengo) point at increases above the 5% mark for a third consecutive year. This combination makes an April rate hike by the Bank of Japan a near-certainty. Such a scenario is priced in for about 70% in money markets. The Japanese yen shrugged with upcoming rate support doing little to lift it. USD/JPY is trading more or less unchanged from yesterday’s close around 158.8.
Greece secured another milestone in its recovery from a debt crisis that nearly pushed the country out of the eurozone more than a decade ago. (Equity) index provider MSCI has upgraded Greece to a developed-market status from emerging market, reflecting “both the progress achieved by the Greek market authorities and the evolving view among global institutional investors that Developed Markets Europe operates as a cohesive investment region.” The win is a rather symbolic one that not necessarily would attract huge capital flows since other index providers already upgraded Greece last year. But it adds to Greece’s resurrection story, which also included upgrades to its sovereign debt market back to investment grade.
Tech Like It’s 2019
Hope that the Iran war could end soon fuelled optimism yesterday after Trump announced willingness to pull back, and Iran State News reported a phone call between a EU councillor and Iran President suggesting ‘necessary will to end the war’ if guarantees are met.
S&P500 rallied 2.91%, Nasdaq soared 3.83%. Oil pulled back. Kospi skyrocketed 8% in Asia.
The US dollar fell sharply too, also pulled lower by a series of comments and data releases.
- Federal Reserve (Fed) Chair Jerome Powell said a day earlier that, despite rising oil and gas prices, long-term inflation expectations remained “in check,” and that oil shocks tend to come and go. By the time rate hikes would take effect, the oil price shock would be “probably long gone,” and tighter monetary conditions would be “weighing on the economy at a time when it’s not appropriate.” In short, he pushed back on expectations that the Fed would raise rates to fight energy shock led short term inflation.
- The EURUSD rebounded following a set of euro area CPI updates confirming that the Middle East war had led to a notable jump in inflation. March preliminary data came in slightly lower than analysts had penciled in, but headline inflation rose 1.2% over the month, pushing the yearly figure to 2.5%, up from 1.9% printed before the war. Energy prices rose 4.9%. Core inflation slightly eased from 2.4% to 2.3%, but the impact of higher energy prices will push inflation away from the European Central Bank’s (ECB) 2% policy target, potentially forcing policymakers to adopt a tighter monetary policy.
- US job openings came in softer than expected (data for February). The chances are that the labour market may have slowed further in March due to the negative impact of higher oil prices on activity.
So, the combination of more hawkish ECB pricing versus a more dovish Fed outlook sent the EURUSD all the way up to 1.1578. As discussed earlier, the ECB/Fed rate outlook differential could put a floor under the EURUSD’s decline since the end of January. For the rebound to be sustainable, however, oil and gas prices should stabilize. Otherwise, growth risks to the euro area economy—a net energy importer—will remain higher than growth risks to the US economy—a net energy exporter—which could justify a deeper downside correction in the EURUSD.
Technically, the EURUSD remains in the bullish trend built since the beginning of 2025. Key support for this trend sits near 1.1350, the major 38.2% Fibonacci retracement of the 2025-to-date rally. Only a slide below this level would open the discussion on whether the US dollar deserves to return to a broader, medium-term bullish trend.
Again, the answer depends on the duration of Middle East tensions and oil prices. Crude oil eased 3% yesterday, helping the US dollar soften on top of economic data and central bank expectations, while Brent crude fell more than 5%.
The decline could be partly attributed to Donald Trump telling aides that the US will stop its campaign against Iran even if the Strait of Hormuz remains closed. However, a few hours earlier, he had threatened to invade Kharg Island and seize Iranian oil. In the current conditions, volatility is almost inevitable.
Both WTI and Brent push higher this morning.
As a rule of thumb, a sustainable move into the $90–100 per barrel range could help investors digest the energy shock and seek new catalysts and direction across FX and equities. Many warn that prolonged supply disruptions in the Strait of Hormuz—through which 20% of global oil and 20-25% of gas flows transit—could trigger “demand destruction,” meaning prices rise enough to force companies and consumers to reduce usage, hitting economic activity.
That is why the $120–130 per barrel range is probably the top range for crude prices. Above this, falling demand would likely pull prices lower, while in the longer run, more affordable levels would ideally be $80 per barrel or below.
Interestingly, if you looked at US market price action yesterday, you could hardly guess how uncertain the geopolitical and macroeconomic backdrop is. The S&P500 rallied 2.9% on a sharp decline in US yields—the 2-year yield, which best captures Fed rate expectations, fell 8 basis points yesterday and nearly 20bp from last Friday’s peak above 4%.
This is positive if you isolate the impact of higher oil prices on operating costs and profit margins. Forward EPS continues to rise as investors look past rising energy prices, and falling valuations from the recent market drop are whetting appetites, especially for tech stocks. The tech-heavy Nasdaq 100 trades at 21x estimated earnings, just under 2 points above the S&P500’s. The last time this valuation gap was so narrow was 2019.
Moving forward, all eyes will be on the next earnings season and the impact of the Iran war and higher energy prices across industries. Tech hasn’t been a great place to hide in this latest oil shock—rising crude linked to the Iran war has pushed inflation expectations higher, driven yields up and hit long-duration tech valuations. But the underlying story hasn’t broken: AI demand remains strong, AI spending is massive and fundamentals across mega-cap tech are holding up. If geopolitical tensions ease and rates stabilize, the sector—now relatively cheap—could be one of the first to rebound.
There are even reports that OpenAI may allow investors to gain exposure ahead of a potential IPO later this year, by including its shares in several ETFs—among them funds from Cathie Wood’s ARK Invest.
Let’s hope calm returns soon, then!
Also, note that I will be out of the office until April 20. Wishing you a very Happy Easter!
US Private Payrolls to Signal March Hiring Trends Ahead of Friday’s NFP
In focus rest of the week
In the US, the ADP private sector employment report and ISM manufacturing data for March are set to be released. February's ADP report showed a gain of 63k private sector jobs. Weekly data highlighted a recovery, with employers adding an average of 10k jobs per week through early March. However, this momentum weakened towards the end of the period, indicating a potential slowdown in job growth. Meanwhile, February's ISM manufacturing report revealed a sharp rise in the prices index to 70.5, the highest since June 2022, driven by increased imports amid stagnant domestic production. For March, it will be interesting to see if the ISM data reflects any effects of the Iran conflict, particularly regarding rising input costs.
We again have speeches from ECB (Cipollone) and Federal Reserve (Barr and Musakem)
Today's Swedish PMI for March will be the first indicator to reflect the impact of the US-Israel-Iran war, as the NIER-indicator was collected too early. Last month's strong PMI at 56.1 highlighted robust production and employment. For March, focus will be on the price component, following increases seen in preliminary euro area, UK, and US data.
On Friday, key US labour market data will be released. We project non-farm payroll growth at +30k, below consensus, with the unemployment rate rising to 4.5% and average hourly earnings increasing by +0.3% m/m SA. Recent indicators, including declines in daily job postings and weekly private sector employment growth, point to a softer labour market.
Economic and market news
What happened overnight
US-Iran tensions remain high despite signs of possible de-escalation. President Trump signalled a possible end to the US-Iran war within weeks, stating the US could leave without a formal deal, while Secretary of State Rubio hinted at potential talks with Tehran. Iran's president expressed readiness to halt fighting if assured of no further attacks, though its foreign minister warned of prolonged conflict. Asian markets rallied on hopes of de-escalation as questions remain over Washington's strategy. Wednesday night, Trump will address the nation regarding Iran.
Japan's Q1 Tankan survey revealed a rise in large manufacturers' sentiment to its highest level since Q4 2021, reflecting resilience in the sector despite challenges like rising energy costs and a weaker yen. Sentiment among large non-manufacturers held steady signalling stability in services. However, record corporate inflation expectations and surging fuel costs from the Iran war raise risks. Markets may focus on whether these factors push the Bank of Japan towards a rate hike at its upcoming meeting.
In China, RatingDog PMI fell to 50.8 in March from February's 52.1, missing forecasts of 51.6. While growth continued for a fourth month, expansion slowed, with export orders decelerating. Input costs rose at their fastest rate since March 2022, and output prices surged, driven by Middle East tensions, highlighting mounting inflationary pressures despite steady production and new orders.
What happened yesterday
In the euro area, March HICP inflation rose to 2.5% y/y, slightly below the expected 2.6% but up from 1.9% in February. Core inflation aligned with expectations at 2.3% y/y. The increase was driven entirely by energy inflation, which surged 6.8% m/m, the second-largest rise since March 2022. No war-related effects were visible in other components. While the report is less concerning than feared, giving the ECB some more time to "wait and see", energy prices continue to rise. The ECB is likely to focus on April's inflation data and forward-looking indicators before deciding on policy changes.
Meanwhile, the EU Energy Commissioner has urged member states to prepare for prolonged disruptions in jet fuel and diesel supplies, calling for coordinated actions to stabilise energy prices and address inflationary risks.
In the ECB space, officials Muller, Panetta and Rehn highlighted inflationary risks and the potential for monetary policy adjustments in response to the Iran conflict and elevated energy prices. Muller indicated that interest rates are likely to rise in the coming quarters, questioning the ECB's 2026 inflation forecast of 2.6% as overly optimistic. Panetta stressed the need to prevent a wage-price spiral and ensure monetary policy remains proportionate. Rehn, however, struck a cautious tone, stating that a rate hike is not guaranteed and that decisions will be made on a meeting-by-meeting basis, with a focus on the medium-term inflation outlook. All emphasised vigilance against second-round effects, as euro-area inflation reached 2.5% in March.
In the US, JOLTS job openings dropped to 6.882m in February, below the consensus of 6.918m, while January was revised upwards to 7.24m. The job openings-to-unemployment ratio fell to 0.9, signalling weaker wage growth in the next six months as workers' bargaining power diminishes. Hiring slowed, while involuntary layoffs edged higher, offering overall dovish signals for the Fed. Meanwhile, the Conference Board's March consumer sentiment unexpectedly improved, driven by a stronger assessment of the current situation. However, future expectations weakened as average inflation expectations rose to 6.2% from 5.5%, reflecting recent fluctuations in petrol prices.
In the Fed space, Kansas City's Schmid warned that rising energy prices could have a lasting impact on inflation, already near 3% before the Iran war. He stressed the need for policy measures to anchor expectations, highlighting risks to both headline and core inflation. While growth impacts may be modest, Schmid's focus on inflation aligns with speculation about potential rate hikes, contrasting with other officials' cautious approach.
In Sweden, Riksbank's Per Jansson reaffirmed his comments from the Minutes, noting that low inflationary pressures provide room to tolerate modest increases without risking excessive inflation. He emphasised the importance of avoiding premature actions or falling behind the curve. His neutral stance contrasts with Thedeen and Seim's hawkish bias, underscoring the flexibility of the mildly expansionary policy rate for potential adjustments.
Equities: Global equities were significantly higher yesterday rising 2.3%, led by the US indices with 83% of the names in the S&P500 up. S&P500 rose 2.9%, Nasdaq +3.8%, Russell2000 +3.4% and Stoxx600 +0.4%, with the latter seen in context of outperformance on Monday. Mag7 outperformed the 493, rising 4.5% and 2.2% respectively. Only the Energy and Utilities sectors declined yesterday. The positive sentiment carried into the Asian session and the futures.
FI and FX: While quarter-end flows set the tone during yesterday's European session the renewed optimism wrt. a possible end to the Iran war has been the dominant driver in both FI and FX markets in the last 12 hours. Yields are lower across the board in both the long- and short-end of curves while CEEs, ZAR and SEK have been the outperformers in FX. Energy prices have moved considerably lower and EUR/USD is now back above the 1.15-level.
Please note that due to the Easter holidays the next edition of the Danske Morning Mail will be distributed on Tuesday, 7 April.
AUD/USD Daily Report
Daily Pivots: (S1) 0.6854; (P) 0.0.6879; (R1) 0.6926; More...
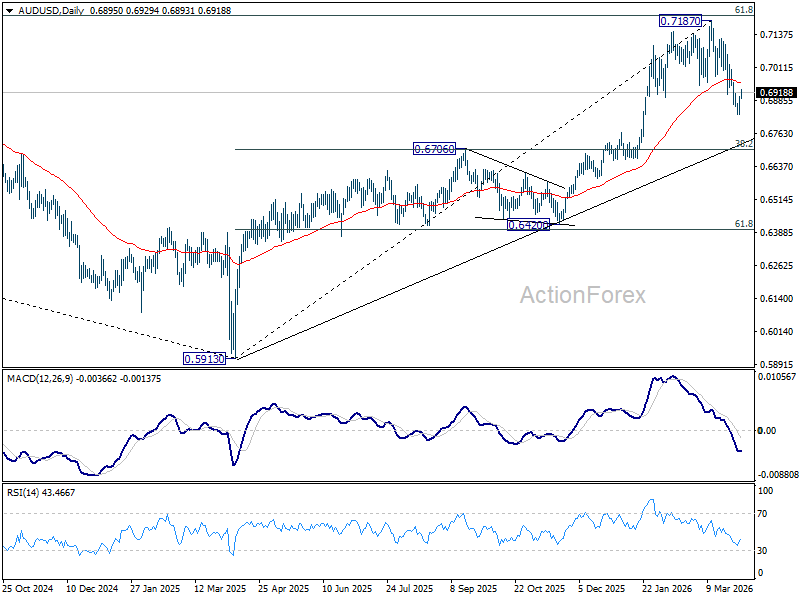
A temporary low should be in place at 0.6832 in AUD/USD with current recovery. Intraday bias is turned neutral first. Further decline is expected as long as 0.6978 support turned resistance. Below 0.6832 will extend the decline from 0.7187 to 38.2% retracement of 0.5913 to 0.7187 at 0.6700. However, firm break of 0.6978 will argue that the correction has completed, and bring retest of 0.7817 high.
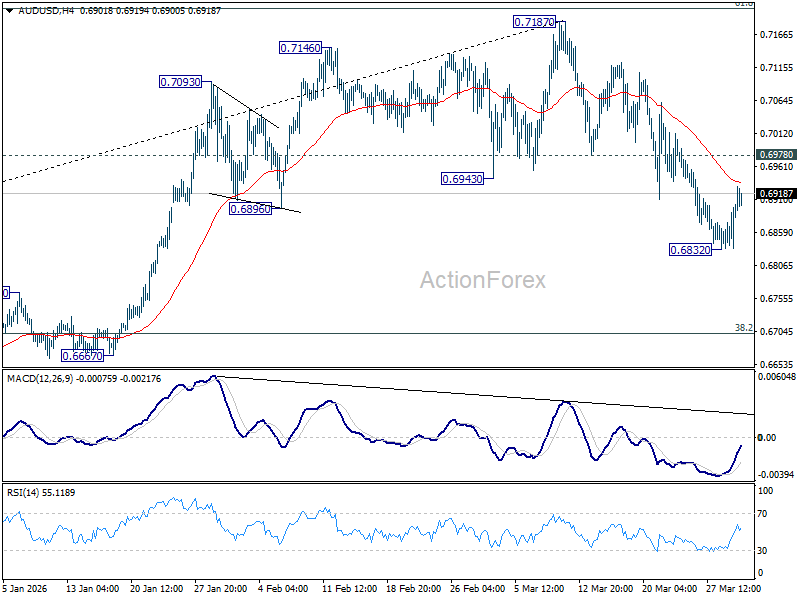
In the bigger picture, as long as 0.6706 cluster support holds, rise from 0.5913 (2024 low) should still be in progress. Decisive break of 61.8% retracement of 0.8006 to 0.5913 at 0.7206 will solidify the case that it's already reversing the down trend from 0.8006 (2021 high). However, firm break of 0.6706 will dampen this bullish case, and bring deeper fall back to 0.6420 support, and possibly below.
Dollar Falls, Stocks Jump as Iran War ‘Finish Line’ Comes Into View
Markets opened Q2 with a powerful relief rally, as a clear shift in the Iran war narrative—from attrition to conclusion—triggered a sharp repricing across assets. The change in tone from prolonged conflict toward a potential endgame has sparked "finish line" optimism, driving equities higher, pulling the Dollar lower, and easing pressure across risk assets.
The catalyst lies in a coordinated shift in messaging from Washington. US President Donald Trump signaled a near-term withdrawal, saying “We’ll be leaving very soon,” possibly within “two or three weeks,” while adding that “Iran doesn’t have to make a deal.” The remarks point to a unilateral exit strategy from “Operation Epic Fury,” removing the need for a negotiated settlement and accelerating expectations of de-escalation.
Reinforcing this shift, Secretary of State Marco Rubio described the situation as approaching a “finish line,” confirming that indirect messages are being exchanged and that a direct meeting is now plausible. He added that if "new people" (implying a change in leadership or a shift in the influence of the IRGC) emerge with a more cooperative stance, that would constitute the political finish line.
Additionally, Iran’s stance introduces a clear condition to the emerging de-escalation narrative. President Masoud Pezeshkian told EU that Tehran has the “necessary will” to end the conflict, but only if credible guarantees are in place to prevent future aggression. This signals openness to a conclusion, but not a unilateral one, with Iran seeking assurances on long-term security.
Together, the messages mark a decisive pivot in the narrative—from a war of attrition toward a conclusion phase.
The immediate impact has been a broad unwind of defensive positioning. US equities surged, with DOW closed up 1,100+ points overnight. S&P 500 rose 2.9% and NASDAQ jumped 3.8%, marking the best single-session performance since March 2025. Also, Asian markets followed with sharp rebounds. Gold has pushed above 4,600 too. The rally reflects not just improved sentiment, but also a positioning reset at the start of Q2, after weeks of risk-off flows tied to escalation fears.
In energy markets, the shift has capped upside risks. Brent crude, while still elevated around 107, has moved back below 110, suggesting that the worst-case supply disruption scenario is no longer being priced. Nevertheless, war premium is being unwound, but not fully erased, as uncertainty around the Strait of Hormuz and Iran’s strategic posture remains unresolved.
Currency markets have reacted decisively. Dollar has fallen sharply, losing its war-premium support as safe-haven demand rotates out. Yen has emerged as the strongest performer, benefiting from lower US yields and a broader unwinding of USD longs, while Euro and Aussie have also gained on improving risk appetite.
However, this is a relief rally driven by expectations, not confirmation. While markets are increasingly pricing a path toward de-escalation, key uncertainties remain. The timeline for withdrawal, the structure of any post-conflict arrangement, and the risk of renewed disruptions in energy flows all remain open questions. Any delay or reversal in these expectations could quickly reintroduce volatility.
Until rhetoric translates into concrete outcomes, conviction will remain fragile, and the current rally will continue to hinge on whether the anticipated “finish line” becomes reality.
In Asia, at the time of writing, Nikkei is up 4.87%. Hong Kong HSI is up 2.07%. China Shanghai SSE is up 1.24%. Singapore Strait Times is up 1.91%. Japan 10-year JGB yield is down -0.054 at 2.305. Overnight, DOW rose 2.49%. S&P 500 rose 2.91%. NASDAQ rose 3.83%. 10-year yield fell -0.031 to 4.311.
Gold Breaks 4,600: Reversal or Bull Trap? Q2 Becomes Battleground
Gold’s rally above 4,600 looks strong, but the move is driven by relief from easing war tensions, not resolution. Inflation risks continue to build in the background, making Gold's outlook uncertain. Q2 will be the key battleground to determine whether this is a true reversal or a bull trap. Read more.
Japan's Strong Tankan Signals Support BoJ Normalization Despite External Risks
Japan’s Tankan survey surprised to the upside, with stronger business sentiment and capex plans signaling resilient corporate activity. More importantly, inflation expectations climbed to record levels, reinforcing the case for further BoJ normalization. However, rising energy costs tied to Middle East tensions continue to cloud the outlook. Read more.
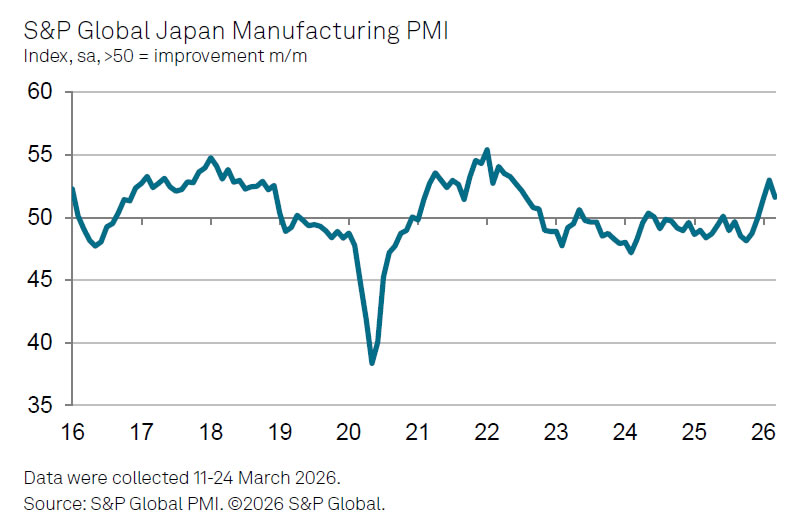
Japan PMI Manufacturing Finalized at 51.6, War-Driven Cost Pressures Build
Japan’s manufacturing PMI eased to 51.6 in March, signaling slower growth after February’s 45-month peak. However, the bigger shift came from surging input costs, with firms facing the sharpest price increases in over 18 months due to Middle East tensions. As companies pass on higher costs and turn more cautious, inflation risks are building even as momentum softens. Read more
AUD/USD Daily Report
Daily Pivots: (S1) 0.6854; (P) 0.0.6879; (R1) 0.6926; More...
A temporary low should be in place at 0.6832 in AUD/USD with current recovery. Intraday bias is turned neutral first. Further decline is expected as long as 0.6978 support turned resistance. Below 0.6832 will extend the decline from 0.7187 to 38.2% retracement of 0.5913 to 0.7187 at 0.6700. However, firm break of 0.6978 will argue that the correction has completed, and bring retest of 0.7817 high.
In the bigger picture, as long as 0.6706 cluster support holds, rise from 0.5913 (2024 low) should still be in progress. Decisive break of 61.8% retracement of 0.8006 to 0.5913 at 0.7206 will solidify the case that it's already reversing the down trend from 0.8006 (2021 high). However, firm break of 0.6706 will dampen this bullish case, and bring deeper fall back to 0.6420 support, and possibly below.
Gold Price Breaks 4,600: Reversal or Bull Trap? Q2 Becomes Battleground
Gold Price's break above the 4,600 level this week has reignited bullish momentum, but the move raises a deeper question — is this a genuine reversal or a temporary bounce? After a sharp Q1 correction, Q2 is now shaping up as the decisive battleground that will determine whether Gold is reversing higher or merely recovering within a broader bearish structure.
The immediate drivers are clear. The pullback in Dollar and US yields has provided a tailwind, while easing geopolitical tensions. US President Donald Trump’s remarks that the US could be “leaving very soon" from the Iran War, possibly within “two or three weeks,” alongside his comment that “Iran doesn’t have to make a deal,” suggest a willingness to exit “Operation Epic Fury” without a formal agreement. This shift has lowered the war premium embedded in Dollar, indirectly supporting gold.
Still, this is a rebound driven by relief, not resolution. While de-escalation pressures the Dollar and lifts gold, the broader macro backdrop remains conflicted. If Iran maintains its "toll booth" strategy in the Strait of Hormuz, oil is likely to stay above $100, keeping inflation risks elevated. That, in turn, would anchor higher interest rate expectations and limit Gold’s upside.
Technically, the break above the 38.2% retracement of 5,419.02 to 4,098.45 at 4,602.90 suggests that price action is doing more than just bouncing — it is challenging the prior bearish structure. However, 4,600 is a trigger, not a confirmation. The next key test lies at the 55 D EMA (now at 4789.98), which now serves as the real battleground for bulls and bears.
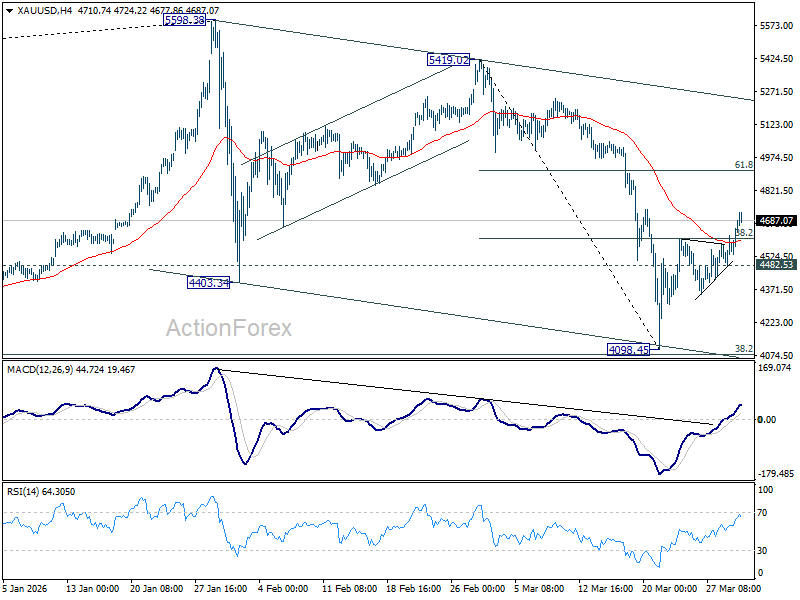
Sustained break above 55 D EMA would strengthen the case that the correction from 5,419.02 peak has completed in three waves down to 4,098.45, after drawing support from the key 4,000 cluster support. That will open the path back toward 5,419.02–5,598.38 resistance zone, with prospect of resuming the long term up trend towards the end of the year.
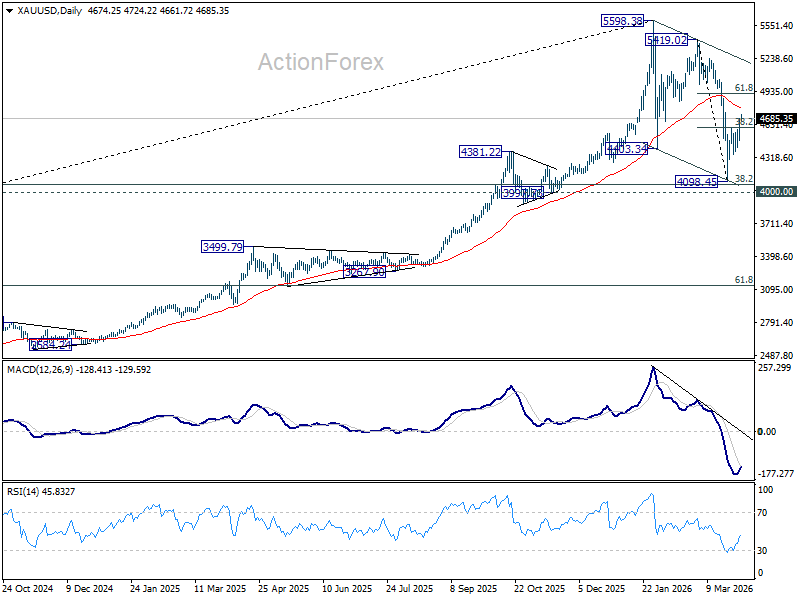
On the flip side, rejection at 55 D EMA followed by a break below 4,482.53 minor support would argue that the rebound has run its course. That scenario would likely see Gold retest the 4000 psychological level before forming a more durable bottom.
With the Iran War outcomes and elevated oil price still unresolved, Q2 will separate signal from noise, determining whether Gold’s latest surge marks the start of a new leg higher or just another bull trap.
Bitcoin Edges Higher, Recovery Signals Early Strength
Key Highlights
- Bitcoin started a recovery wave above $66,500 and $67,000.
- A bearish trend line is forming with resistance at $68,500 on the 4-hour chart of BTC/USD.
- Ethereum also climbed over 4% and surpassed $2,050.
- Gold is grinding higher toward the $4,760 resistance.
Bitcoin Price Technical Analysis
Bitcoin price remained supported above $65,000 against the US Dollar. BTC formed a base and started a recovery wave above $66,500.
Looking at the 4-hour chart, the price surpassed the 23.6% Fib retracement level of the downward move from the $72,001 swing high to the $64,915 low. However, the bears seem to be active near the $68,500 resistance.
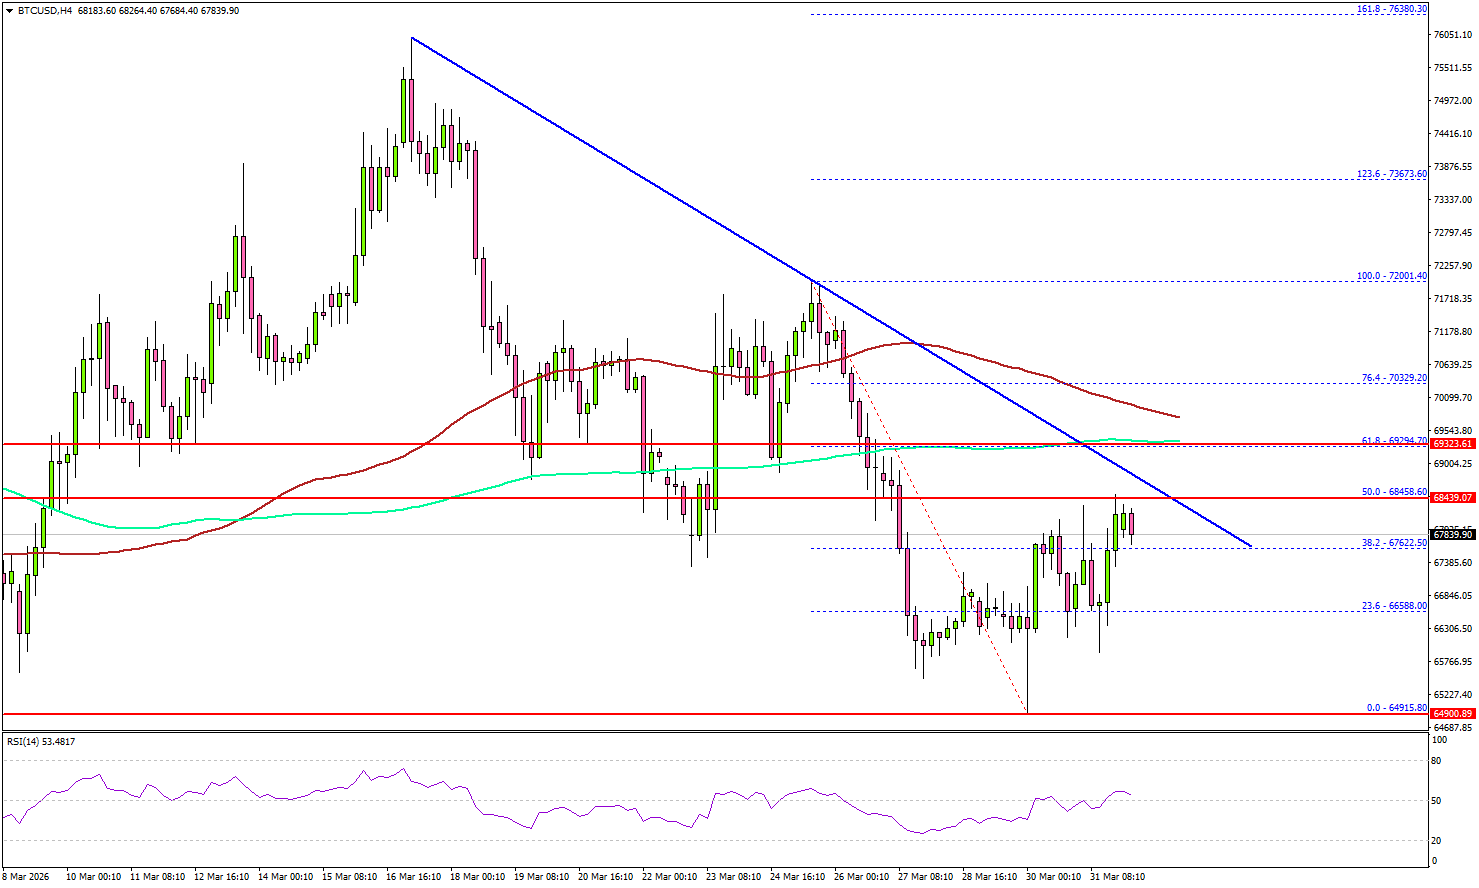
There is also a bearish trend line forming with resistance at $68,500. The price is now well below the 100 simple moving average (red, 4-hour) and the 200 simple moving average (green, 4-hour).
Immediate support sits at $67,000. The first key support could be $66,500. The main breakdown support could be near $65,500. A downside break below $65,500 might start another decline. The next major support is $64,200, below which BTC could decline toward $63,500.
On the upside, the price now faces resistance near $68,500 and the trend line. The first key hurdle is $69,200, the 200 simple moving average (green, 4-hour), and the 50% Fib retracement level of the downward move from the $72,001 swing high to the $64,915 low.
A close above $69,200 could send the price toward $71,500. Any more gains might call for a test of $74,000.
Looking at Ethereum, the price also gained bullish momentum above $2,000, and the bulls could now aim for a move toward $2,200.
Today’s Key Economic Releases
- US Retail Sales for Feb 2026 (MoM) – Forecast +0.5%, versus -0.2% previous.
- US ADP Employment Change for March 2026 - Forecast 40K, versus 63K previous.
Japan PMI Manufacturing Finalized at 51.6, War-Driven Cost Pressures Build
Japan’s PMI Manufacturing was finalized at 51.6 in March, down from February’s 45-month high of 53.0, signaling moderation in growth momentum. Even so, the reading still marked the second-strongest performance since July 2022, with Q1 overall delivering the best quarterly showing since Q2 2022.
S&P Global Market Intelligence's Annabel Fiddes noted that the slowdown coincided with escalation of the Middle East conflict, which survey respondents linked directly to rising cost pressures. Input prices increased at the fastest pace in over a year-and-a-half, driven largely by higher energy costs. Firms responded by raising output prices "at a quicker pace as they sought to protect their margins".
“While the immediate impact of the war is already feeding through directly to price indicators, it will be important to monitor the PMI data in the coming months to see whether cost and supply chain pressures continue to intensify, and to assess how resilient global demand conditions are," Fiddles added.