

Sample Category Title
WTI: Oil Price Extends Weakness on Renewed Demand Fears
The WTI oil extends weakness on Wednesday, following nearly 6% fall on Tuesday, hitting one week low.
The sentiment soured on renewed concerns about global demand, following a rebound in Covid cases and new lockdowns in China, world’s top oil importer.
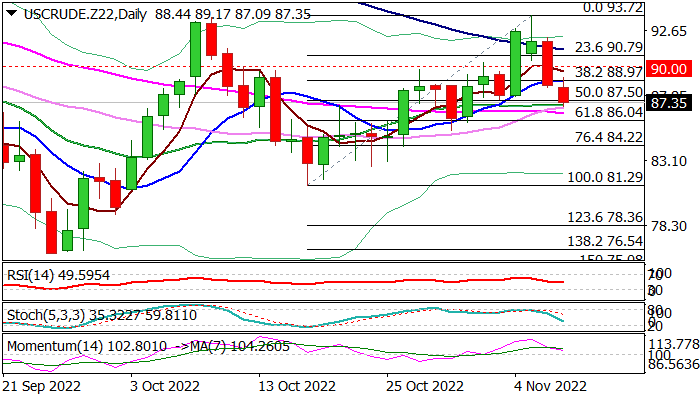
Fresh weakness, after bulls got repeatedly trapped above Fibo 76.4% of $97.62/$76.25 ($92.58), dipped well below psychological $90 support, retracing over 50% of $81.29/$93.72 upleg that weakened near-term structure and started to shift near-term focus lower.
Daily studies show strong loss of bullish momentum that contributes to negative outlook, though 14-d momentum indicator is still in positive territory, suggesting that fresh bears would need more evidence for confirmation. Extension through diverged 20/55 DMA’s ($87.02/$86.58) and pivotal Fibo level at $86.04 (61.8% of $81.29/$93.72) would add to negative signals and increase downside risk.
Near-term action needs to stay below broken Fibo 38.2% level at $88.97 to keep bearish stance, while $90 level marks the upper pivot, violation of which would sideline bears.
Res: 88.97; 90.00; 90.79; 91.26.
Sup: 87.02; 86.58; 86.04; 85.28.
Sunset Market Commentary
Markets
At least for now, the US midterm elections didn’t provide an unequivocal driver for US/global markets. With several states still undecided, Republicans apparently are in pole position to take control of the House of Representatives while the Senate remains a close call. Even as Democrats performed better than expected, the Biden government probably will find it difficult to pass any high profile budgetary (or other) legislation. In theory, a ‘blockage’ of a stimulative fiscal policy, ceteris paribus, should help the Fed in its anti-inflationary campaign. However, bond markets don’t draw any firm conclusions yet. US yields basically maintain the post-Fed/post-payrolls holding pattern, gaining about 4 bps across the curve, which in hindsight of recent market moves only can be denominated as a very calm trading session. Eco data were few. Mortgage applications fell for the seventh consecutive week (-0.1%) but this evidently didn’t come as a surprise. Markets maintain a clear wait-and-see modus ahead of tomorrow’s key US inflation data. The US Treasury later today will sell $ 35 bln of 10-y Notes following yesterday’s successful 3-y sale. EMU/German bonds this time outperform US counterparts in bull flattening move with yields easing between 6 bps (2-y) and 1.5 bp (30-y). Especially short-term EMU/German yields over the previous days tested the cycle peak level, but for now there is no strong enough trigger to force a clean break higher. The EMU 2-y swap yield hovers near the 3.0% handle. The ECB today published its consumer inflation expectations (cf infra). The stalemate on the outcome of the US mid-term election for sure also didn’t inspire equity investors. The EuroStoxx 50 is ceding about 0.5%. US indices open with a loss of 0.75%/1.0%.
In the absence of any high profile news, USD-trading was confined by nearby technical boundaries. The USD DXY index yesterday extensively tested the 109.53 previous low/neckline, but for now the test is rejected (DXY 110.14). EUR/USD (1.0035) easily holds north of parity, but a (admittedly modest) negative turn in the interest rate differential apparently is enough to ‘protect’ the 1.0094/96 recent peak/resistance levels. Sterling lost yesterday’s positive spin. Markets apparently ‘fear’ that Fin. Min Hunt’s plans to restore fiscal orthodoxy might cause the BoE to give more weight on growth considerations. EUR/GBP currently again extensively test the 0.8781/91 resistance area. After a substantial rise in EUR/CHF in October and a subsequent consolidation later, a test of parity in this cross rate is still one bridge too far. The franc ‘strengthens’ to currently trade in the EUR/CHF 0.987 area.
News Headlines
Hungarian inflation rose by 2% M/M to be up 21.1% Y/Y (from 20.1% expected). Underlying core inflation accelerated from 20.7% Y/Y to 22.3% Y/Y. Processed food prices are still the main inflation driver, rising by 4.7% M/M. Way above average prices for tradable goods and market services show that inflation is broad-based though. Peak inflation is still to come near year end. Our own forecast (22%+) is slightly below what government officials indicated earlier this week (25%). It could take until Q2 2023 before we see <20% inflation readings, but afterwards we see a rapid dive below 10% in autumn 2023. The Hungarian central bank is expected to keep its very aggressive monetary policy stance to back the forint at least until there is an agreement with the EU on releasing Covid-relief funds. The forint didn’t respond to the inflation numbers. EUR/HUF currently trades around 404 after bouncing off the important 399/400 support area earlier this week.
The ECB in its economic bulletin took a deep dive into consumer’s inflation expectations. Consumers’ inflation expectations have reacted to higher inflation and heightened uncertainty, but the term structure of inflation expectations remains strongly downward sloping. In other words, consumers in the euro area continue to see that the current spike in perceived inflation has a significant transitory component and expect inflation to return closer to the levels seen in the past over the medium term, albeit above 2%. The upward movement in expectations, the increase in uncertainty surrounding them and the increased sensitivity of medium-term expectations to perceived current inflation all call for continued close monitoring though.
UK Q3 GDP and the Official Start of the Recession?
After warning for a few months that the UK was heading towards a recession, after the last meeting it came out and said that the recession had arrived. Of course, the data hasn't been out to show it, yet. Since the technical definition of a recession is two consecutive quarters of negative growth, the data won't be available until the first quarter of next year at the earliest.
But, we can see the first signs, which could be in the avalanche of data coming out of the UK before the market opens on Friday. There are several indicators that by themselves could move the market, such as the trade balance and production indicators. But the one most likely to get most of the attention from traders is the GDP reading.
What to look out for
UK Q3 GDP is forecast to come in at -0.5%, down from 0.2% reported in Q2. That could be the first of the required two negative quarters to technically say there is a recession. Annual GDP growth is expected to more than halve to 2.1% from 4.4% in the summer quarter.
There are a couple of mitigating factors, it should be noticed. Q3 has the resignation of Johnson as PM and the subsequent uncertainty about who would take over. Then there was the disastrous release of the now infamous Truss "mini-budget" which forced the BOE to intervene in the markets, and likely contributed to businesses holding back on investment. If PM Sunak can restore confidence among investors, some of those situations could improve in the fourth quarter. If this quarter's date is not as bad as expected, the UK might technically squeeze through and avoid a recession. That might give the markets some opportunity to bounce even if there is a negative result.
Market reaction
UK Q3 investment is expected to low to 1.3% compared to 3.7% prior. Meanwhile Industrial Production is expected to come in negative again at -4.3% compared to -5.2% prior. Those factors could be important in how the market processes the GDP figures.
Higher energy prices and uncertainty in the economy are the main explanations for the underperformance in investment and industry. But if those figures weren't as bad as anticipated, and in conjunction with a not as bad as anticipated result in GDP, it could give the markets some breathing room.
The BOE is the key
The worse the economy is, the less room the BOE has to keep fighting inflation. Which means that a worse than anticipated GDP number could translate into further pound weakness, complicating the BOE's job. But better than expected GDP figures - and especially production - could mean that the economy has a little more room for the BOE to keep hiking or to hold the higher rates for longer.
That would likely support the pound, even though the stock market could react negatively. The other factor that has investors worried is the whole in the UK government's budget. Increased investment, and better than anticipated growth, would help keep tax revenue flowing to the Treasury.
Gold’s New Glow
Investor interest in precious metals is shining with renewed vigour as some investors see them as a safe haven amid the storm of the crypto market. Having broken above $1700, gold is showing the first signs of breaking the downtrend that has been in place since March this year.
Intraday on Tuesday, gold was up 3%, spurred by rising volatility in cryptocurrencies and overall positive dynamics in traditional financial markets.
But to be precise, gold showed an impressive jump as early as Friday, as the bulls managed to push the price out once again of the area of the lows of the last six weeks, and further, a whirlwind of events picked up and lifted it higher.
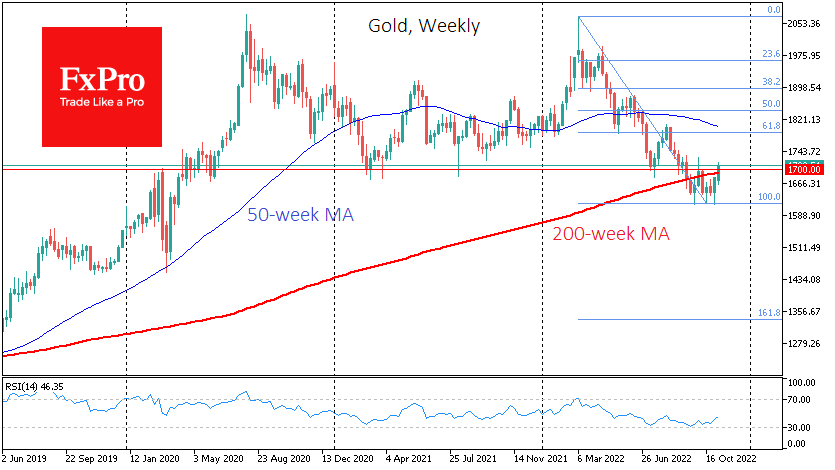
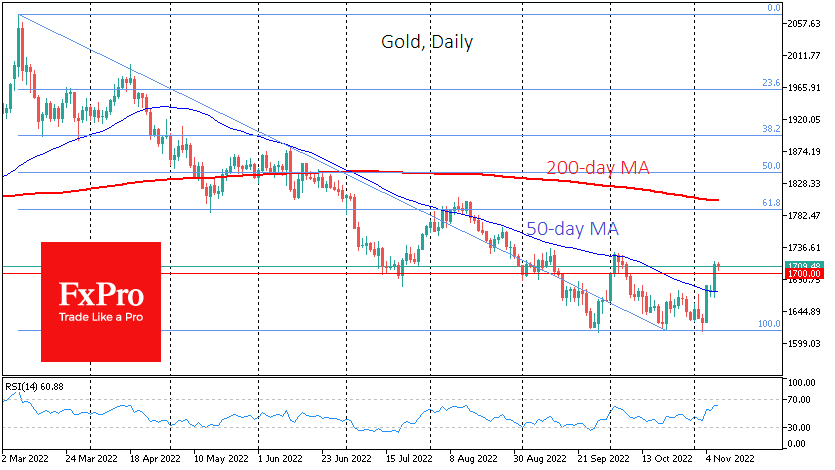
The powerful rally in gold on Friday and Tuesday stands out, for there was no rally in the stock indices on that day, and the collapse in the dollar only happened on Friday. This could be the first signal that we are seeing the beginning of a rebound in gold, and investors, who have been cautious in putting large amounts of capital into gold since late September, are now taking an active bullish stance.
Among the fundamental factors supporting the rise in the gold price is the increased buying of gold by central banks, which last quarter bought the maximum amount of gold since the 1980s. It is tactically difficult to persuade central bankers to buy bonds when prices are falling, and central banks of developed countries one by one say they are not finished with a rate hike, suggesting further pressure on bond prices. Meanwhile, overall risk appetite has risen in anticipation of a minor step up of hikes later, drawing attention to the cheaper gold.
This week, the price broke through its 50-day moving average at the end of the previous week, and on Monday and Tuesday, this line was already in active support. In addition, gold immediately managed to move above the former support line of July and September. To be sure of breaking the trend, one should wait until the price crosses above the area of the previous highs near $1725. If that happens, the price might end the correction rather quickly and go to $1790-1800, which includes the 61.8% Fibonacci retracement levels of the declines since March, the local highs of August, and the 200-day MA.
USD/CHF Mid-Day Outlook
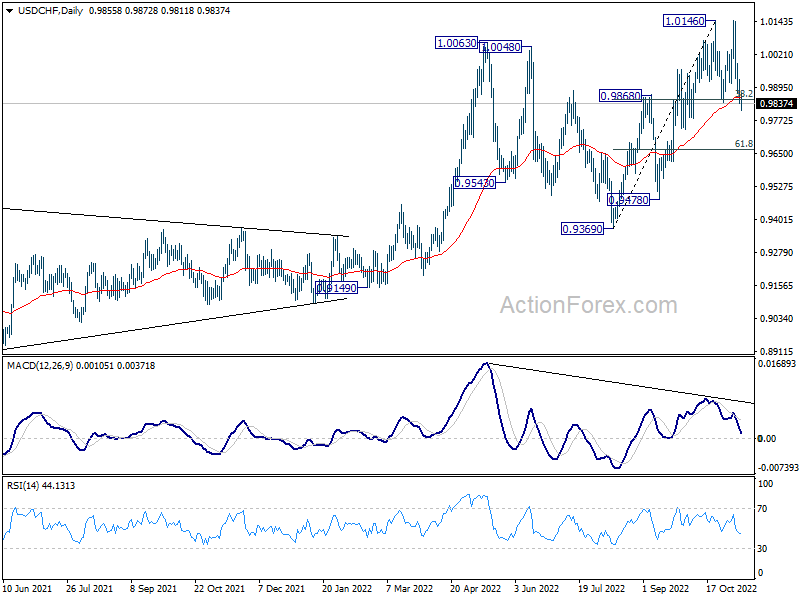
Daily Pivots: (S1) 0.9822; (P) 0.9874; (R1) 0.9912; More...
Intraday bias in USD/CHF stays on the downside at this point. A double top pattern should be completed (1.0146, 1.0146). Deeper fall should be seen to 61.8% retracement of 0.9369 to 1.0146 at 0.9666. On the upside, above 0.9925 minor resistance will turn intraday bias neutral first.
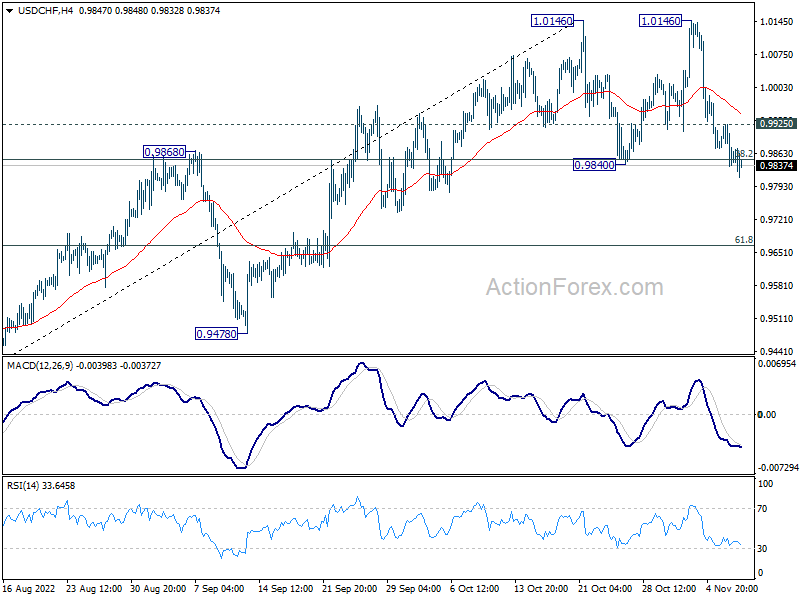
In the bigger picture, upside momentum is diminishing as seen in daily MACD. But up trend from 0.8756 (2021 low) is still in favor to resume as long as 0.9799 support holds. Break of 1.0146 will target 1.0342 (2016 high). However, sustained break of 0.9779 will suggest that a large scale correction, at least, is underway.
USD/JPY Mid-Day Outlook
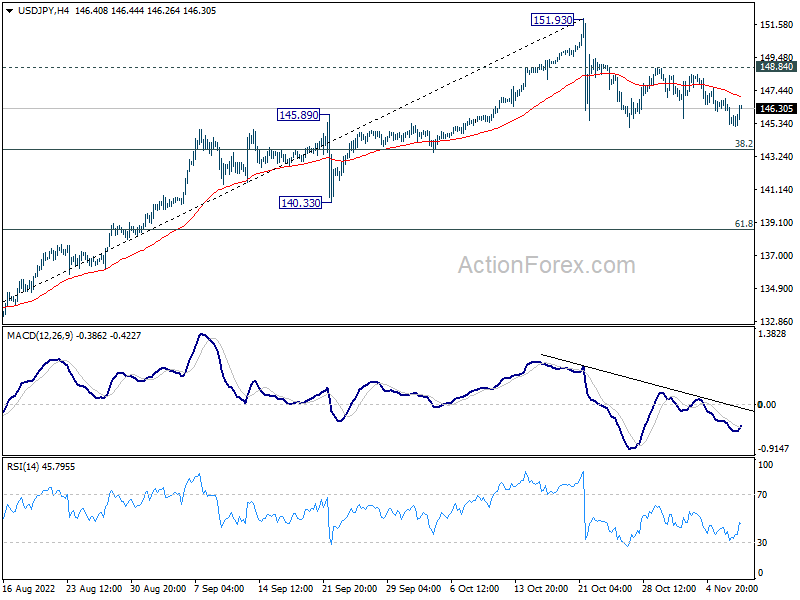
Daily Pivots: (S1) 145.01; (P) 145.97; (R1) 146.64; More...
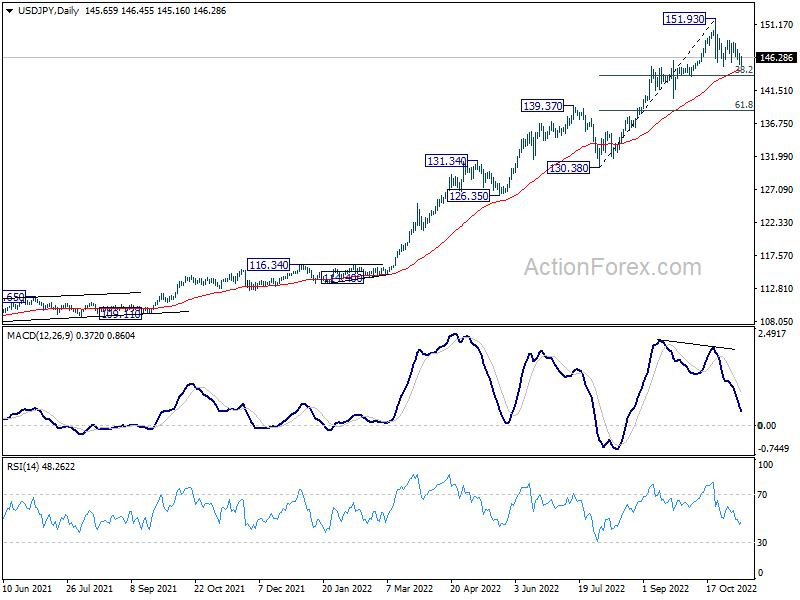
Intraday bias in USD/JPY stays neutral as consolidation from 151.93 is extending. Deeper decline might be seen but downside should be contained by 38.2% retracement of 130.38 to 151.93 at 143.69 to bring rebound. On the upside, above 148.84 minor resistance will bring stronger rebound back towards 151.93 high. But upside should be limited there to continue the corrective pattern.
In the bigger picture, up trend from 101.18 is still in progress, as part of the whole up trend from 75.56 (2011 low). 147.68 (1998 high) was already met and there is no clearly sign of topping yet. In any case, break of 140.33 support is needed to be the first sign of medium term topping. Otherwise, further rise is in favor to next target at 160.16 (1990 high).
GBP/USD Mid-Day Outlook
Daily Pivots: (S1) 1.1452; (P) 1.1525; (R1) 1.1621; More...
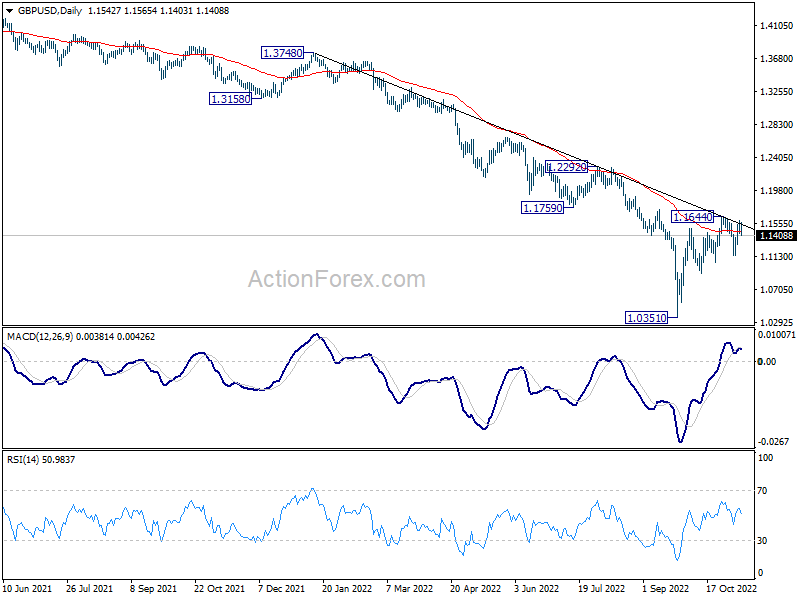
GBP/USD retreats ahead of 1.1644 resistance and intraday bias stays neutral for the moment. On the upside, break of 1.1644 will resume the whole rise from 1.0351 and target 1.1759/2292 resistance zone. On the downside, break of 1.1145 will reaffirm the case that corrective rise from 1.0351 has completed at 1.1644. Deeper fall would then be seen back to 1.0922 support and below.
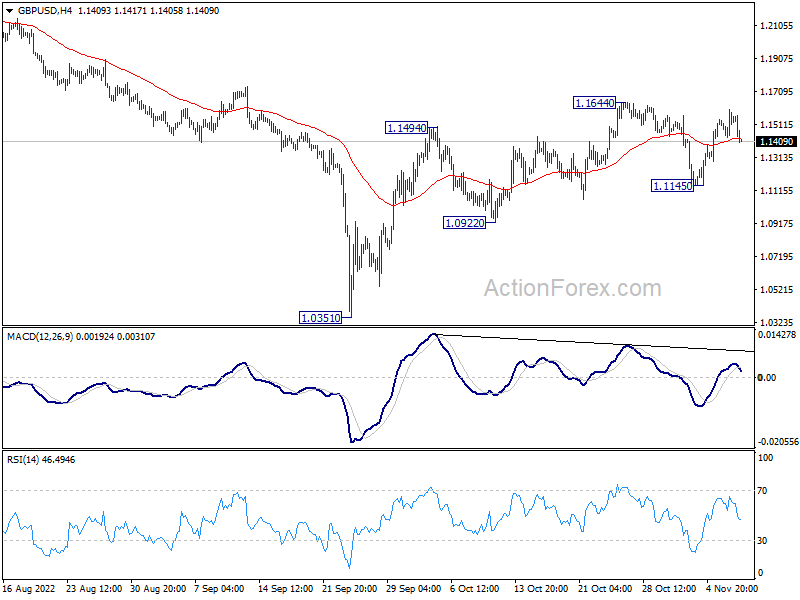
In the bigger picture, fall from 1.4248 (2018 high) is part of the long term down trend from 2.1161 (2007 high). Outlook will stay bearish as long as 1.1759 support turned resistance holds. Parity would be the next target on resumption. Nevertheless, firm break of 1.1759 will confirm medium term bottoming, and open up stronger rise back to 55 week EMA (now at 1.2357).
EUR/USD Mid-Day Outlook
Daily Pivots: (S1) 0.9999; (P) 0.9987; (R1) 1.0122; More...
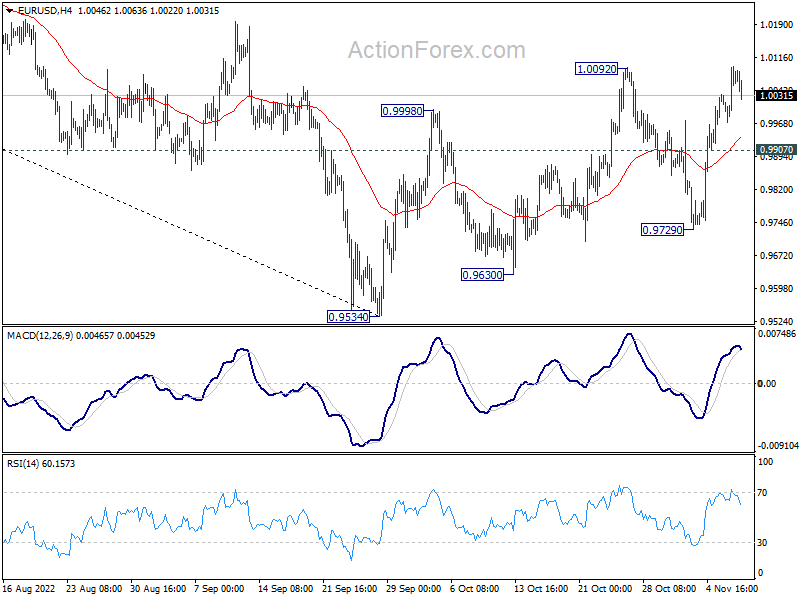
EUR/USD retreats after hitting 1.0092 and intraday bias remains neutral first. On the upside, firm break of 1.0092 will resume whole rise from 0.9534. Further rally should then be seen to 38.2% retracement of 1.1494 to 0.9534 at 1.0283, even as a corrective rise. On the downside, however, break of 0.9907 minor support will turn bias back to the downside for 0.9729 support first. Break there should bring retest of 0.9534 low.
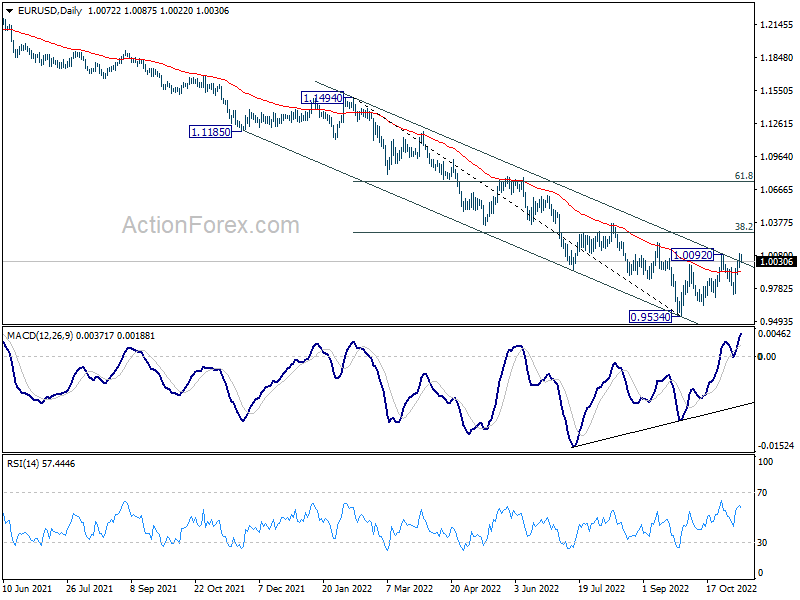
In the bigger picture, medium term outlook stays bearish with trading inside the falling channel. That is larger down trend from 1.2348 (2021 high) is still in progress. Firm break of 0.9534 low will confirm this bearish case. However, break of 1.0092 will add to the case of medium term bottoming, on bullish convergence condition in daily MACD, and bring further rally towards 55 week EMA (now at 1.0583).
Swiss Franc Rises as Risk-On Sentiment Fades, Dollar Recovering
Swiss Franc rises broadly today as yesterday's risk-on sentiment quickly faded. Dollar is also recovering together with Canadian while Yen is also slightly higher. On the other hand, Sterling is under some pressure, in particular against European majors. Australian and New Zealand Dollar are not far behind. In other markets, Gold lacks follow through buying so far and WTI crude oil dips mildly. Cryptocurrencies are the biggest movers as market rout continues. Overall, traders are already looking beyond US mid-term election results, to CPI release tomorrow.
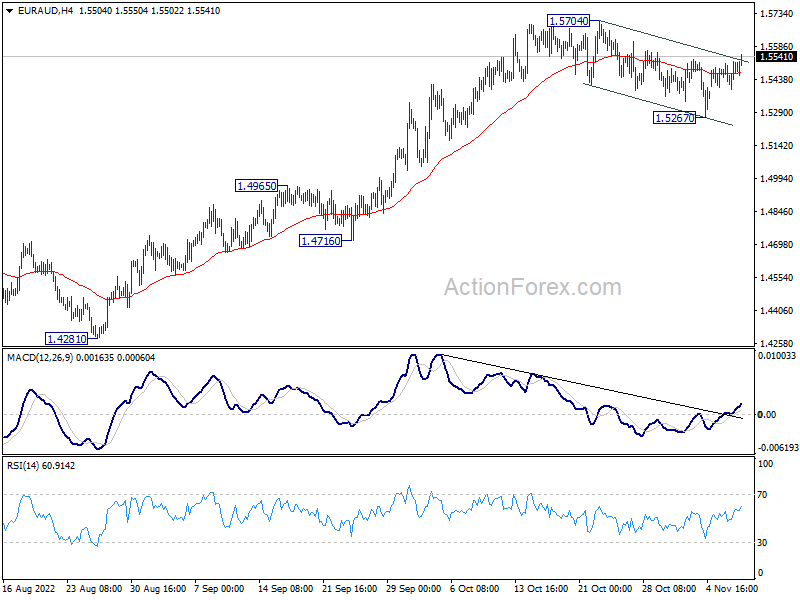
Technically, EUR/AUD's rise is one development to note. Break of the channel resistance argues that pull back from 1.5704 might be over, and larger rally from 1.4821 could be resume. But all would depend on the upside momentum as EUR/AUD approaches 1.5704 resistance. Based on current intermarket movements, break of 1.5704 would more likely be a result of selloff in Aussie, accompanying return of risk-off sentiment. Let's see.
In Europe, at the time of writing, FTSE is down -0.30%. DAX is down -0.59%. CAC is down -0.34%. Germany 10-year yield is down -0.021 at 2.262. Earlier in Asia, Nikkei dropped -0.56%. Hong Kong HSI dropped -1.20%. China Shanghai SSE dropped -0.53%. Singapore Strait Times rose 0.63%. Japan 10-year JGB yield rose 0.0065 to 0.259.
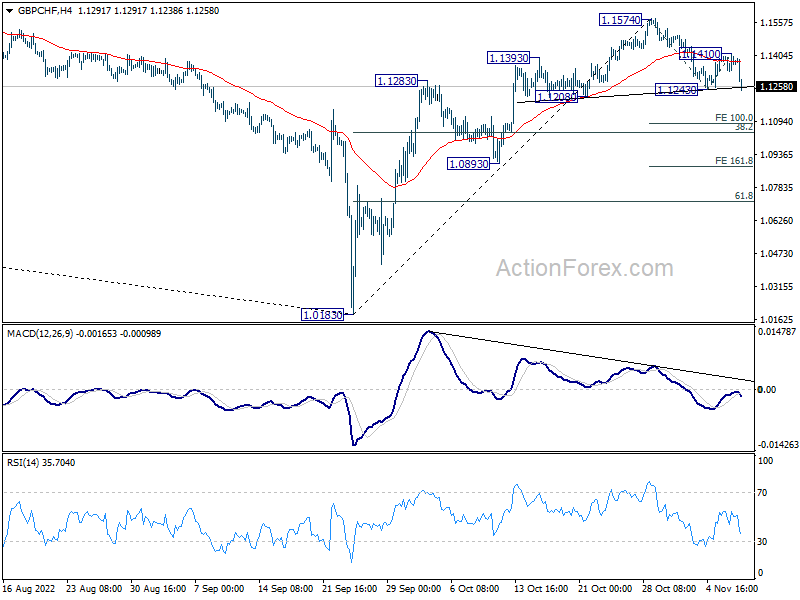
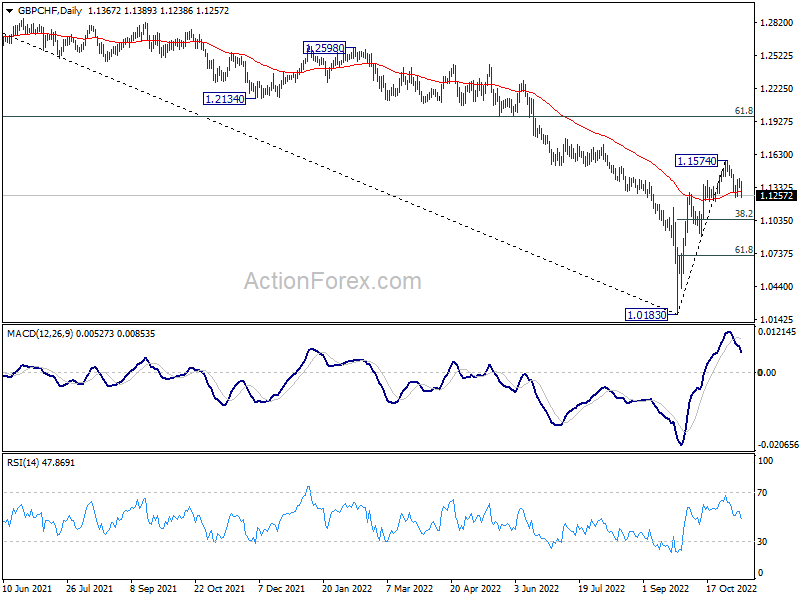
GBP/CHF pressing head and shoulder neckline, more downside ahead
Notable decline is seen in GBP/CHF today and it's now pressing a head and shoulder neck line support, as well as 55 day EMA. Considering bearish divergence condition in 4 hour MACD, 1.1574 is likely a short term top. Fall from there should be correcting whole rebound from 1.0183. Deeper fall is now in favor as long as 1.1410 resistance holds.
Firm break of 1.1243support will complete a head and shoulder top (ls: 1.1393; h: 1.1574; rs: 1.1410). In such case, further fall should be seen to 100% projection of 1.1574 to 1.1243 from 1.1410 at 1.1079 and below.
Stronger support should be seen from 38.2% retracement of 1.0183 to 1.1574 at 1.1043 to contain downside to bring rebound, at least on first attempt.
However, strong break of 1.1043 will open up deeper decline to 161.8% projection at 1.0874, which is close to 1.0893 support, before bottoming.
RBA Bullock: Further increases in interest rates will be required
RBA Deputy Governor Michele Bullock said in a speech that "further increases in interest rates will be required" to meet the inflation target. Meanwhile, the "size and timing of future increases" will depend on the data.
She added that inflation is "increasingly broad based" and it "won't peak until the end of the year". After that, RBA expects " rising interest rates and cost-of-living pressures to drive a moderation in consumption that brings demand more in line with supply". And that should help to get inflation back to target "over the next couple of years".
Bullock also discussed four uncertainties around the central forecasts. Firstly, in the international environment, a "significant concern" is the "downside risks in China". Second is what the current high inflation and cost-of-living pressures might do to price and wage expectations in Australia. Third is the behavior of households as interest rates and inflation rise. Fourth is around energy and other supply shocks that could boost inflation and lower growth.
EUR/USD Mid-Day Outlook
Daily Pivots: (S1) 0.9999; (P) 0.9987; (R1) 1.0122; More...
EUR/USD retreats after hitting 1.0092 and intraday bias remains neutral first. On the upside, firm break of 1.0092 will resume whole rise from 0.9534. Further rally should then be seen to 38.2% retracement of 1.1494 to 0.9534 at 1.0283, even as a corrective rise. On the downside, however, break of 0.9907 minor support will turn bias back to the downside for 0.9729 support first. Break there should bring retest of 0.9534 low.
In the bigger picture, medium term outlook stays bearish with trading inside the falling channel. That is larger down trend from 1.2348 (2021 high) is still in progress. Firm break of 0.9534 low will confirm this bearish case. However, break of 1.0092 will add to the case of medium term bottoming, on bullish convergence condition in daily MACD, and bring further rally towards 55 week EMA (now at 1.0583).
Economic Indicators Update
| GMT | Ccy | Events | Actual | Forecast | Previous | Revised |
|---|---|---|---|---|---|---|
| 23:50 | JPY | Bank Lending Y/Y Oct | 2.70% | 2.50% | 2.30% | |
| 23:50 | JPY | Current Account (JPY) Sep | 0.67T | 0.41T | -0.53T | 0.10T |
| 01:30 | CNY | CPI Y/Y Oct | 2.10% | 2.50% | 2.80% | |
| 01:30 | CNY | PPI Y/Y Oct | -1.30% | -1.40% | 0.90% | |
| 05:00 | JPY | Eco Watchers Survey: Current Oct | 49.9 | 50.5 | 48.4 | |
| 15:00 | USD | Wholesale Inventories Sep F | 0.80% | 0.80% | ||
| 15:30 | USD | Crude Oil Inventories | 0.3M | -3.1M |
GBP/CHF pressing head and shoulder neckline, more downside ahead
Notable decline is seen in GBP/CHF today and it's now pressing a head and shoulder neckline support, as well as 55 day EMA. Considering bearish divergence condition in 4 hour MACD, 1.1574 is likely a short term top. Fall from there should be correcting whole rebound from 1.0183. Deeper fall is now in favor as long as 1.1410 resistance holds.
Firm break of 1.1243support will complete a head and shoulder top (ls: 1.1393; h: 1.1574; rs: 1.1410). In such case, further fall should be seen to 100% projection of 1.1574 to 1.1243 from 1.1410 at 1.1079 and below.
Stronger support should be seen from 38.2% retracement of 1.0183 to 1.1574 at 1.1043 to contain downside to bring rebound, at least on first attempt.
However, strong break of 1.1043 will open up deeper decline to 161.8% projection at 1.0874, which is close to 1.0893 support, before bottoming.