Sample Category Title
Gold to press 1900 as rally resumes
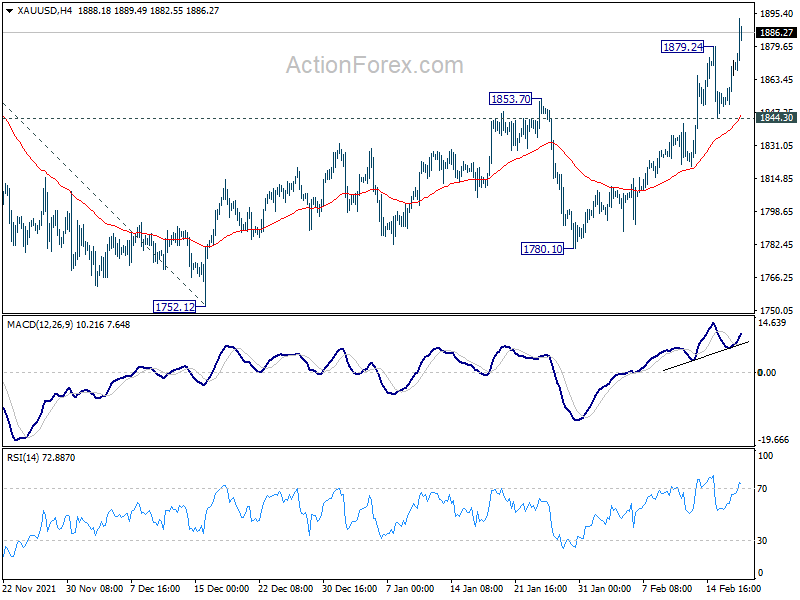
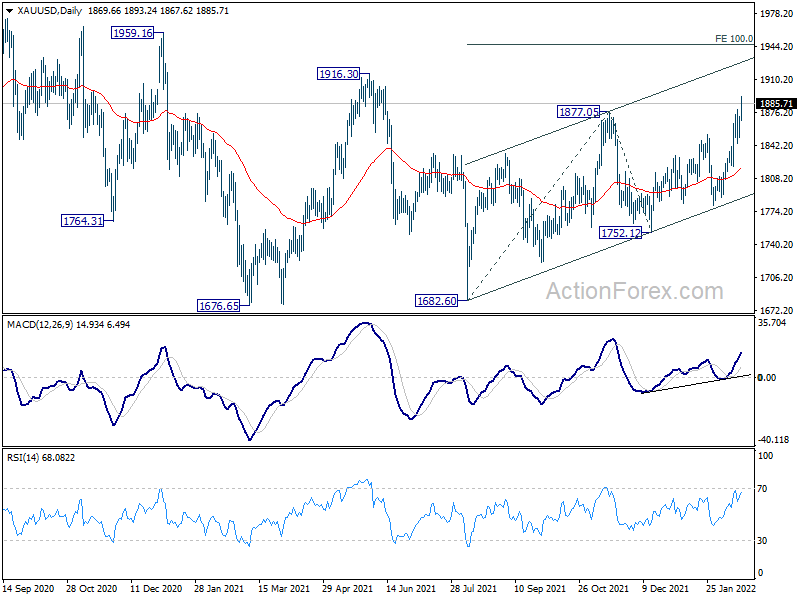
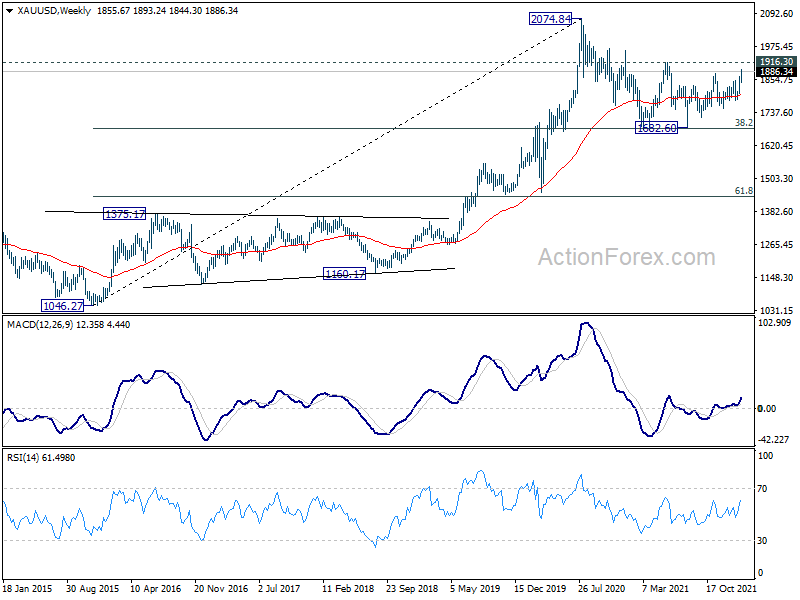
Gold's rally resumes today by taking out 1879.24 temporary top and hits as high as 1893.24 so far, just shy of 1900 handle. Further rally is now expected as long as 1844.30 support holds. Current rise is seen as part of the whole rally from 1682.60. Gold should break through 1916.30 resistance to 100% projection of 1682.60 to 1877.05 from 1752.12 at 1946.57.
Meanwhile, it should be noted that firstly, firm break of 1916.30 should confirm completion of the correction from 2074.84 at at 1682.60. Secondly, further break of 1946.57 will suggest medium term up side acceleration. In this case, retest of 2074.84 high should be quickly within reach.
Crude Oil May Test 87.00-86.00 Area: Elliott Wave Analysis
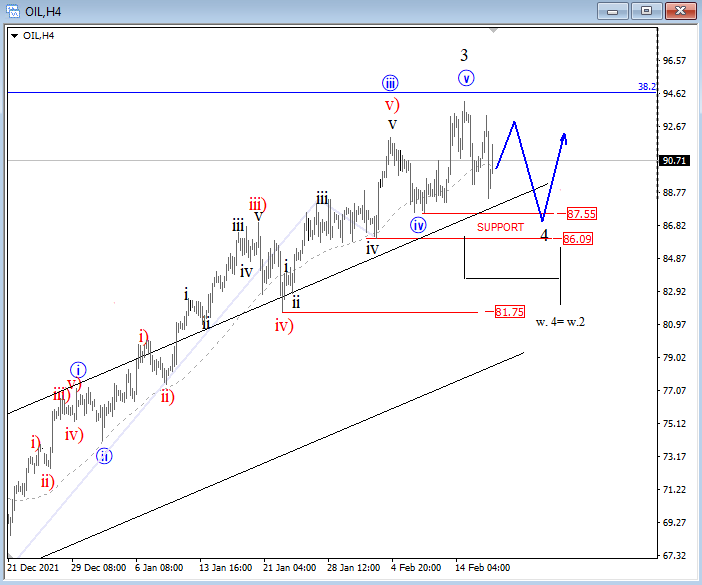
Crude oil moved to a new high on Friday and then through Monday sessions on US reports that Russia will invade Ukraine this week. However, for now, this is not the case, so oil is coming back down, which we think it's wave 4 as mentioned in our past updates.
For now, we can already see three subwaves down but current wave 4 is "too" small measured in time compared to wave 2 of the same degree. As such, we assume that wave 4 can be more complex and even deeper headed into the next week. Nice support remains at 87.00-86.00 area.
Crude oil 4h Elliott Wave analysis
S&P500, Dow Jones Struggle to Trend, Balancing Geopolitics and Fed
The Ukrainian crisis is not likely to recede into the background anytime soon. Promising Russian statements about the withdrawal of troops are refuted by the West and Ukraine, near where the exercises are taking place. There was also a series of accusations and denials about the shootout in Donbas in the morning, which triggered impulsive selling of risky assets.
The local momentum of the markets’ decline was less than what we saw on Friday following Biden’s statements about Russia’s impending attack on Ukraine. Still, the latest news clearly shows that we should not hope for smooth and quick exhaustion of the conflict and a favourable resolution in the coming days.
So far, however, there are more signals that Eastern European politicians still want a diplomatic, not forceful solution, which forms a modest reduction in the pull towards security.
The Fed was also on the side of the stock market bulls yesterday. The published minutes of the January meeting were not as hawkish as investors had expected. The FOMC at the end of last month did not consider a 50-point rate hike in March and did not talk about the need for seven hikes this year.
Then we had the labour market report, which showed strong growth in employment and wages, and even later came frightening figures about inflation accelerating to 40-year highs. Yesterday the retail sales figures were added to it. Americans bought harder than expected in January, and some observers attribute that to a rush of demand due to inflation fears and a spike in auto and apparel prices.
The Fed might revise its view to a more hawkish one after bullish reports, but the markets did breathe a sigh of relief, managing to pull the S&P500 and Russell2000 into the green at the end of Wednesday.
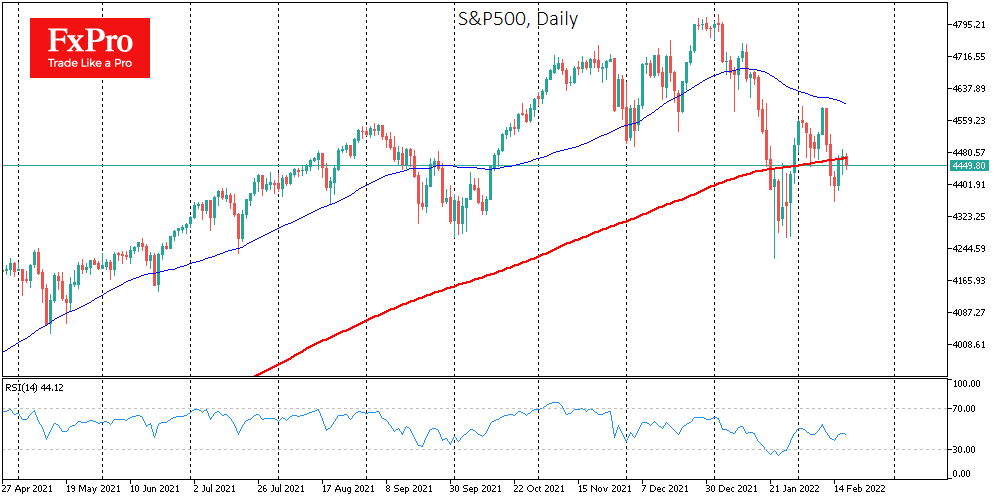
Meanwhile, the S&P500 and Dow Jones continue to struggle behind the 200-day moving average, with no victory signals for the bulls or the bears in this local battle. Investors and traders should pay close attention to this struggle, as a sharp pullback to one side or the other could set the direction for the days and weeks ahead.
AUDUSD Bullish Efforts Suppressed by 100-MA
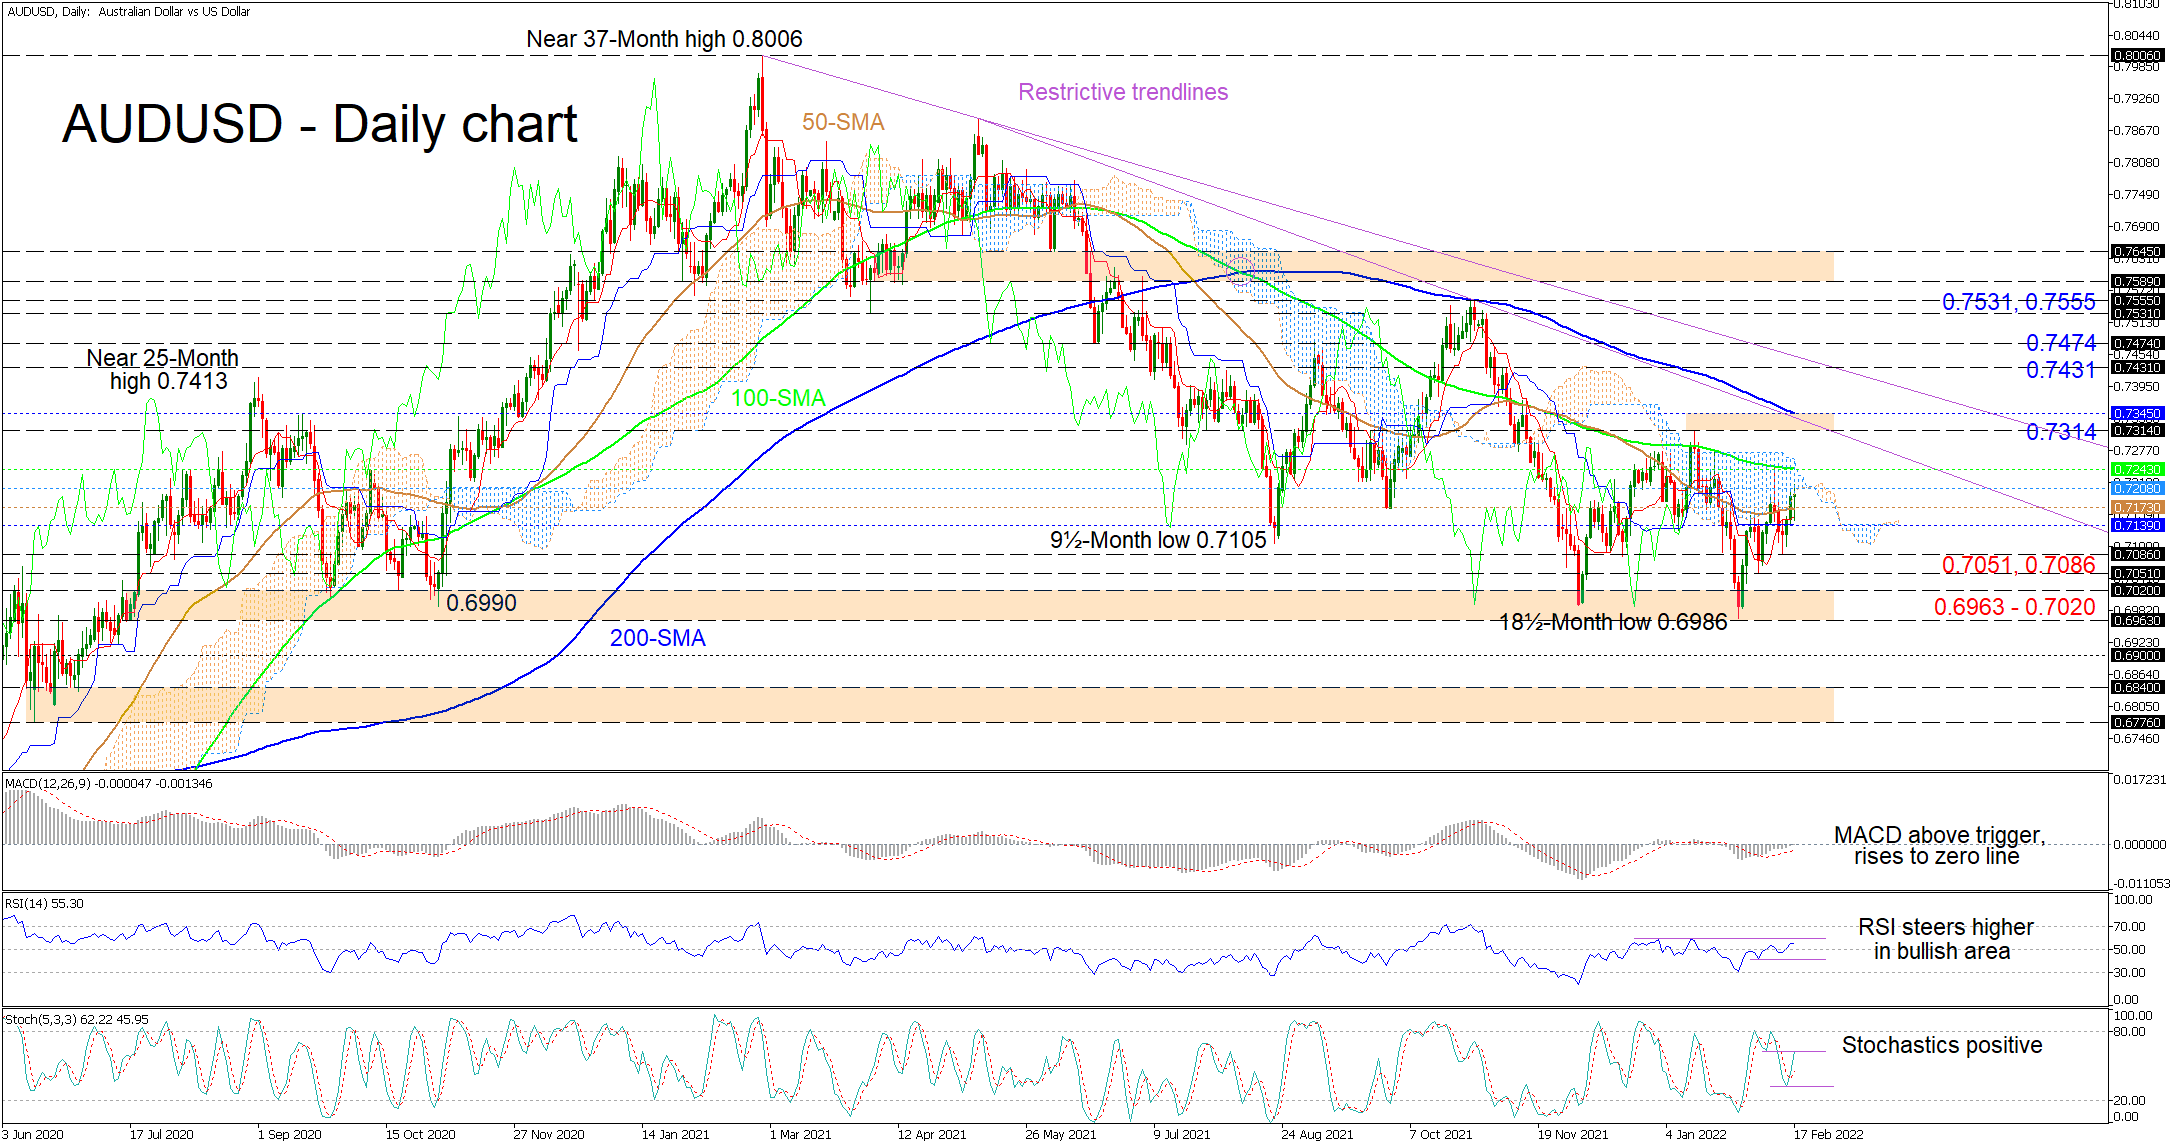
AUDUSD is struggling to stretch north of the Ichimoku cloud and the 100-day simple moving average (SMA) after the price bounce within the 0.6963-0.7020 base. The SMAs are endorsing a bearish bias in the pair with the 100- and 200-day SMAs specifically safeguarding the one-year decline from the three-year peak of 0.8006.
Currently, the Ichimoku lines do not reflect strong driving forces, while the short-term oscillators convey a picture where positive momentum is gaining strength. The MACD is holding above its red signal line and looks set to nudge above the zero barrier, while the RSI is improving above its 50 neutral threshold. The positively charged stochastic oscillator is promoting upside price action.
If the immediate zone from the cloud at 0.7208 until the 100-day SMA at 0.7243 fails to defuse buying pressures, the bulls could target the 0.7314-0.7345 fortified resistance barricade, which is overlapped by a potential restrictive trend line drawn from the May 2021 high of 0.7890. In the event buyers overcome this barrier, they may then be encouraged to tackle the 0.7431 high and 0.7474 barrier, where another descending line - pulled from the 0.8006 peak - intersects.
If upside impetus diminishes, an initial support section could arise from the 50-day SMA at 0.7173 until the blue Kijun-sen line at 0.7139. If buyers are unable to generate positive traction in this zone, the price may then dip to test the 0.7086 and 0.7051 lows respectively, before sellers challenge once again the 0.6963-0.7020 foundation that has held since July 2020.
Summarizing, AUDUSD continues to exhibit a steady bearish trajectory beneath the longer-term 100- and 200-day SMAs at 0.7243 and 0.7345 respectively, and the 0.7314 high. That said, if the price triumphs north of the 0.7474 barrier, the optimistic outlook in the pair may be tested by the 0.7531 and 0.7555 nearby highs.
Markets Rattled by Reports of Shelling in Ukraine
- Reports of skirmishes on Ukrainian border revive the geopolitical trade
- Stocks cannot sustain boost from Fed minutes, oil and gold recover
- Dollar and yen come back to life, risk sentiment in the driver's seat
Ukraine conflict heats up
Geopolitical worries have taken investors on a wild roller coaster ride this week, which is still going. The tranquility that markets enjoyed yesterday came to an abrupt end after Russian-backed separatists in Ukraine accused government forces of opening fire on them. Ukraine’s military quickly denied that, saying it was the rebels who shelled them instead.
The reports breathed some life back into the geopolitical trade, but there was no sense of panic in the markets. In fact, most asset classes erased the initial move, with the dollar even trading lower at some point, until a European watchdog confirmed that shelling incidents had indeed taken place. That pushed Wall Street futures back into the red as risk aversion intensified.
Commodity markets are the most nervous. Whereas the moves in the FX space and stocks were relatively small, energy and gold prices stormed higher, with gold bulldozing its way to new eight-month highs as investors took shelter in the world’s oldest safe haven. Bullion seems to have reclaimed its status as the ultimate geopolitical hedge, outshining both government bonds and the Japanese yen in this unstable environment.
What’s next?
Markets will remain hostage to incoming headlines until there is some clarity on the situation. Tensions are clearly at a boiling point and anything can happen.
That said, it’s difficult to see what Putin’s endgame would be from an actual invasion. Threatening to invade has its merits in terms of keeping Ukraine under Russia’s sphere of control, but actually invading means suffering crippling economic sanctions and giving NATO a concrete excuse to position even more aggressively.
In other words, the risk/reward for Russia from an invasion doesn’t seem very attractive here. If this turns out to be a grand exercise in political muscle flexing, the ‘Ukraine trade’ - long energy and gold, short stocks - might be gradually unwound. Of course, that point may still be far away and things could get uglier before they get better.
Markets dial back Fed bets
Over in the economics arena, bets for aggressive Fed rate increases were dialed back a notch following the FOMC minutes. Admittedly the minutes were pretty ‘vanilla’ in the sense that they didn’t reveal anything new and it was really the absence of any discussion about a 50 basis points move in March that investors focused on.
The catch is that this meeting took place before the latest blockbuster jobs report and the scorching hot inflation print, so the argument for tighter monetary policy has only strengthened since then. As for the dollar, defensive flows are currently overshadowing monetary policy, a dynamic that could persist until geopolitical concerns ease.
It’s a similar story across the FX market as the Ukraine conflict remains the most important variable for both the euro and the yen, as well as the commodity-linked currencies. Central banks have taken a back seat and risk appetite is the name of the game. Expect more twists and turns before markets go back to trading economics.
As for today, there isn’t much on the agenda. We will hear from ECB chief economist Philip Lane at 14:00 GMT before the Fed’s biggest hawk, James Bullard, steps up to the rostrum at 16:00 GMT. In Turkey, the central bank is widely expected to keep interest rates unchanged despite annual inflation running at almost 50%.
Gold Rallies Amid Soaring Inflation
Gold rallies amid soaring inflation
Gold has broken out to reach its best level since June. The metal has found support from several major sources. These include: (1) heightened geopolitical risks and stock market volatility; (2) falling real yields, and more to the point (3) soaring inflation.
Indeed, the number one source of support for gold is rising price levels around the world as investors seek to protect their purchasing powers from being eroded by depreciating fiat currencies. Inflation has reached multi-decade highs around the world, and a record high in Eurozone. Although soaring inflation has raised concerns about policy tightening from the Fed and other major central banks, this has been offset by the fact real yields haven fallen sharply, boosting the appeal of non-interest-bearing assets like gold. The real yield on the 10-year note is around -5.5%, which has been derived from 2% nominal yield minus 7.5% CPI inflation. This means that real yields will not move into the positive territory with a bit of policy tightening, without a sharp fall in nominal inflation rate.
Meanwhile, gold’s breakout comes despite Tuesday’s sharp drop when there was apparently some de-escalation of geopolitical tensions surrounding the Ukraine situation. That drop suggested gold had been at least partially supported by haven flows. This view has been re-enforced amid fresh concerns about the situation there. Ukraine has said that some Russian-backed forces fired shells at a village in Luhansk region. EU's Von der Leyen has added that: “We hear claims from Russia about pulling back troops from Ukraine's border but we have not seen any sign of de-escalation on the ground,” and that it has been adding even more soldiers to the military build-up.
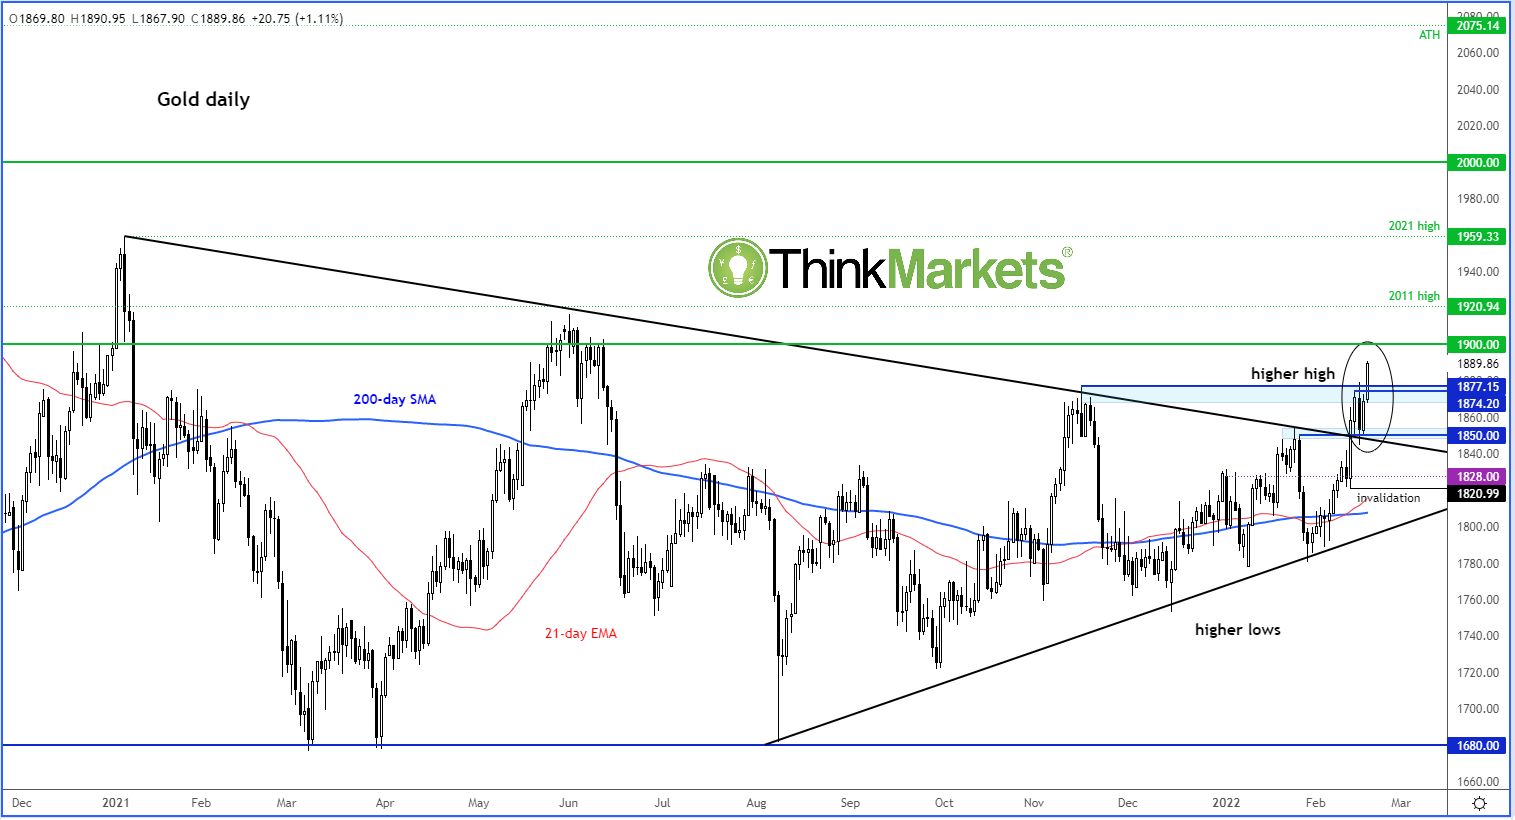
The precious metal’s breakout from its long consolidation inside the triangle means the bulls have come out on top and those who were waiting to see which direction the metal would head to are now likely to join the buyers.
Source: ThinkMarkets and TradinView.com
The sellers are likely to move out of the way as they have lost the battle. What this means is that we might see some sharp gains and already that has been the case. Next up is the psychologically-important $1900 level on the bulls’ radar. Beyond this level, $1920 is the next target, last year’s high.
Support comes in around $1875 area, give or take a few dollars. This area was the previous resistance zone, which has now been broken.
Aussie Shrugs after Positive Jobs Report
Australia’s employment report for January was better than expected, but the Australian dollar didn’t respond to the positive news. The economy added 12.9 thousand jobs, beating the consensus of a flat zero reading. Unemployment was unchanged at 4.2%, while the participation rate inched upwards to 66.2%, up from 66.1% and above the consensus of 66.0%. The rise in the participation rate, although small is an encouraging sign.
Is the RBA in the midst of a hawkish pivot? Governor Lowe has long insisted that the central bank will not raise rates in 2023 (or later), but low unemployment and rising inflation have a way of causing central bankers to shift stances, as Jerome Powell and Andrew Bailey can attest. On Wednesday, Deputy Governor Guy Debelle told a Senate committee that the cash rate could go up in the next 12 months, but such a move was not “inevitable”. The markets have priced in a lift-off in rate hikes before the end of the year, and I would not be surprised if RBA policymakers continue to sound more hawkish about policy.
Fed plans to hike, reduce balance sheet
The Federal Reserve minutes indicated that plans to tighten monetary policy continue. Officials indicated that interest rates are coming soon, strongly hinting that lift-off will take place in March. As well, the Fed plans a significant reduction in the balance sheet, which has ballooned to nine trillion dollars as a result of aggressive bond-buying in an effort to stimulate growth during the Covid pandemic. The Fed will end its QE programme in March as scheduled, although some members at the Fed meeting wanted to wind up the program earlier.
The markets continue to keep a worried eye on events on the Russia/Ukraine border. The White House is disputing the Russian claim that it has moved forces away from the border, and there were reports earlier today that Ukrainian forces had shelled a region that is Ukrainian territory but controlled by Russian separatists. This report has dampened risk appetite and pushed the US dollar slightly higher.
AUD/USD Technical
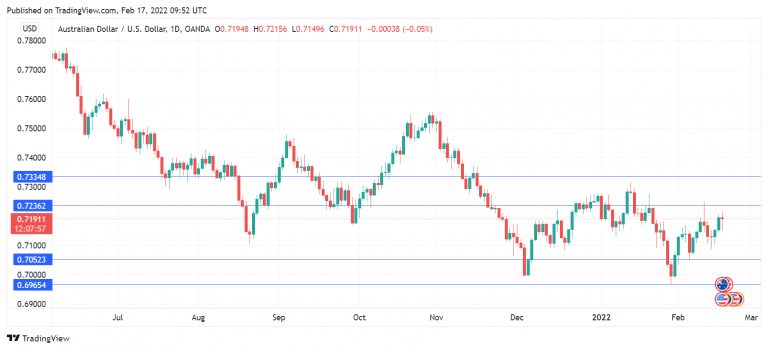
- AUD/USD continues to rally and is testing resistance at 0.7168. Above, there is resistance at 0.7258
- There is support at 0.6987 and 0.6896
AUDUSD Selling The Bounce At Extreme Area
In this technical blog, we will look at the past performance of 1 hour Elliott Wave Charts of AUDUSD. In which, the decline from 13 January 2022 high unfolded as an impulse sequence and showed a lower low sequence. Therefore, we knew that the structure in AUDUSD is incomplete to the downside & should see more weakness. So, we advised members not to buy the pair & sell the bounces in 3, 7, or 11 swings at the blue box areas. We will explain the structure & forecast below:
AUDUSD 1 Hour Elliott Wave Chart
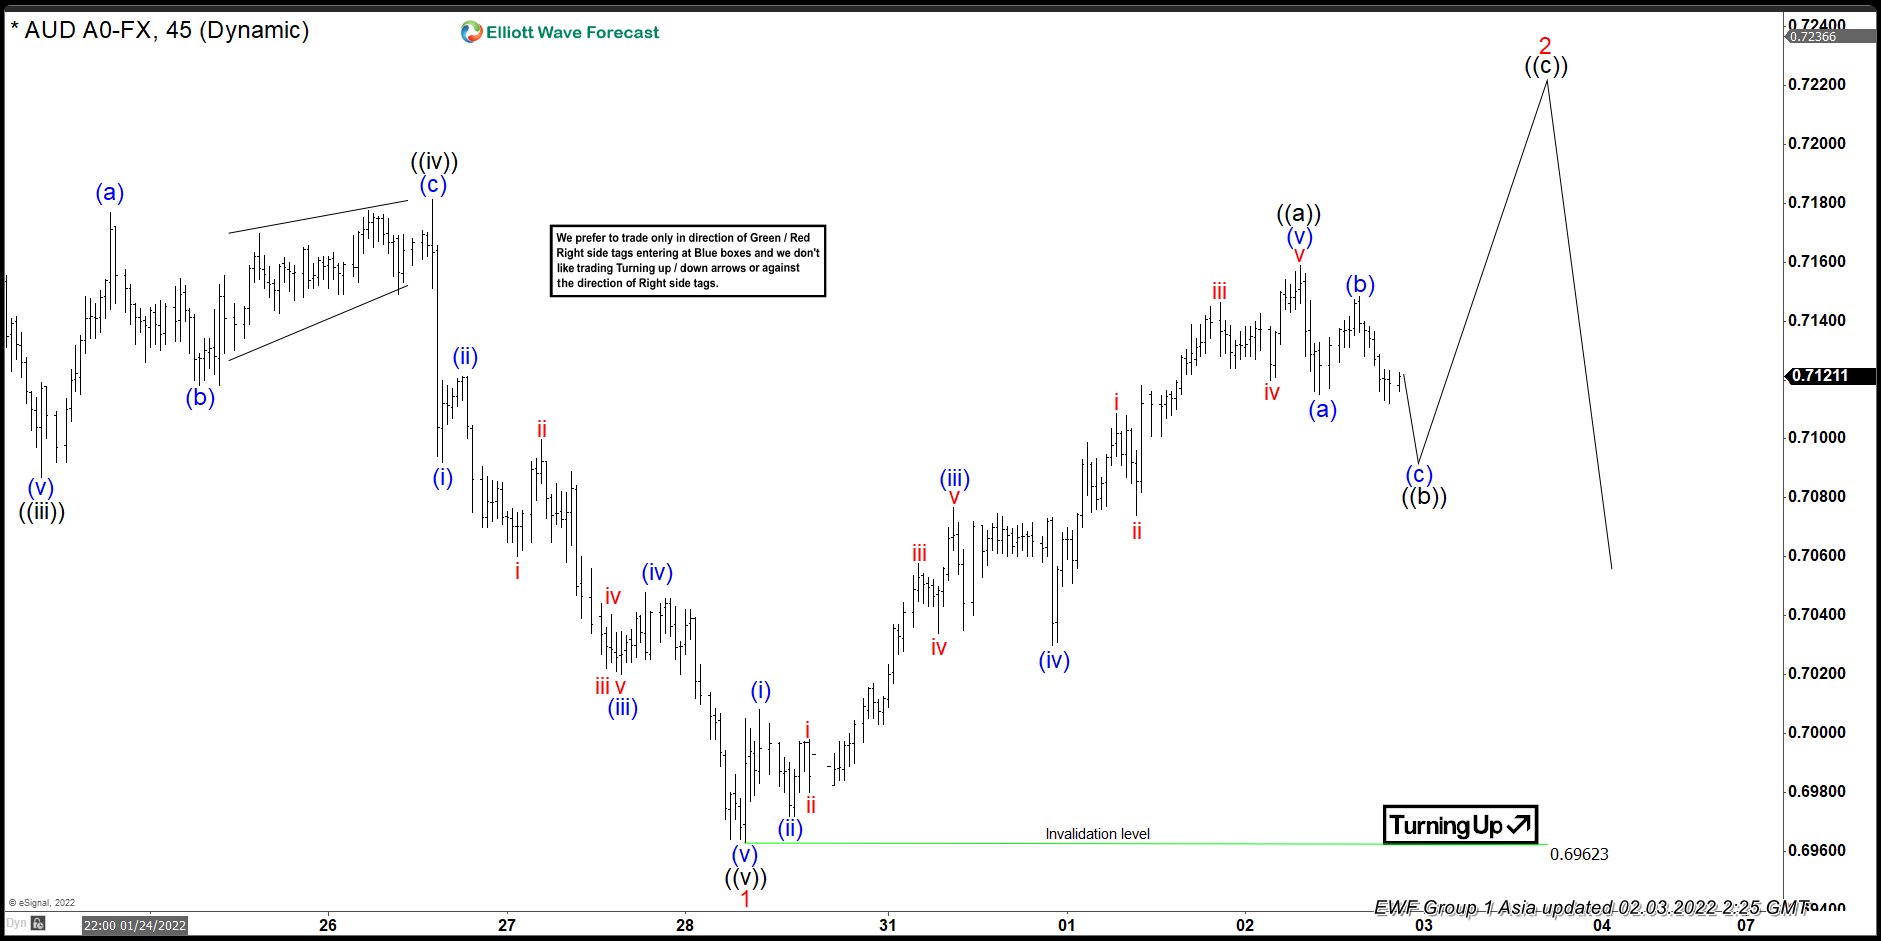
Here’s 1hr Elliott wave Chart from the 2/03/2022 Asia update. In which, the decline to $0.6963 low ended 5 waves from 1/13/2022 high in wave 1 & made a bounce in wave 2. The internals of that bounce unfolded in a lesser degree 5 wave impulse sequence, which suggested that it’s a continuation pattern & it should see another leg higher to complete the Elliott wave zigzag correction before the pair gets ready to turn lower.
AUDUSD 1 Hour Elliott Wave Chart
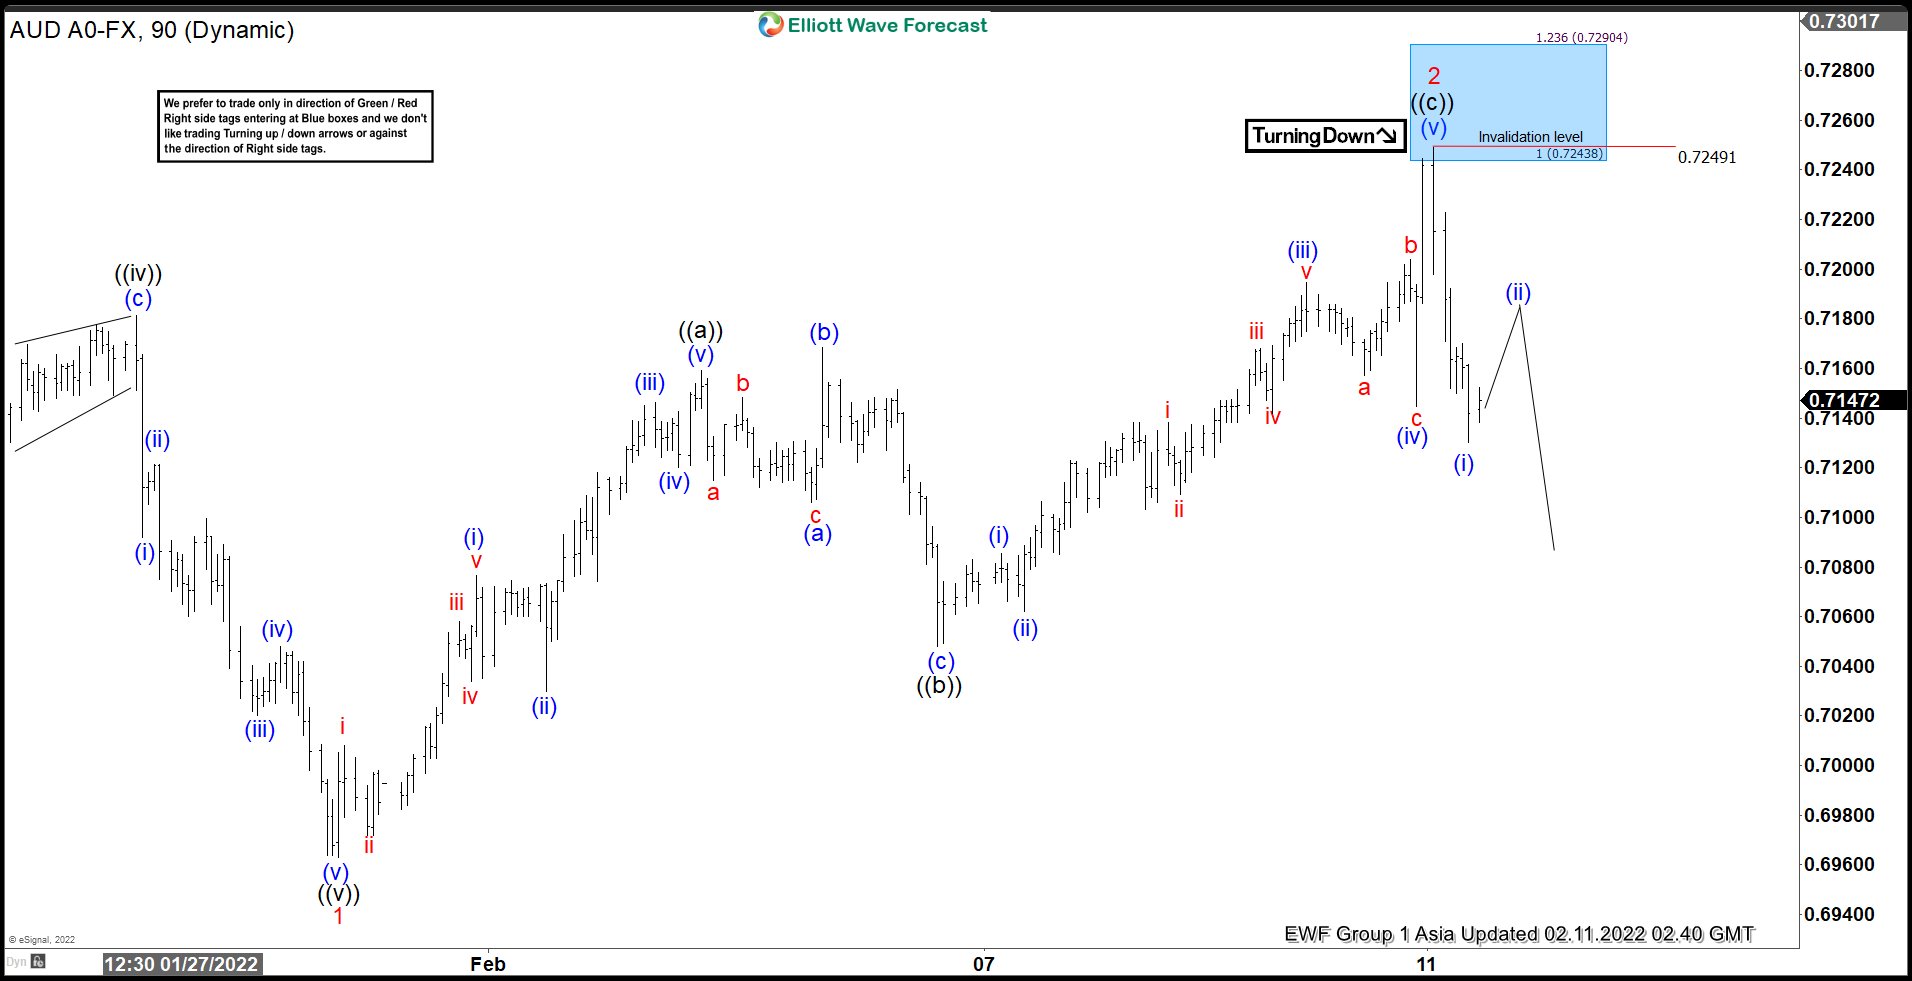
Above is the 1hr Elliott wave chart from the 2/11/2022 Asia update. In which, the pair continued the bounce higher & managed to reach the extreme $0.7243- $0.7290 blue box area. From there, the pair got rejected & found sellers as expected. Since then the pair has made a good reaction lower & already retraced more than 50% of the whole bounce allowing members to create a risk-free position shortly after taking the longs.
AUDUSD Latest 1 Hour Elliott Wave Chart
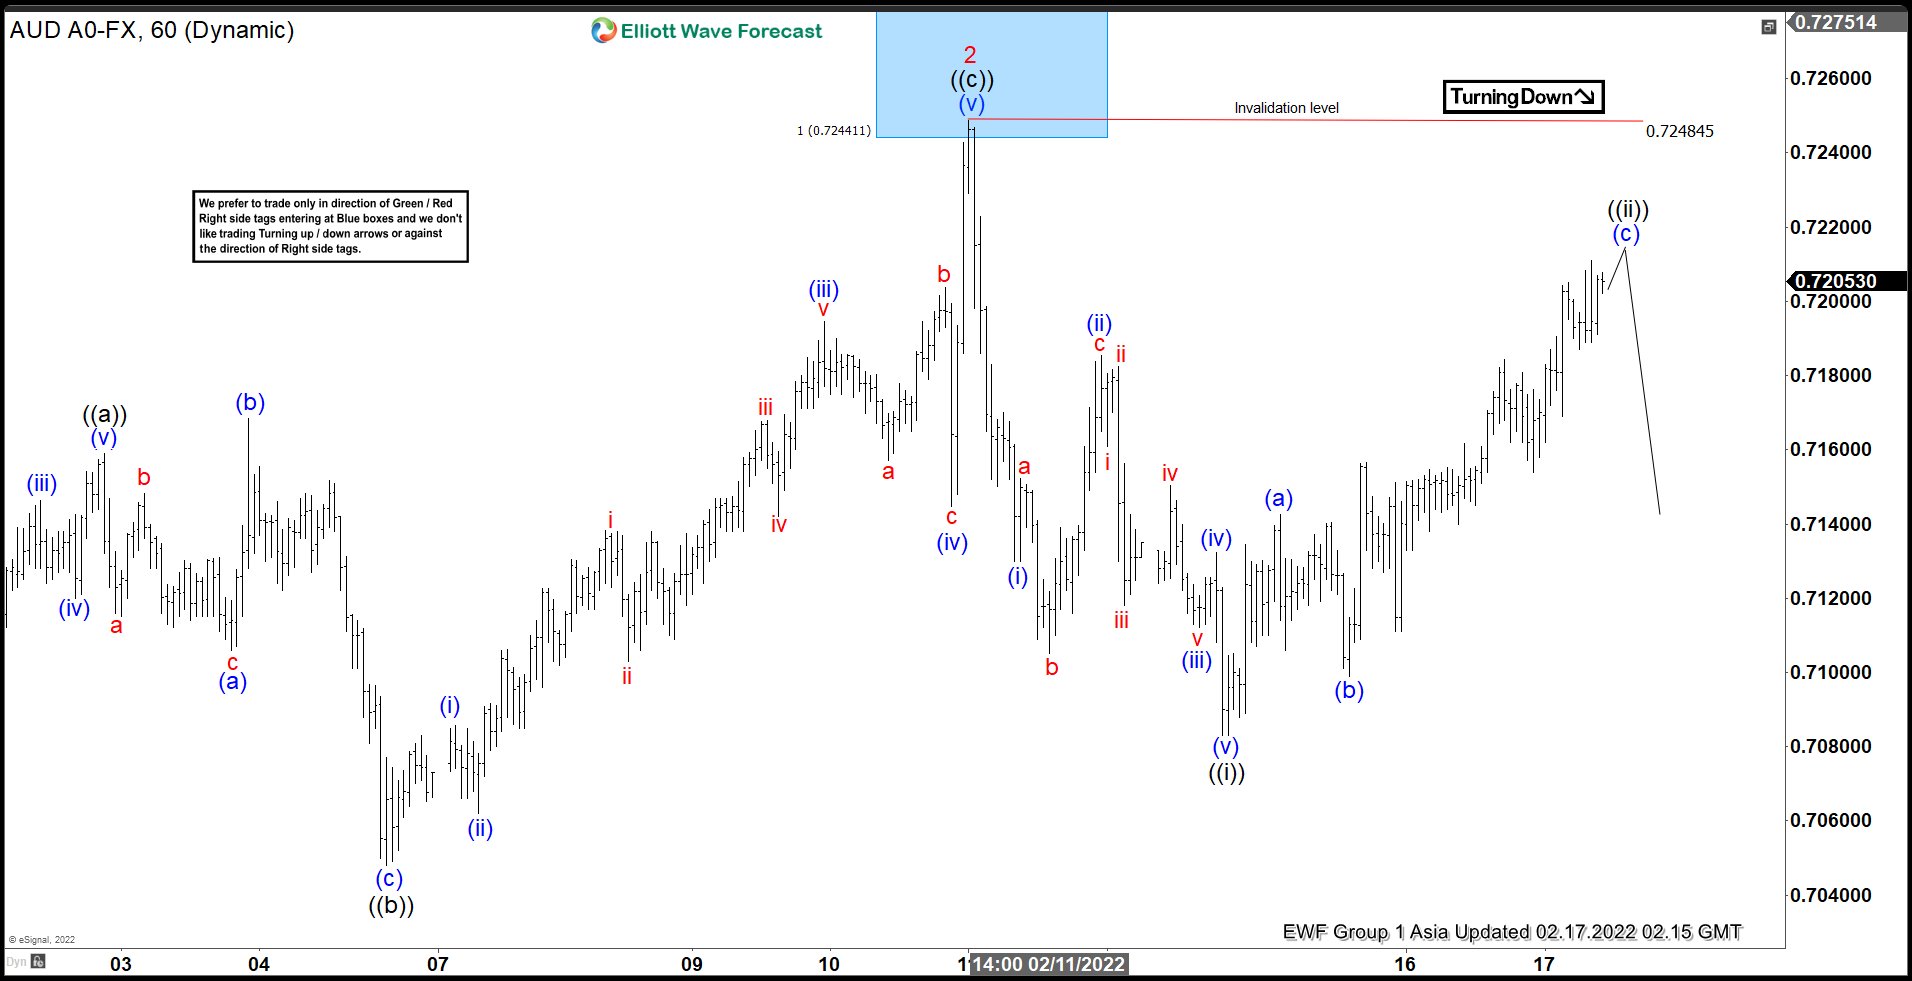
This is the latest 1hr view from the 2/17/2022 Asia update. In which the pair is showing reaction lower taking place as expected so far. Now as far as bounces fail below $0.7248 high then the pair is expected to resume lower. However, a break below $0.6963 level remains to be seen to confirm the next leg lower & avoid double correction higher.
WTI Oil Futures Defend Uptrend, But Signs of Weakness Emerge
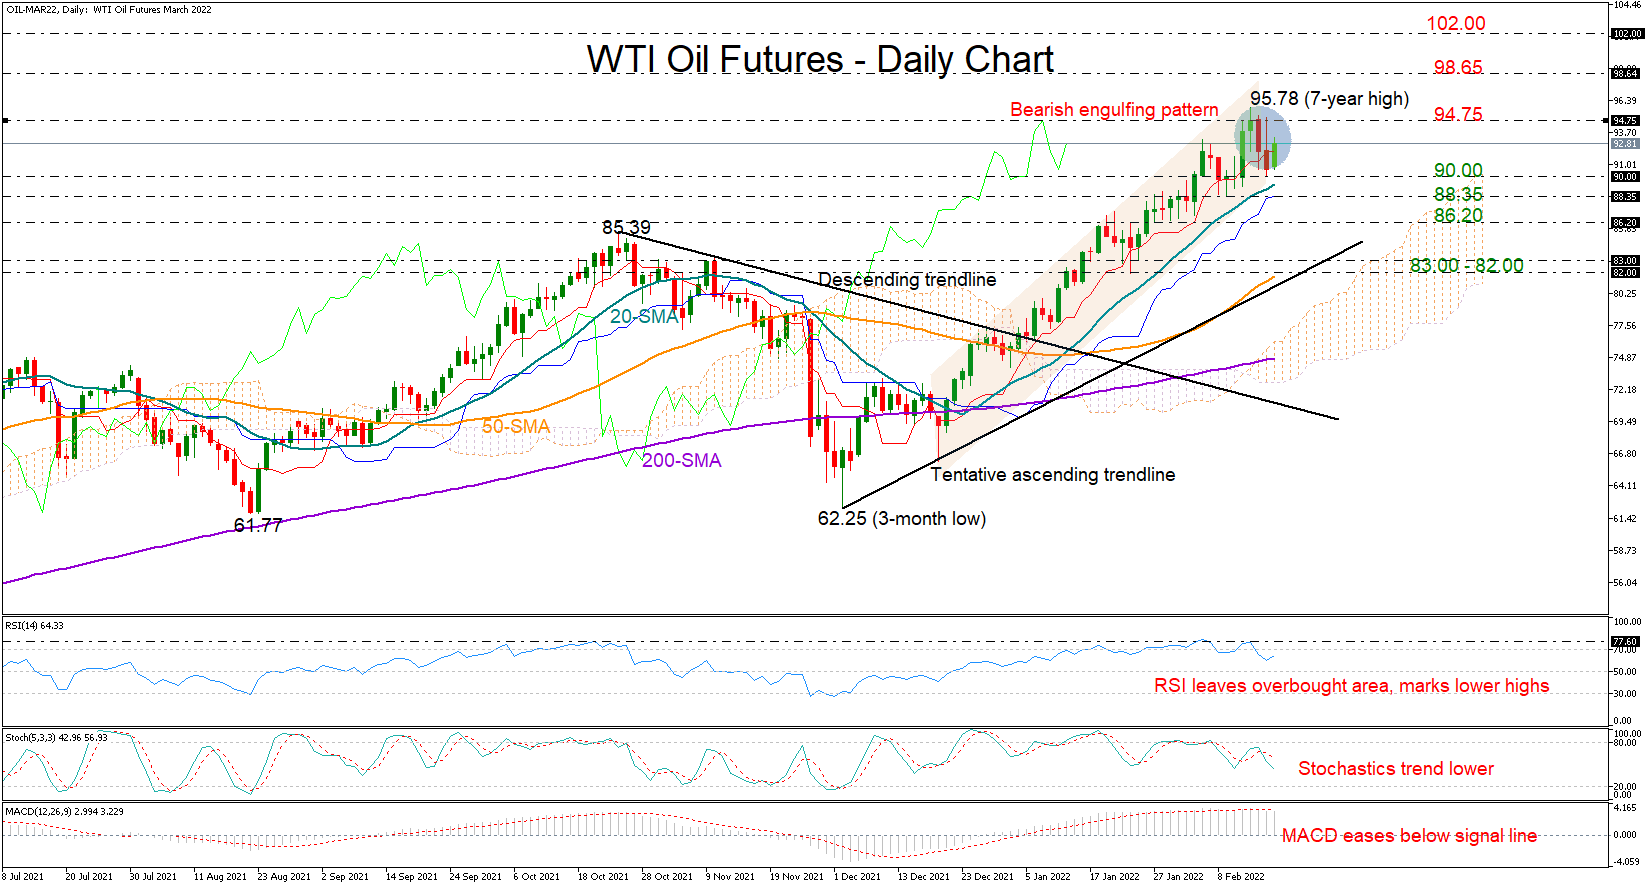
WTI oil futures (March delivery) drifted higher during the early European trading hours on Thursday in an attempt to pare the two-day losing streak which stalled around the 90 level.
The market is still in a clear uptrend so far this year, keeping its bullish outlook well intact. But some discouraging signals are becoming evident in the very short-term picture. First, the price closed below the red Tenkan-sen line on Wednesday, which has been supporting the market since the start of January. Secondly, the candlestick structure following the peak at a 95.78 on Monday reminds of a bearish engulfing pattern – a signal that sellers are overtaking buyers and therefore lower prices are to come. It’s also worthy to note that the momentum indicators have already printed lower highs, with the MACD easing below its red signal line.
Nevertheless, bearish actions could remain constrained and temporary unless the price dips below the 90.00 number to close beneath the key 88.35 handle. If that is the case, the decline could lengthen towards the 86.20 support region, where any violation could squeeze the price towards the 83.00 – 82.00 zone.
On the flip side, if the bulls defend the uptrend above 90.00, traders will be eagerly waiting for a break above the 94.75 resistance before they target the 98.65 barricade, which has been limiting downside and upside movements during the 2011 – 2014 period. Additional gains above the latter may stall within the 100.00 – 102.00 restrictive area.
In brief, although the uptrend in WTI oil futures remains well established, there are some signs that the bulls are losing energy. Yet only a significant move below 88.35 could confirm that.
US 500 Battles With 200-SMA as Bias Turns Cautiously Bullish
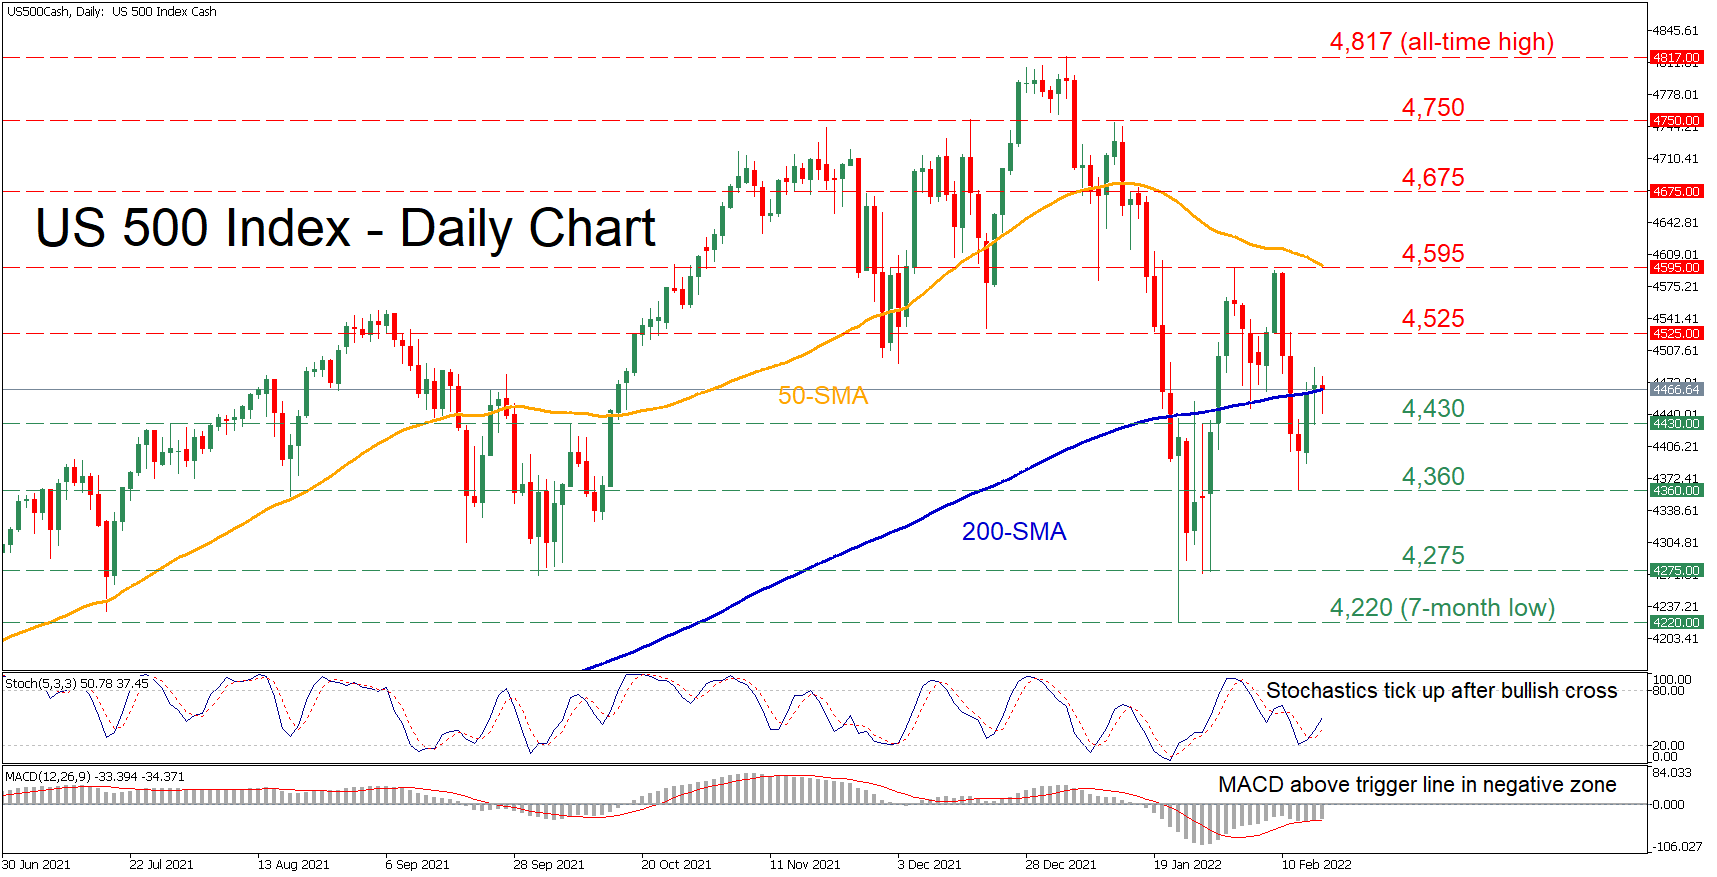
The US 500 stock index (cash) has been in a recovery mode since its short-term decline halted at the seven-month low of 4,220. Although the index’s upside move experienced a minor pullback, the near-term picture seems to be improving and the price is currently pivoting near its 200-day simple moving average (SMA).
The momentum indicators further confirm that bullish forces have re-emerged. The stochastic oscillator is sloping upwards after posting a bullish cross, while the MACD histogram is found above its red signal line but beneath zero.
Should the positive momentum strengthen, and the price profoundly jumps above its 200-SMA, initial resistance could be encountered at the 4,525 barrier. If the upside pressure persists, the price may climb towards the 4,595 hurdle, which overlaps with the 50-day SMA and rejected three price advances in the last month. Crossing above this region, the spotlight could turn to the 4,675 level, a violation of which would set the stage for 4,750.
Alternatively, if sellers retake control and push the index lower, the recent low of 4,430 could act as the first support region. Should the price breach this level, the bears might aim for the 4,360 obstacle. Piercing through this barricade, the price could descend towards 4,275 before it challenges the seven-month low of 4,220.
Overall, the US 500 index seems to be struggling to jump above its 200-day SMA, but immediate-term bias is improving. However, a clear break above 4,595 is needed to signal the resumption of the index’s short-term rebound.