Sample Category Title
US Oil Shows Signs of Over-extension
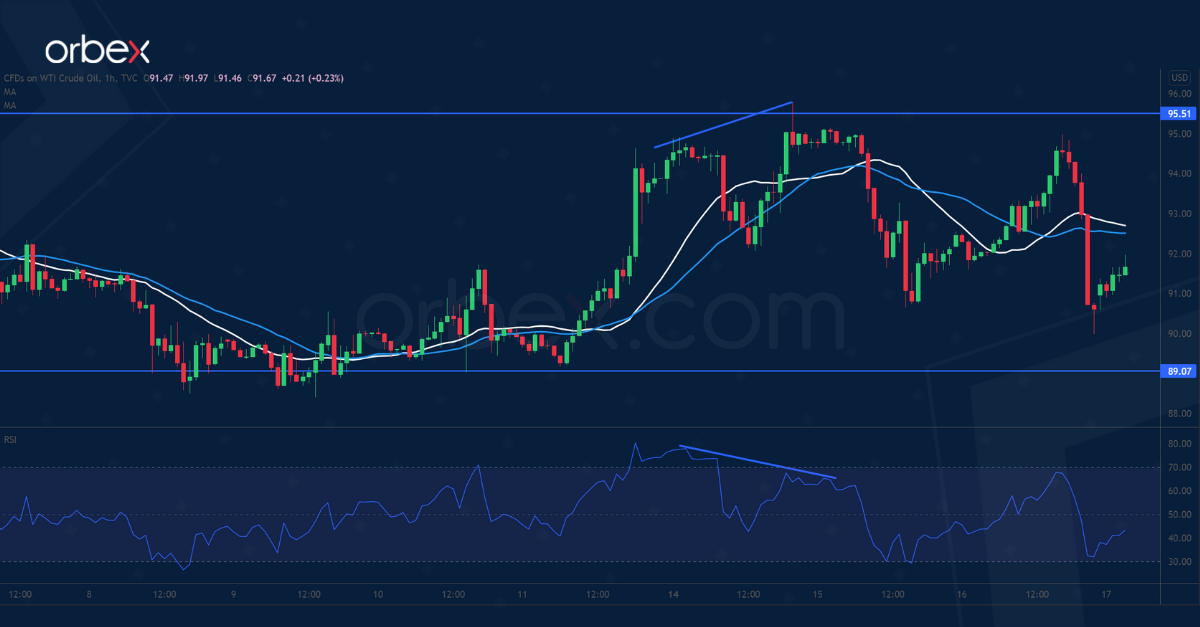
Oil prices faltered after a surprise rise in US inventories. WTI hits resistance at September 2014’s high (95.50).
The RSI’s repeated overbought situation on the daily chart may restrain the bullish fever. A bearish RSI divergence on the hourly time frame indicates a loss of momentum in the short term. 89.10 is the closest support that sits along the 20-day moving average.
Buyers could be waiting to enter at pullbacks. A deeper retreat could trigger a sell-off towards 84.00, which is a demand zone from January’s breakout.
GBP/CHF Attempts Breakout
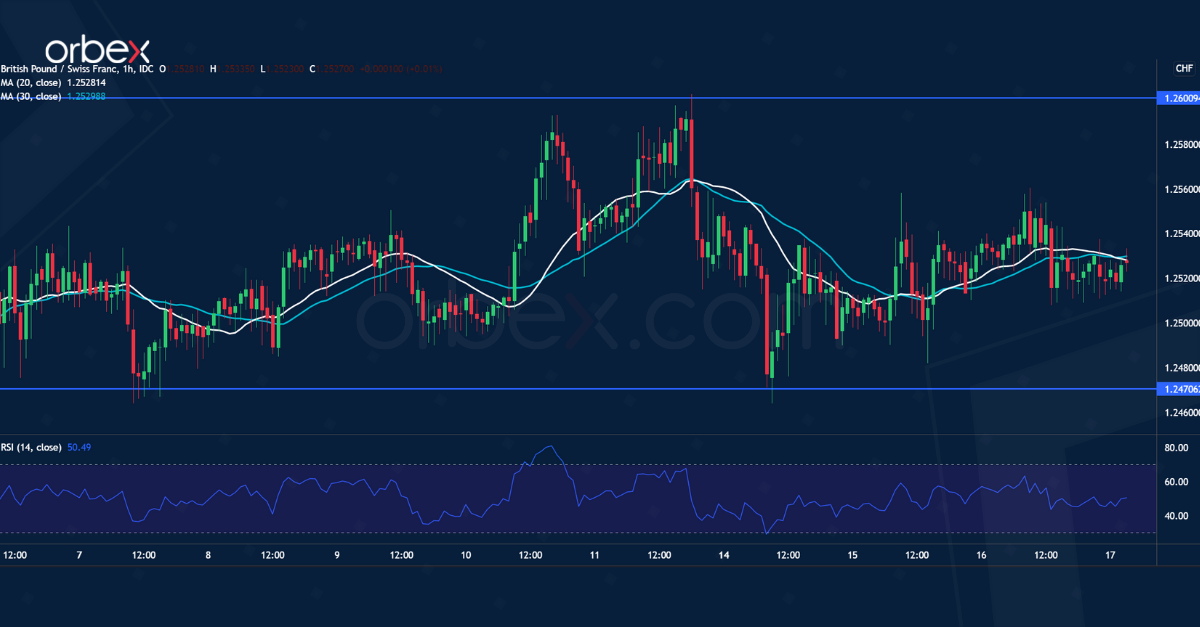
The sterling finds support from upbeat readings in the UK’s CPI and retail sales.
The rally came under pressure in the supply zone around 1.2600. A retreat below 1.2500 has shaken out some weak hands but the sentiment remains upbeat. A subsequent bounce off the demand zone (1.2470) suggests solid interest in keeping the pound afloat.
A break above the said resistance would trigger momentum buying and open the door to last October’s high at 1.2760. On the downside, a deeper retracement would test the next support at 1.2380.
USD/CAD Struggles for Support
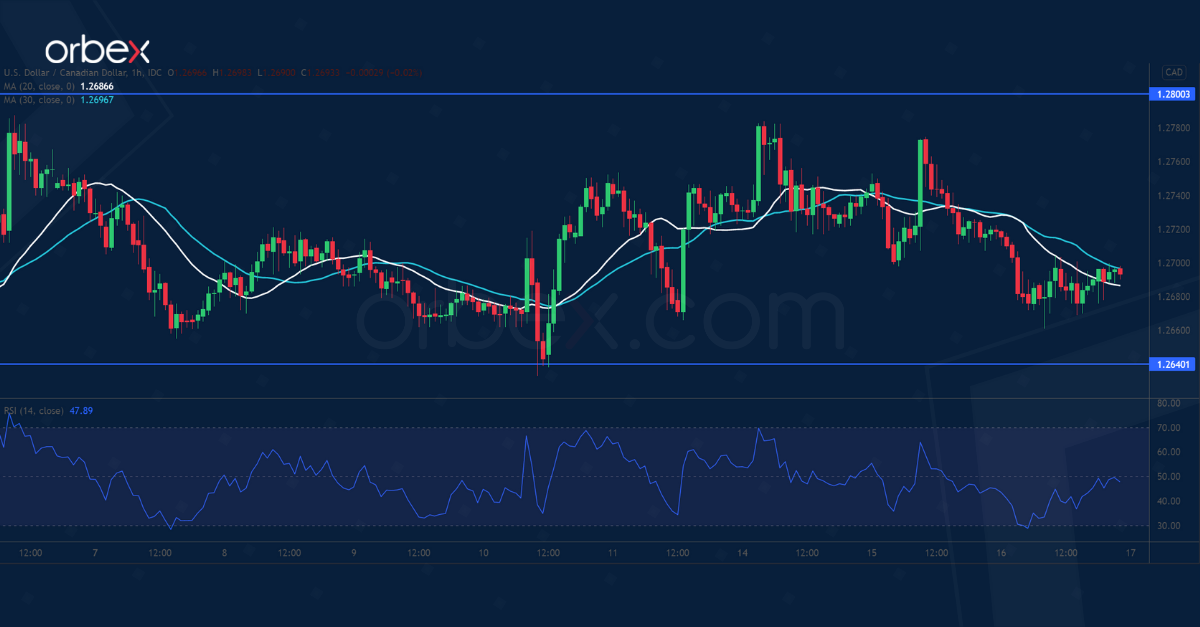
The Canadian dollar rose after January’s CPI exceeded expectations. The recent triple top near 1.2800 at the origin of the January sell-off is a sign of strong bearish pressure.
A combination of profit-taking and new selling means that sentiment is yet to make a decisive turnaround. The bulls will need to push past this major daily resistance before the US dollar could recover to 1.2960.
Failing that, a drop below the lower band (1.2640) of the current consolidation range would bring the pair to 1.2560.
Daily Technical Analysis
EUR/USD
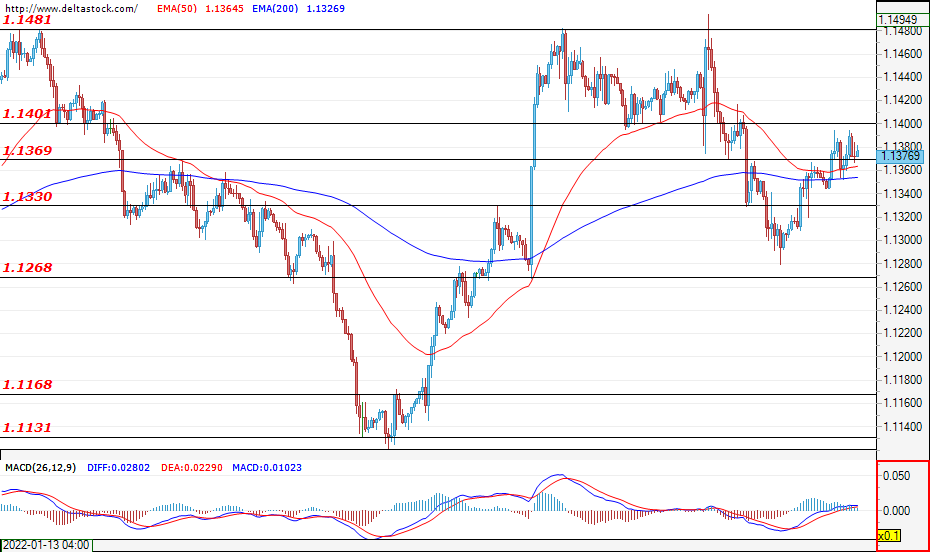
Trading remains limited below the psychological level of 1.1400 as the bulls still cannot gain enough momentum to violate this zone. The expectations for today’s trading session are for the bears to re-enter the market and lead the pair towards a test of the support at 1.1330.. If this proves to be the case and the mentioned support succumbs to the bearish pressure, then the pair will most likely head towards the level at 1.1268. Only a breach of the resistance at 1.1400, however, may be considered a signal for an upward movement towards the critical resistance at 1.1480. Today, an increase in market volatility can be expected around the announcement of the initial jobless claims for the United States at 13:30 GMT.
USD/JPY
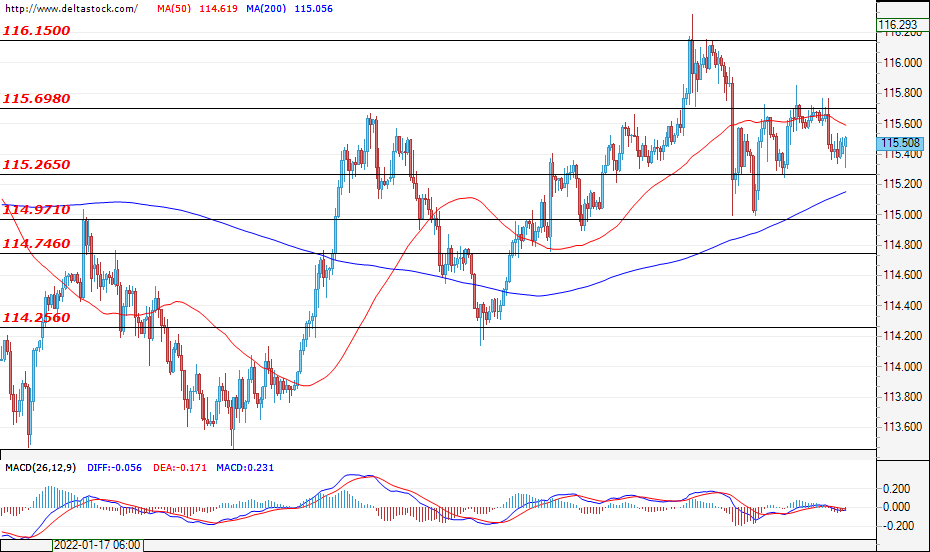
The resistance level at 115.70 is still holding off the bulls and the currency pair continues to trade in the range of 115.26 – 115.70. If the USD/JPY manages to breach the support at 115.26, then it would most probably head towards a test of the support at 114.97. However, before there is a confirmed breach of either border of the range, trading activity would most probably remain in the channel of 115.25 – 115.70. At the time of writing, the expectations are for the bears to take control over the market and lead the pair towards a test of the support zone at 114.76.
GBP/USD
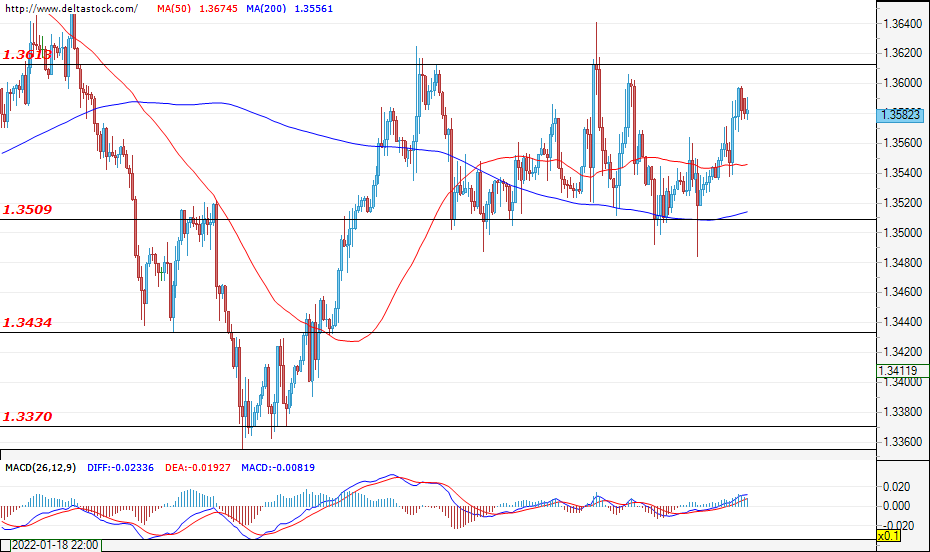
The currency pair is still in а consolidation phase in the range of 1.3500 – 1.3600 and the bears cannot yet gain enough momentum to breach the critical support at 1.3500. However, the expectations are for the bears to take control over the market and to violate the mentioned support. A successful breach of this level may pave the way for the pair towards the next support zone at 1.3434 coming from the higher time frames. In an alternative scenario, in which the bulls prevail, the market may once again test the resistance level at 1.3600.
EUGERMANY40
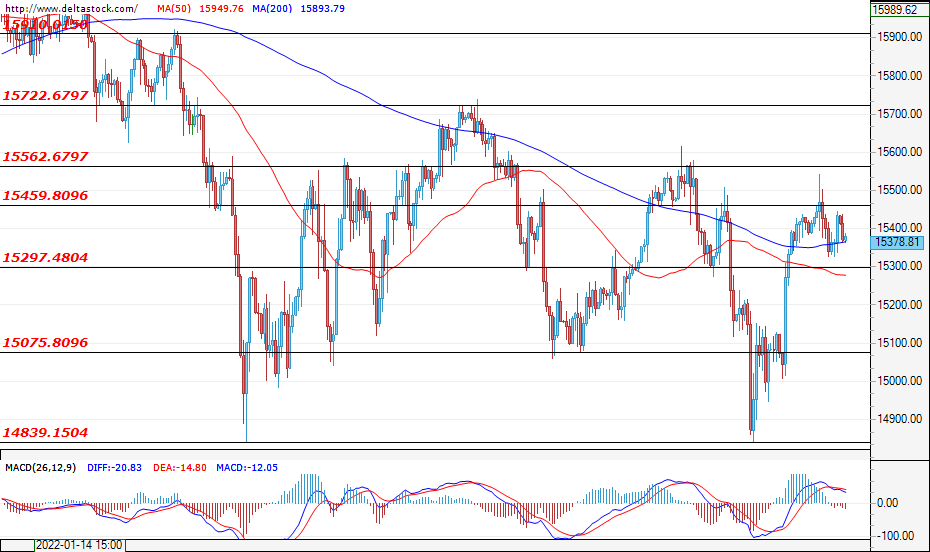
The strong rally of the German index was limited to just below the resistance at 15460 as the bulls couldn’t gain enough momentum to violate this zone. The sentiment is rather negative – for a depreciation of the index and a test of the support at 15297, where a breach of this level would most probably lead to sell-offs towards the support at 15075. Only a confirmed breach of the resistance at 15460, however, would lead the price towards the next resistance level at 15562. During today’s session, the situation in Ukraine will continue to dictate the market sentiment and sharp moves in either direction can be expected.
US30
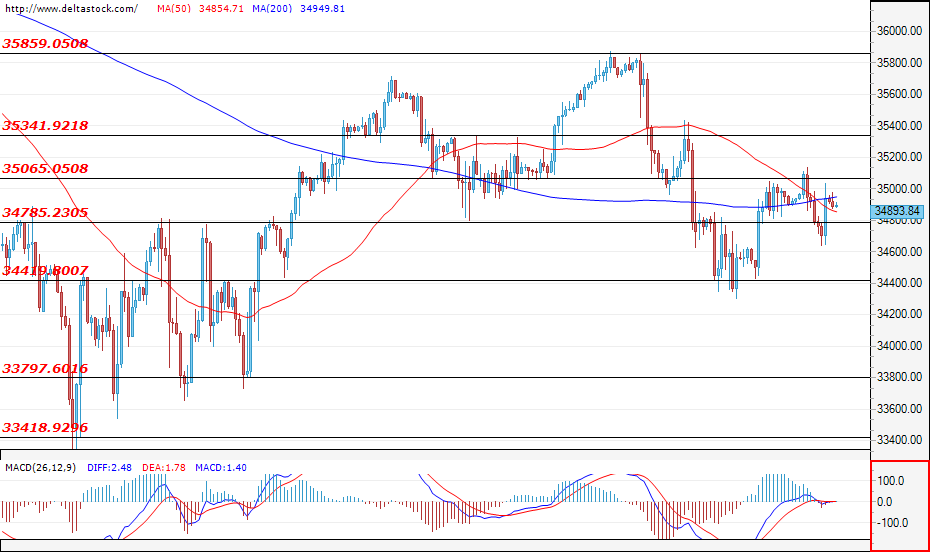
The resistance level at 35065 manages to hold off bulls’ attacks, and at the time of writing this analysis, the price of the index is in a slight decline. The expectations are for the sell-offs to deepen, heading the price towards a test of the support at 34420, where a possible breach of this level would most probably lead the index towards a test of the critical support at 33800. Alternatively, if the bulls return to the market, then we could easily witness a test of the resistance at 35340.
Crude Oil Jumps as Supply and Demand Imbalance Continues
The US dollar was little changed in the overnight session after the latest US retail sales numbers and the Federal Reserve minutes. According to the country’s statistics agency, retail sales jumped by 3.8% in January after slipping in December. That was the biggest increase since March last year. The numbers signaled that Americans were willing to spend even as the prices of most items soared in January. Last week, data by the Bureau of Labor Statistics showed that the headline consumer price index soared to the highest level in more than four decades. The dollar also reacted to hawkish minutes by the Fed.
US stocks declined on Wednesday as the market continued to focus on the crisis in Europe. While Russia has started moving some of its troops from its border with Ukraine, Nato confirmed that the country was adding more people and equipment. The assessment by Nato followed another statement by Biden who warned that Russia could still attack. Some of the biggest movers in Wall Street were Wix, Roblox, ViacomCBS, Shopify, and Toast. Viacom shares declined after it delivered weak earnings and held its investor day.
The price of crude oil rose sharply in the overnight session as worries of Ukraine returned. Investors are worried that sanctions on Russia will affect oil output. While the planned sanctions don’t apply on Russia’s oil and gas sectors, they will have an impact on the sector. Russia’s oil accounts for about 10% of total global production. Prices also rose after US inventories rose last week. According to the Energy Information Administration (EIA), inventories rose by more than 1.12 million barrels after falling by 4.75 million barrels a week earlier.
Later today, the key events to watch will be the latest US housing starts, building permits, initial jobless claims, and the Philadelphia Fed manufacturing index. In Turkey, the country’s central bank will deliver its decision. Analysts expect that the bank will leave rates unchanged even as inflation rises by more than 40%.
EURUSD
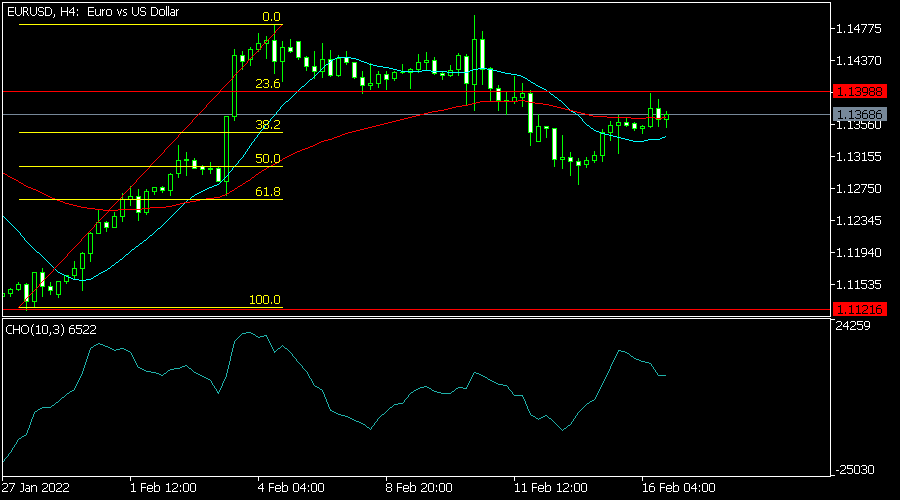
The EURUSD pair was little changed after the latest US retail sales and FOMC minutes. The pair is trading at 1.1368, which is slightly below the key resistance at 1.1400. On the four-hour chart, the pair is trading slightly above the 25-day and 50-day moving averages. It has also moved between the 38.2% and 23.6% Fibonacci retracement levels while the Chaikin oscillator has moved slightly lower. Therefore, the pair will likely resume the bearish trend today.
XBRUSD
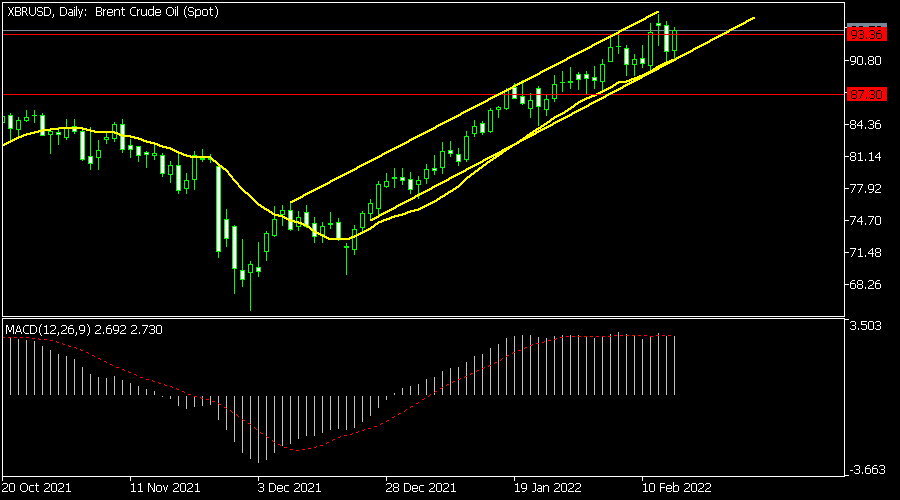
The XBRUSD pair rose to a high of 93.92 after the latest US inventories data. On the daily chart, the price has moved above the important resistance at 93.36. It has also risen above the 25-day moving average while the MACD is above the neutral level. It has also formed an ascending channel that is shown in yellow. Therefore, the pair will likely keep rising as bulls target the next key resistance at 100.
XAUUSD
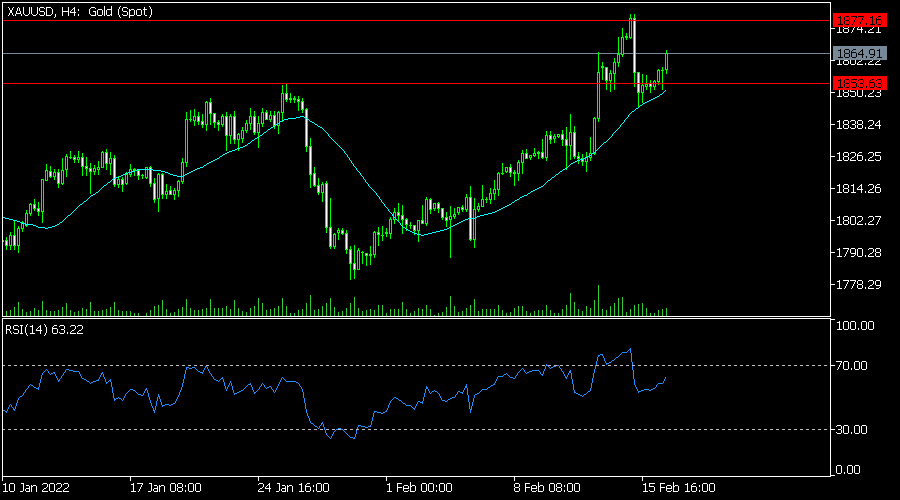
The XAUUSD pair rose as investors rushed to safe havens amid the worries about Russia. It rose to a high of 1865, which was the highest level since Monday. The pair moved slightly above the key support level at 1,853, which was the highest point in January. It also moved above the 25-day moving average. Therefore, the pair will likely keep rising as bulls target this week’s high of 1,877.
FOMC Minutes Offered Little Additional Flavour to What’s Commonly Known
Markets
FOMC Minutes offered little additional flavour to what’s commonly known. The Fed will implement a first rate hike soon and participants agreed that “if inflation does not move down as they expect, it would be appropriate for the committee to remove policy accommodation at a faster pace than they currently anticipate”. Since that January FOMC meeting, we’ve received accelerating inflation numbers and a stellar payrolls report. Markets already reacted accordingly by positioning themselves way more aggressively. This includes a cumulative 150 bps rate hikes this year with the investment community split on the magnitude of the first one: 25 bps or 50 bps. Minutes provided no details on this specific issue, nor on the timing/pace of the balance sheet reduction.
The front end of the US yield curve outperformed in the wake of the Minutes. The long end steadied after failing to react to stronger US retail sales earlier on the day. Both strengthen our call that we are up for a period of consolidation/correction in core bonds, especially as long as risk sentiment remains fragile.
Next key eco updates in EMU and US are only due early March. The US yield curve bull steepened yesterday with yields dropping by 5.6 bps (2-yr) to 0.4 bps (10-yr). German yields lost 1.5 bps to 3.3 bps across the curve with the belly outperforming the wings. 10-yr yield spreads changes vs Germany barely moved. Greek bonds didn’t respond to comments from an ECB spokesperson who said that the eligibility of Greek bonds for refinancing tools will be reviewed in due course before their expiry in June 2022. Rumours suggested that the ECB was working to extend the measure until 2024. Greece itself hopes regaining its investment grade status next year, making the exemption no longer needed.
EUR/USD kept its slightly upward bias yesterday, closing at 1.1373 from an 1.1359 open. EUR/GBP closed at 0.8372 compared with an 0.839 open. Sterling didn’t respond to high, but more or less in line, January inflation data.
Risk sentiment/geopolitics dominates Asian dealings this morning. Luhansk separatists claim a Ukrainian violation of cease-fire rules while doubt lingers on the alleged Russian troop pullback. Japanese stock markets underperform regional peers, sliding up to 0.8%. Core bonds profit.
Today’s eco calendar contains US housing data, weekly jobless claims and Philly Fed business outlook. We don’t expect them to guide trading. A speech by ECB chief economist Lane could be the highlight after heavyweights Schnabel (cannot ignore house price surge in inflation) and Villeroy (bond buying could end in Q3) shifted towards a more aggressive inflation stance earlier this week. Such move from the uber-dove would be highly significant. Apart from Lane, all eyes will be on the fragile risk climate.
News Headlines
The Australian labour market in January resisted the spreading Omicron-variant rather well. The economy added 12 900 jobs versus expectations for an unchanged figure. The unemployment rate (4.2%) held unchanged near the lowest level since 2008. The participation rate rose slightly from 66.1% to 66.2%. Consequences of the omicron wave were visible in a 8.8% decline in the hours worked. As this effect is expected to be temporary, the odds are good for a further recovery of the labour market. The RBA has made a further improvement in the labour market, and especially a rise in wages, as key to start raising rates. Today’s data probably won’t change the RBA’s assessment in a profound way. The 2-yr (-5 bps) and the 10-yr Australian yield (-2.5 bps) this morning eased slightly, but this was mainly due to broader market move (tentative risk-off). Still market pricing slightly lowered the probability of an RBA June rate hike to about 50%. The Aussie dollar eases to trade at 0.7185.
Japan in January recorded an unadjusted monthly trade deficit of JPY 2 191bn, the biggest since January 2014. Exports growth unexpectedly slowed from 17.5% Y/Y to 8.6% Y/Y. The monthly rise in exports (SA) almost came to a standstill as the persistent impact of omicron and supply issues are slowing foreign sales. At the same time, the value of imports continued to rise at double digit numbers (39.6% Y/Y), reaching the highest amount on record ( JPY 8 523bn) due to higher costs of energy products.
Back to Safety
Good mood didn’t last long as the US didn’t let the tensions de-escalate insisting that Russia is certainly not pulling back its troops but is rather increasing its presence at the Ukrainian border. The US warning hit the investor appetite at yesterday’s session and reversed the earlier week gains in stock indices.
As a result, the safe have flows boosted gold, again. The price of an ounce is back above the $1875 mark, as crude oil is steady around the $92 per barrel. If the US doesn’t let the situation de-escalate, we could see gold hitting $1900 in the coming sessions, but the gains remain vulnerable to any relief at the Ukrainian border. And ‘no war’ is the base case scenario.
US and European futures hint at a negative start on Thursday.
Not even scared
The US equities followed up with a soft European session, but the S&P500 erased a part of losses at a late-session rally after the release of the Federal Reserve (Fed) minutes. Even though the FOMC minutes were as hawkish as expected, there was no surprise for investors who already knew that inflation is a serious problem in the US, and requires a steeper rate normalization policy and a potentially aggressive unwind of the Fed’s portfolio holdings.
Interestingly, the pricing on the fed funds front flipped to give more chance for a 25bp hike in March, instead of a 50-bp hike. According to the activity on the US sovereign bonds, the probability of a 25-bp hike went from near 40% to above 60% yesterday. But the latest rise in the US sovereigns demand is perhaps, at least partly, due to the geopolitical tensions, and may not explain the full picture regarding the Fed expectations. Therefore, the easing US yields were certainly explained by looming war risks, and not the Fed doves.
In the FX markets, the US dollar remains strong as the US dollar index is approaching the 96 mark, while the pound-dollar is eking out gains above the 1.35 mark as the high inflation in the UK keeps the Bank of England (BoE) hawks in charge of the market. The latest figures showed that the consumer prices in Britain rose by 5.5% in January, and more worryingly, the inflation expectations soared, hinting that inflation in the UK could hit 8% by April due to the rising energy costs and the tax hikes. Skyrocketing energy prices will certainly on the economic recovery, but perhaps not on the FTSE 100 which benefits from both the energy-driven inflation, and the prospects of rising interest rates.
Central Bank Signals and Geopolitical Tensions
Market movers today
The Ukraine-Russia situation continues to be a market focus, especially the mobilisation of Russian forces near the Ukrainian border, and the social media reports of skirmish on the Ukrainian border overnight, but these are unconfirmed and overnight market session has already reversed the initial risk-off. Yesterday's signs of de-escalation was the predominant view in the market session yesterday. However, the situation remains volatile and late yesterday US officials also denied the claims of Russia pulling back troops from the Ukrainian border.
In the US there are a couple of Fed speakers today, Cleveland Fed President Loretta Mester and St. Louis Fed President James Bullard. In Europe Lane gives an interview, and view of the general hawkish twist to ECB GC members, this should attract additional attention (15:00 CET).
Turkey's central bank will meet today. In line with market consensus, we expect the CBRT to keep the policy rate unchanged at 14%.
Riksbank Vice Governor Anna Breman gives a speech on the current economic situation at 09:00. Here, she may explain further her arguments for entering a reservation against the decision on asset purchases.
The 60 second overview
FOMC minutes: The key take-away from the FOMC minutes was that the Fed acknowledges that the current economic situation is very different from the last hiking cycle in 2015-18 and hence why this tightening cycle is going to be different as well, as faster tightening is needed. This means both faster and more significant QT as well as rate hikes. As Fed Chair Jerome Powell mentioned during the press conference, the committee did not discuss whether 25bp or 50bp is needed at the March meeting, but just that more tightening is needed. We would like to emphasise, however, that we received another higher-than-anticipated inflation print after the January meeting and we now expect the Fed to hike by 50bp in March and a total of 200bp over the course of the year, see Fed Update: We expect a total of 200bp rate hikes this year starting with 50bp in March, 14 February 2022.
Nordic energy dependence: We have taken a look at Nordic energy dependence. We find that energy inputs vary significantly across the Nordics. The Danish manufacturing sector runs on far less energy compared to an OECD average. The Norwegian one runs on a lot more, while Finland and Sweden are more average. Looking from the demand side, the picture is somewhat the same. For more see: A helicopter look at energy dependence, 17 February.
EU ruling: Yesterday the EU won a case against Poland and Hungary in a dispute about distribution of EU funds. With the verdict, EU can formally withhold EU funding to the two countries. Poland has been trying to break a compromise with EU over the past weeks, but has not managed to block this one. So we have to see what the response from Poland will be now.
Equities: Equity markets somewhat directionless on Wednesday, despite a packed macro- and Fed agenda. As the FOMC minutes did not contain any hawkish surprises, US recovered into the close. Risk on in sector performance as well, with value cyclicals in the lead. Energy, materials and industrials the best groups, probably fuelled by the strong retail sales numbers. S&P500 closed up 0.1%, Nasdaq -0.1%, Russell 2000 0.1% and Dow -0.2%. US futures point to a slight decline today.
FI: European yields ended 3bp lower on the day, amid strong US retail figures. Intra euro area spreads were mixed, with the pivotal point on the curve being the 10y point. After some very volatile days in the ASW spreads, we had a low volatility day where the 10y Bund ASW traded within 1bp.
FX: Yesterday's session was characterised by another set-back to the USD while reflation and commodity sensitive currencies gained. EUR/USD has now rebounded roughly one big figure over the last couple of sessions bringing the cross close to the 1.14 mark. EUR/NOK has come marginally lower to 10.10 while EUR/SEK remains in the 10.50s.
Credit: A continuation of signs of de-escalation in the Ukraine/Russia stand-off was offset by more hawkish FED signals amid inflation concerns. This resulted in mixed performance in credit spreads with Main widening marginally by 0.3bp while Xover tightened 1.3bp. The two indices ended at 66.4bp and 322.9bp, respectively. IG cash spreads widened 1.8bp and HY spreads were unchanged during the day.
Nordic macro
In Sweden, Prospera's monthly survey CET 08:00 will catch attention, even though the quarterly is given higher weight by markets and the Riksbank. The Riksbank's current, still relaxed approach is summarised by the following quote in the Monetary Policy Report: "The overall picture of long-term expectations is that they are currently close to the inflation target but should they develop unexpectedly and persistently be too high or too low, monetary policy would need to take this into account." Room for interpretations as to where the trigger level is; our guess is in the neighbourhood of 2.4-2.5%. Near term, the upside risks to 1Y expectations remain given the CPI forecasts, whereas impact on 5Y should be more limited.
Interesting day in Norway, starting with important information about wage and price expectations in Norges Bank's Q4 expectations survey. A further rise in price and/or wage expectations would indicate that capacity utilisation is continuing to increase and potentially force Norges Bank into a more aggressive stance at the March rate-setting meeting. In addition, the Q1 oil investment survey will also be unusually interesting as it includes the first estimate for 2023. Given higher oil and gas prices and the tax breaks for the oil industry in response to the pandemic, we anticipate growth in oil investment of around 10% in 2023. As a result, Norway will get a substantial boost from oil investment next year. It is also time for central bank governor Olsen to give his last annual address before retiring. The content of these speeches is normally fairly structural, but in times like these, we will look closely for any signals on current monetary policy as well.
Technical Outlook and Review
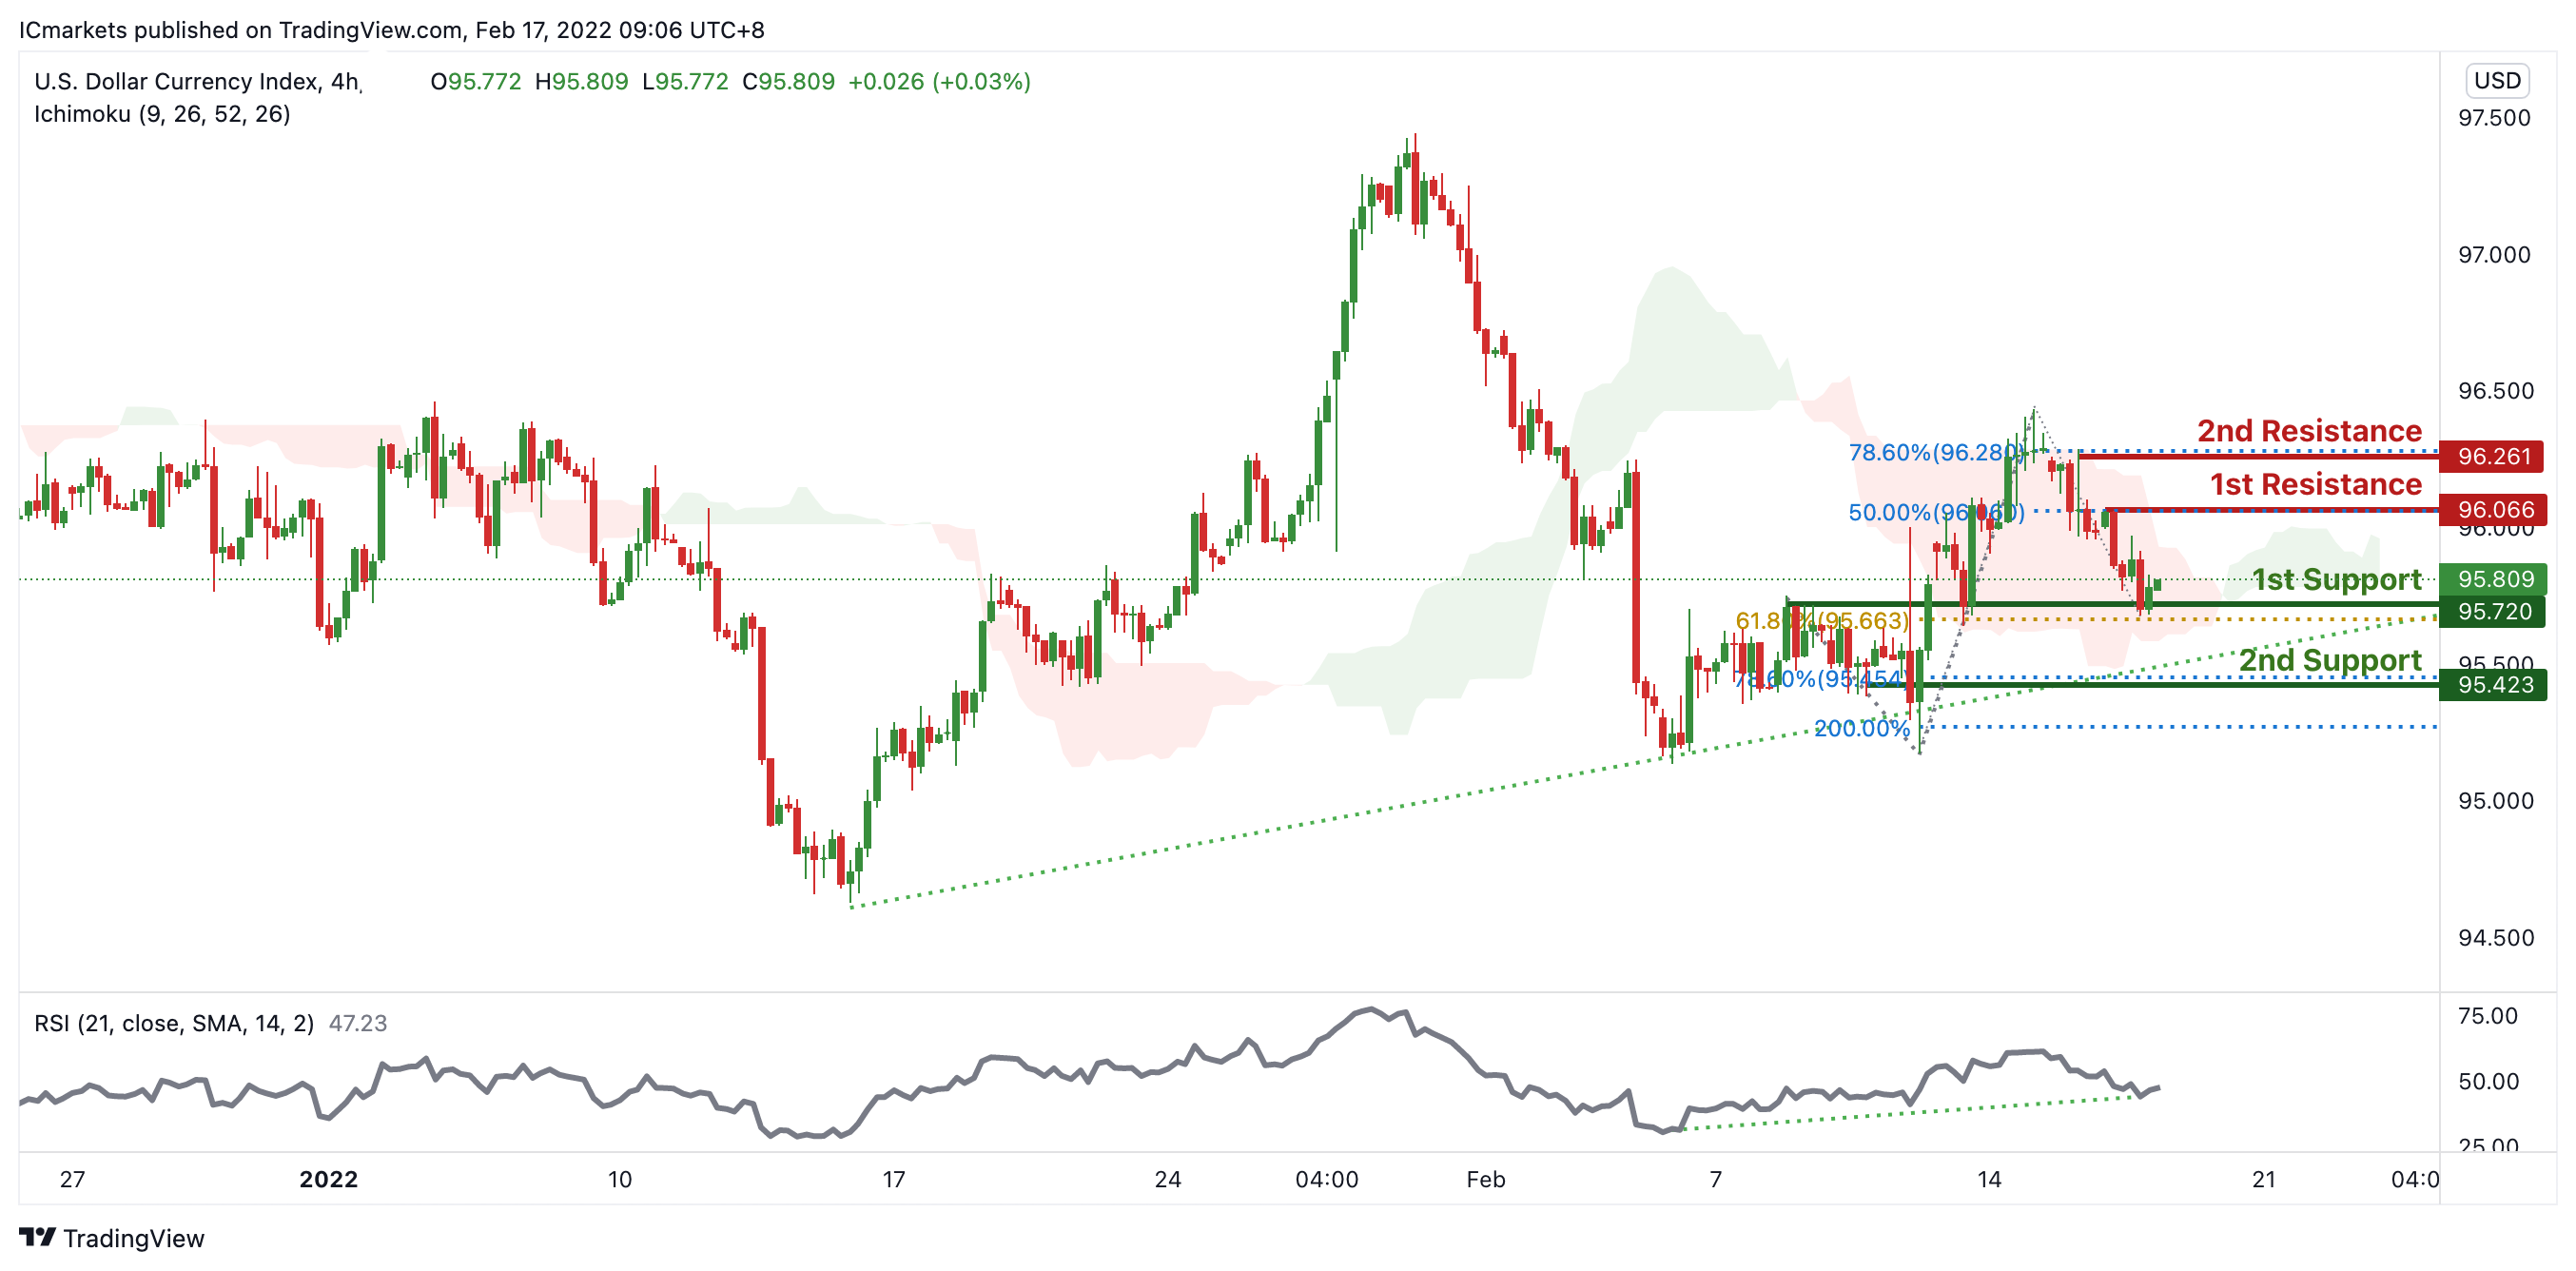
DXY:
On the H4 timeframe, prices are abiding by a daily ascending trendline and are on bullish momentum. We see the potential for a bounce from our 1st support at 95.720 in line with 61.8% Fibonacci extension and graphical overlap towards our 1st resistance at 96.066 in line with 50% Fibonacci retracement. Our bullish bias is further supported by our RSI showing bullish momentum and prices trading above our ichimoku cloud support.
Areas of consideration:
- H4 time frame, 1st resistance at 96.066
- H4 time frame, 1st support at 95.720
XAU/USD (GOLD):
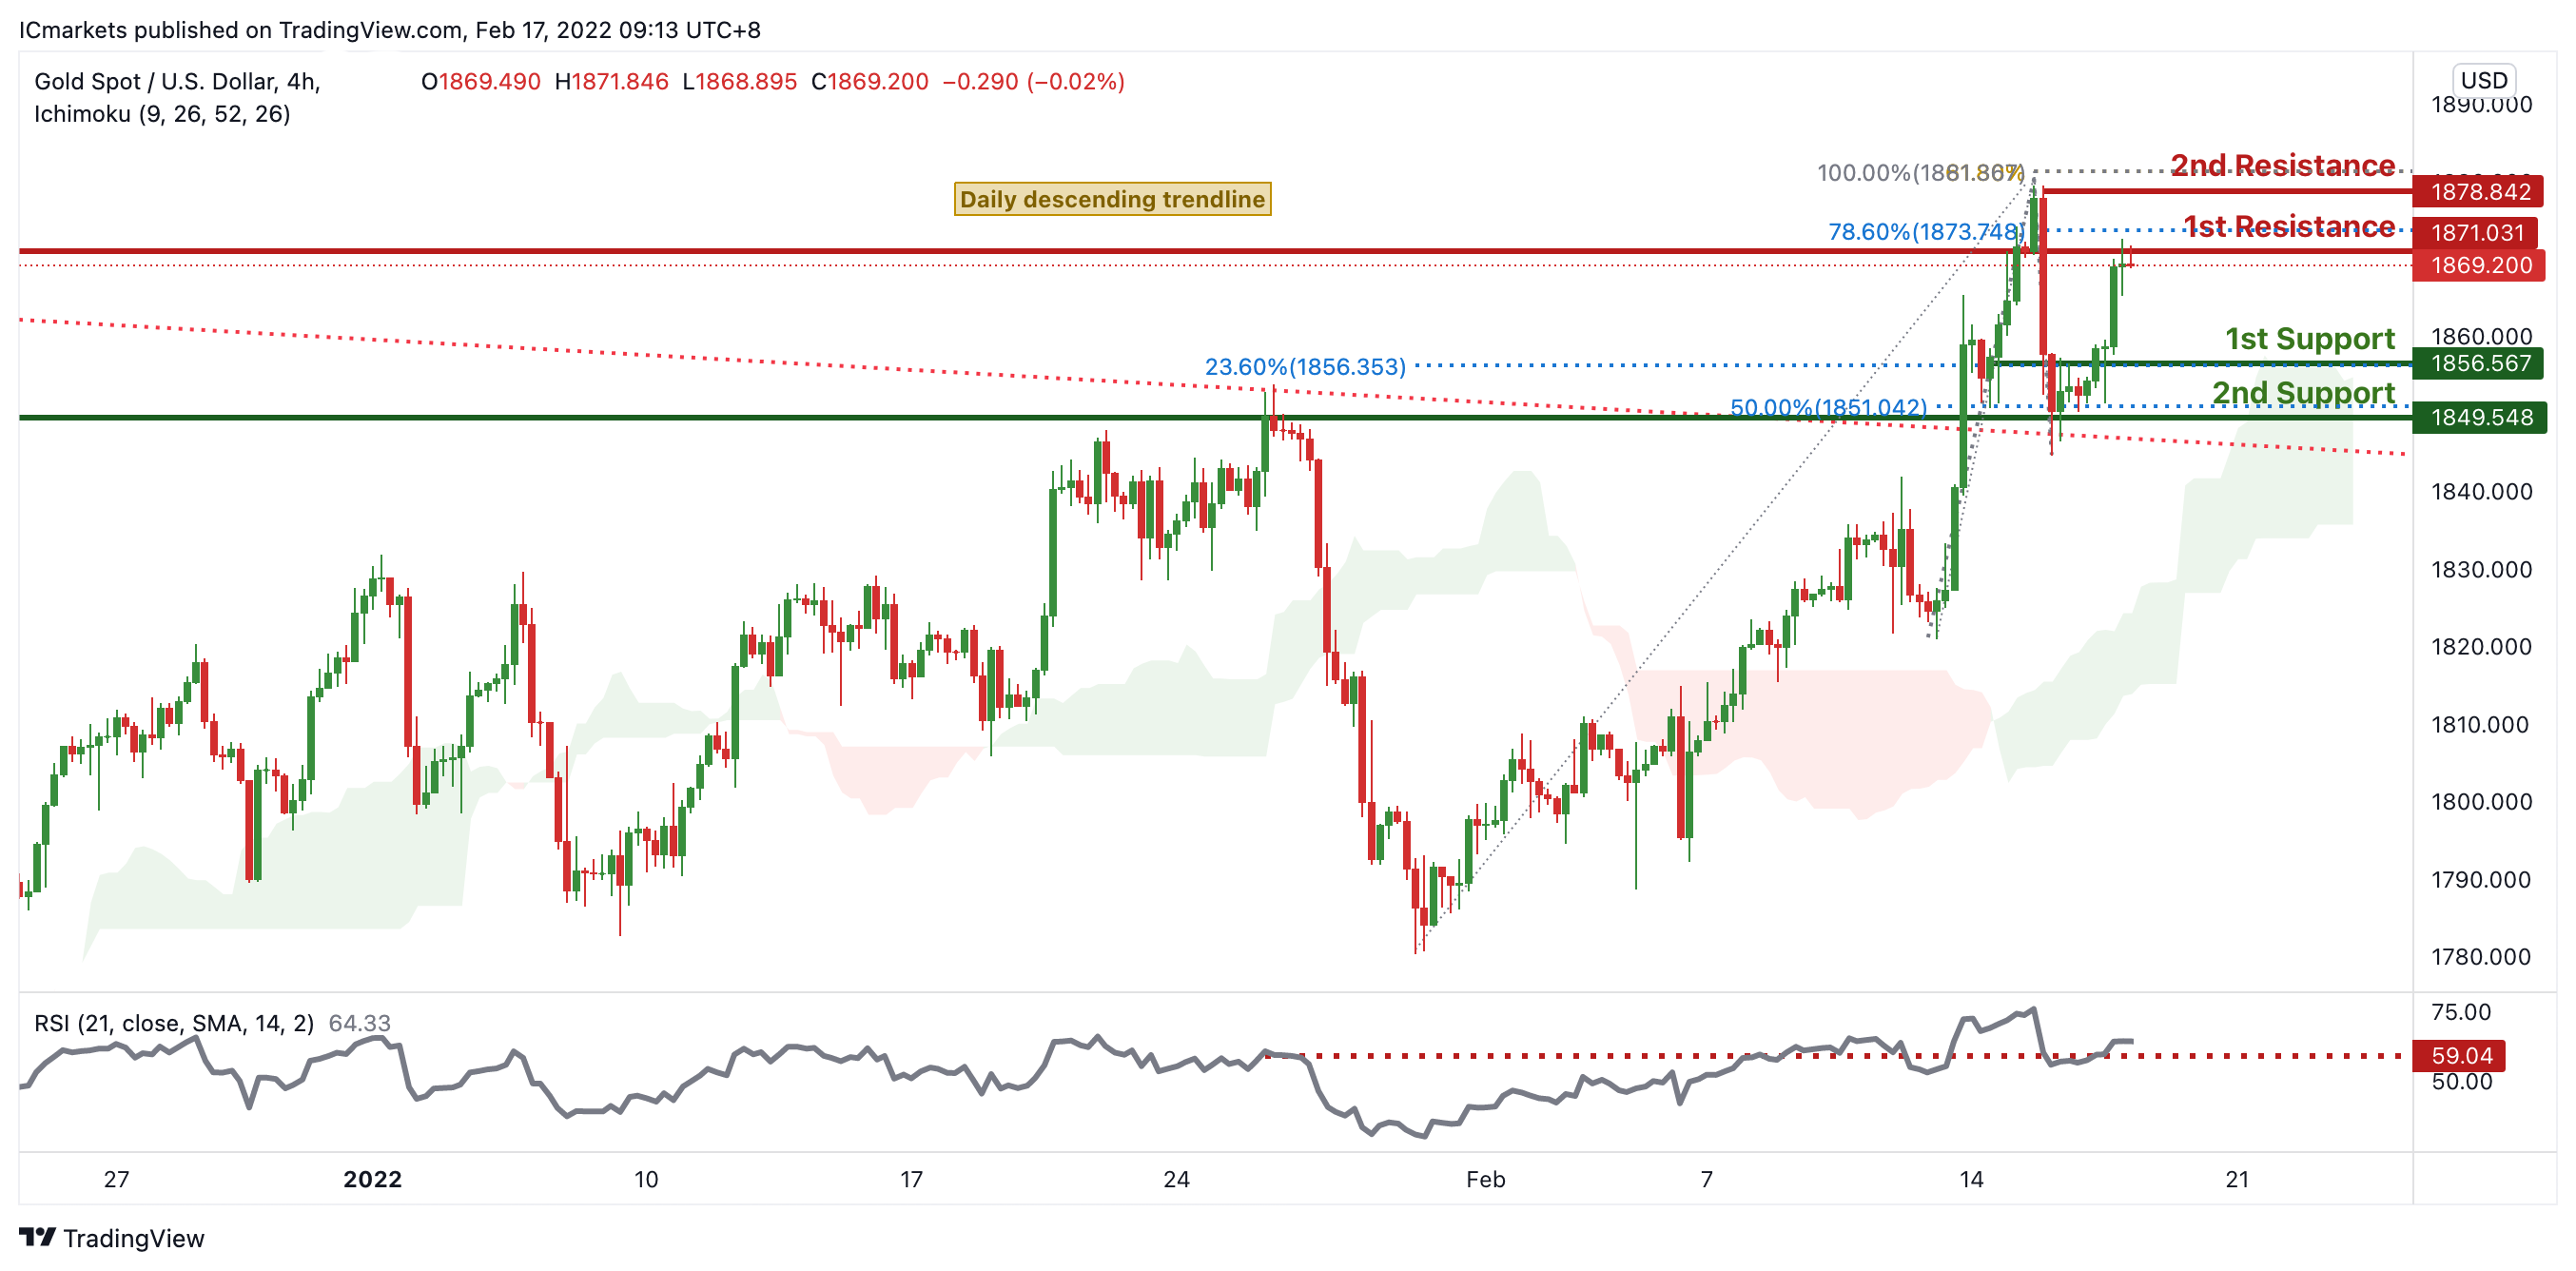
On the H4 chart, prices have recently broken out of our daily descending trendline. We see potential for a slight pullback from our 1st resistance at 1869.220 in line with 78.6% Fibonacci retracement towards our 1st support at 1856.567 in line with 23.6% Fibonacci retracement. RSI are at levels where dips previously occurred.
Areas of consideration:
- 4h 1st support at 1856.567
- 4h 1st resistance at 1869.220
GBP/USD
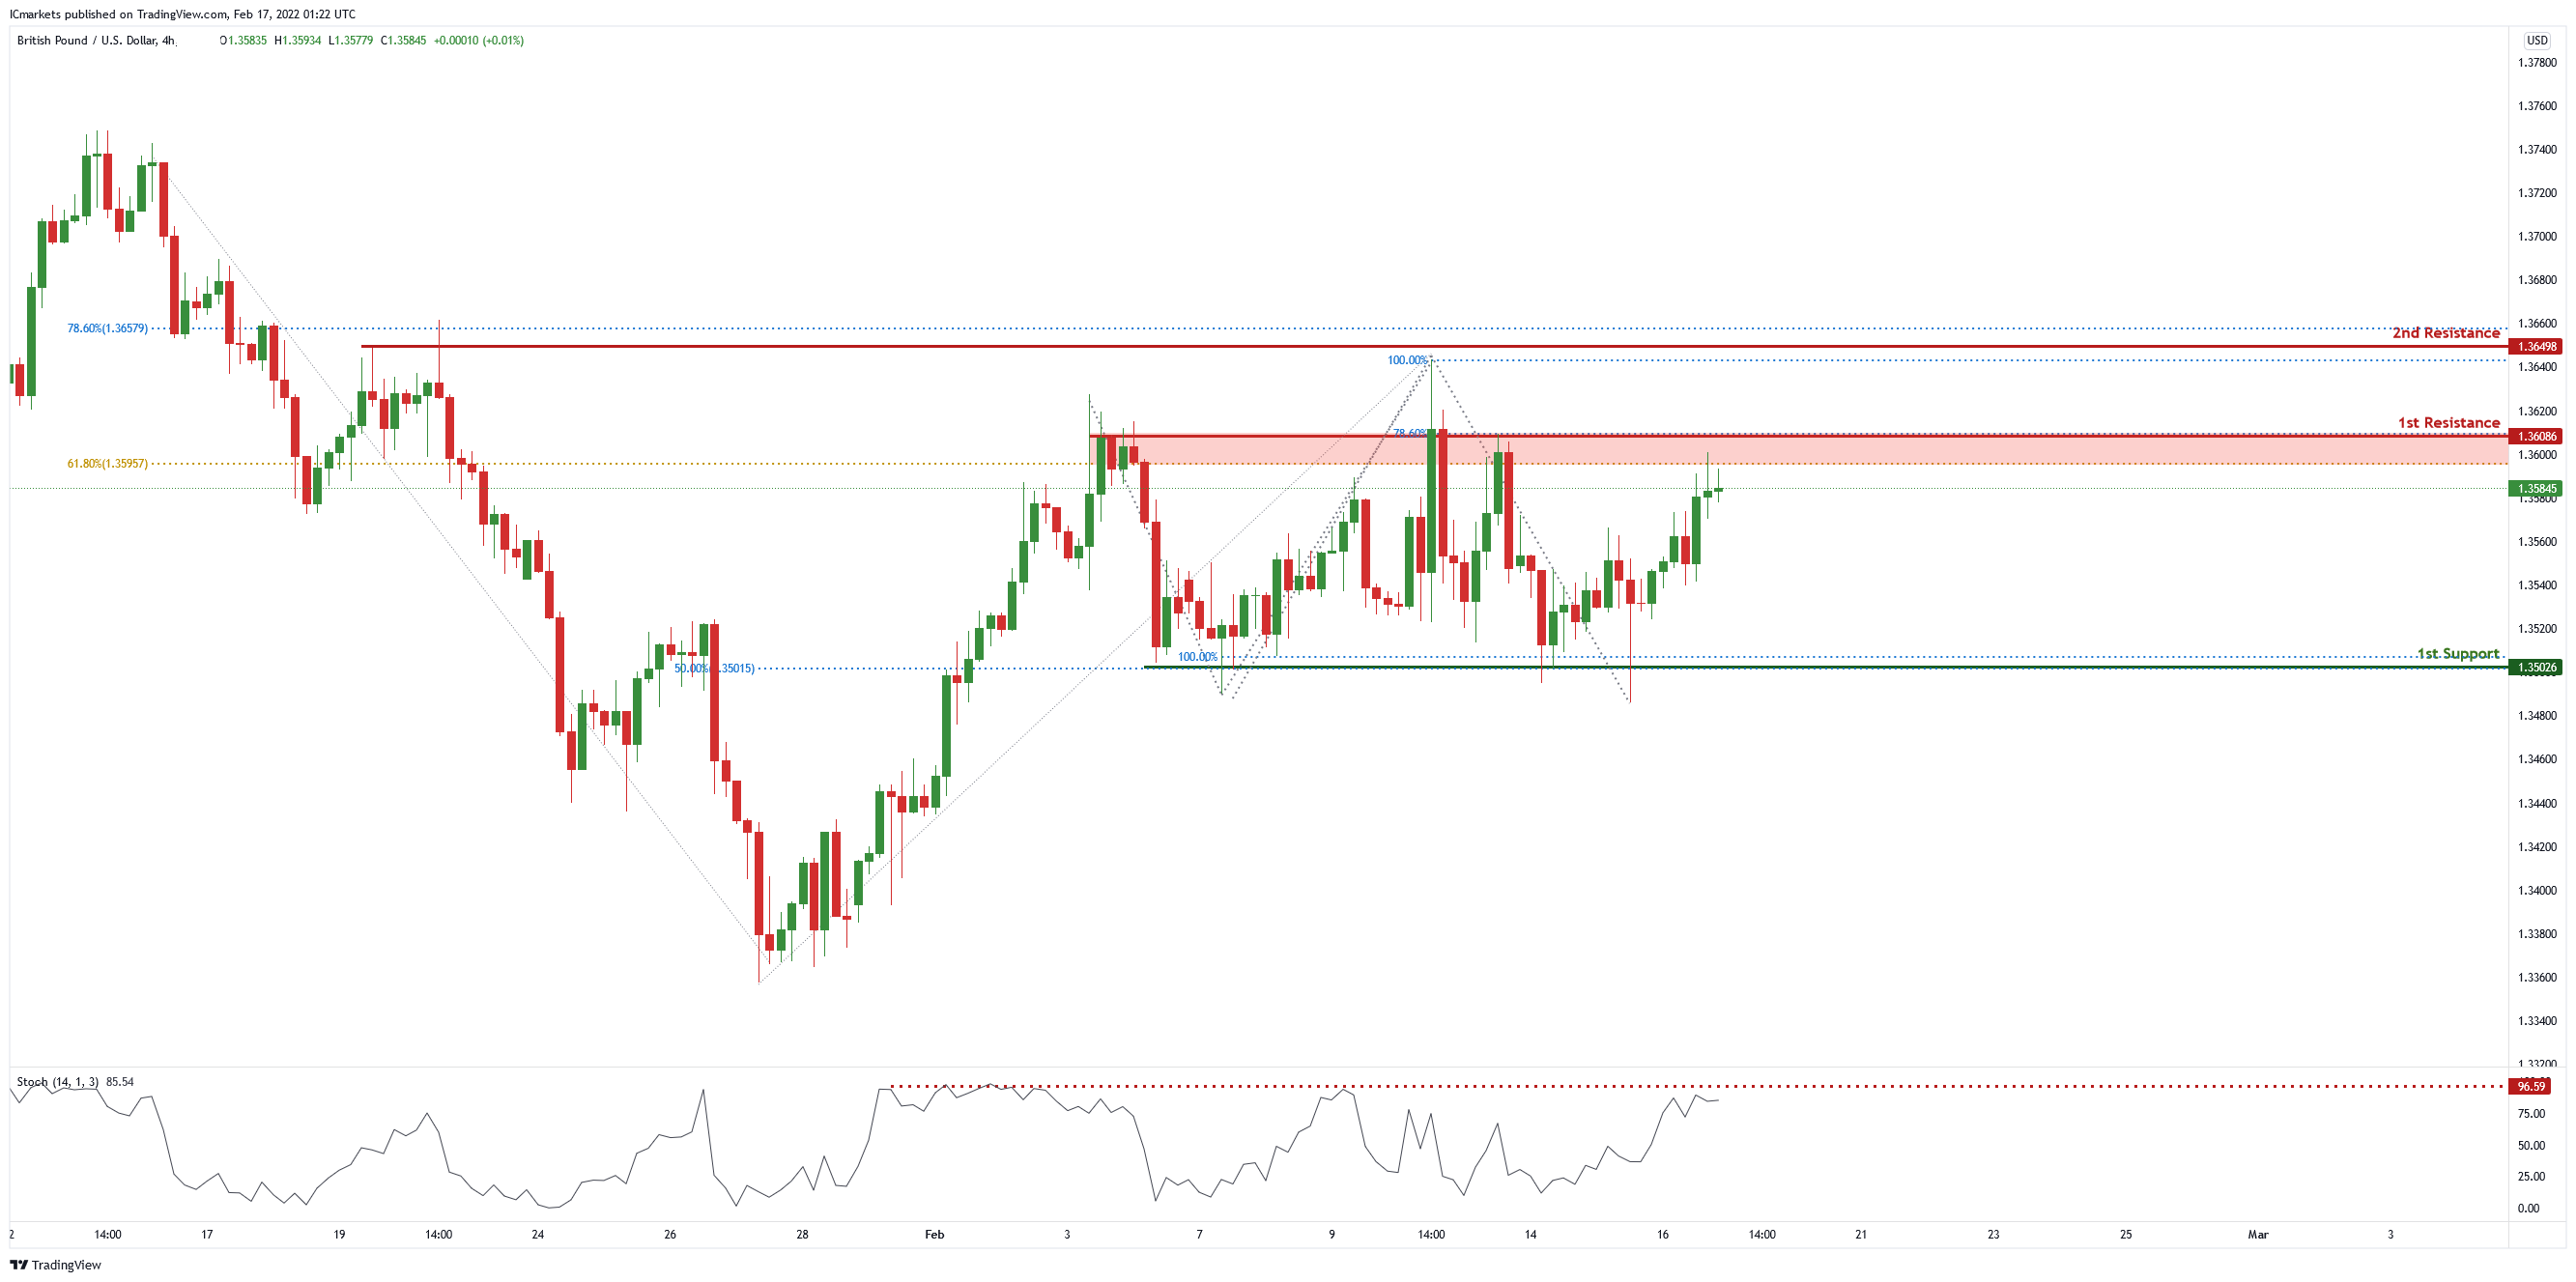
On the H4 chart , price is near 1st resistance level of 1.36086 in line with 61.8% Fibonacci retracement and 78.6% Fibonacci projection. Price can potentially dip to the take profit level of 1.35026 in line with 50% Fibonacci retracement and 100% Fibonacci projection . Our bearish bias is supported by the stochastic indicator as it is near resistance level.
Areas of consideration
- H4 1st resistance at 1.36086
- H4 1st support at 1.35026
USD/CHF:
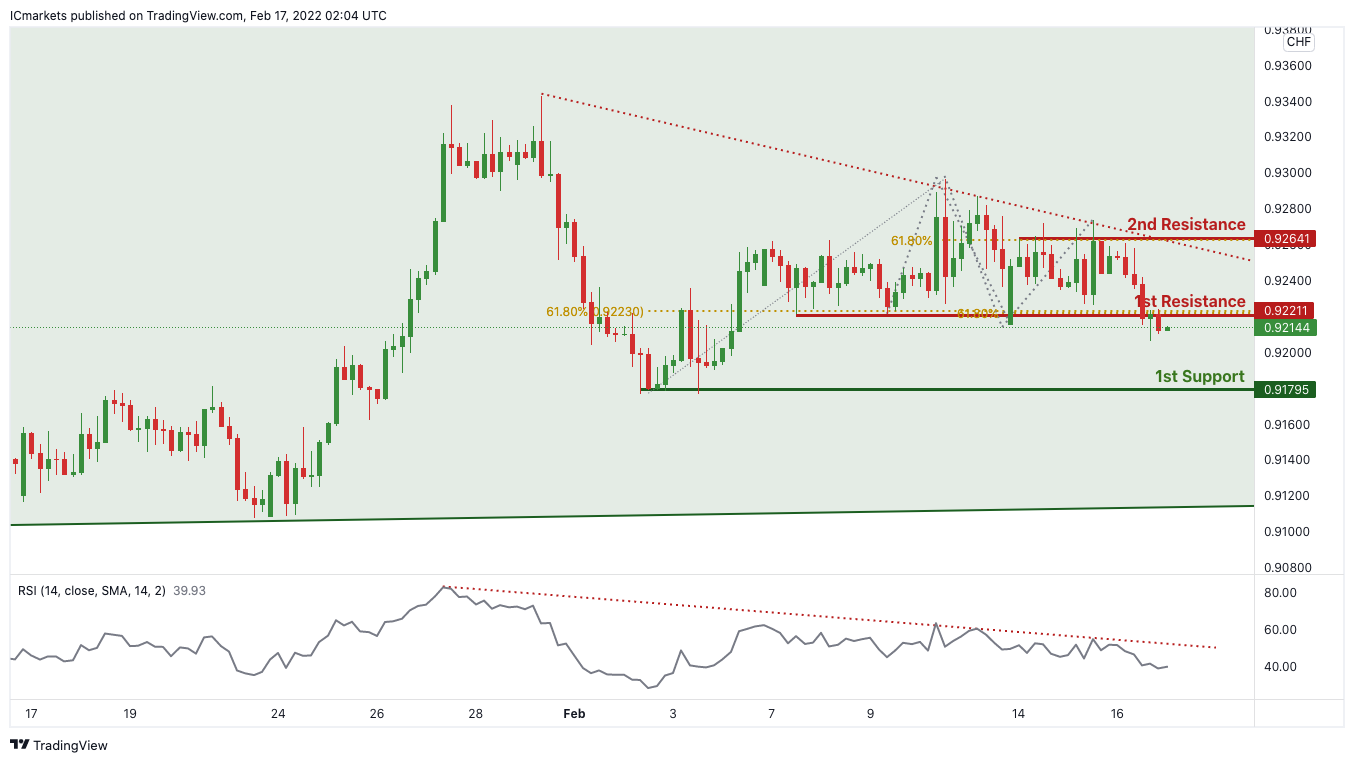
On the H4 timeframe, price is abiding to the daily ascending channel and descending trendline resistance on the H4. We can expect the price to drop from 1st Resistance in line with 61.8% Fibonacci projection towards 1st Support in line with 61.8% Fibonacci projection and 61.8% Fibonacci retracement. Our bearish bias is further supported by the RSI indicator where it is abiding to the descending trendline resistance. Traders should wait for prices to swing higher or lower before entering.
Areas of consideration:
- Watch 1st Support at 0.91795
- Watch 1st Resistance at 0.92211
EUR/USD :
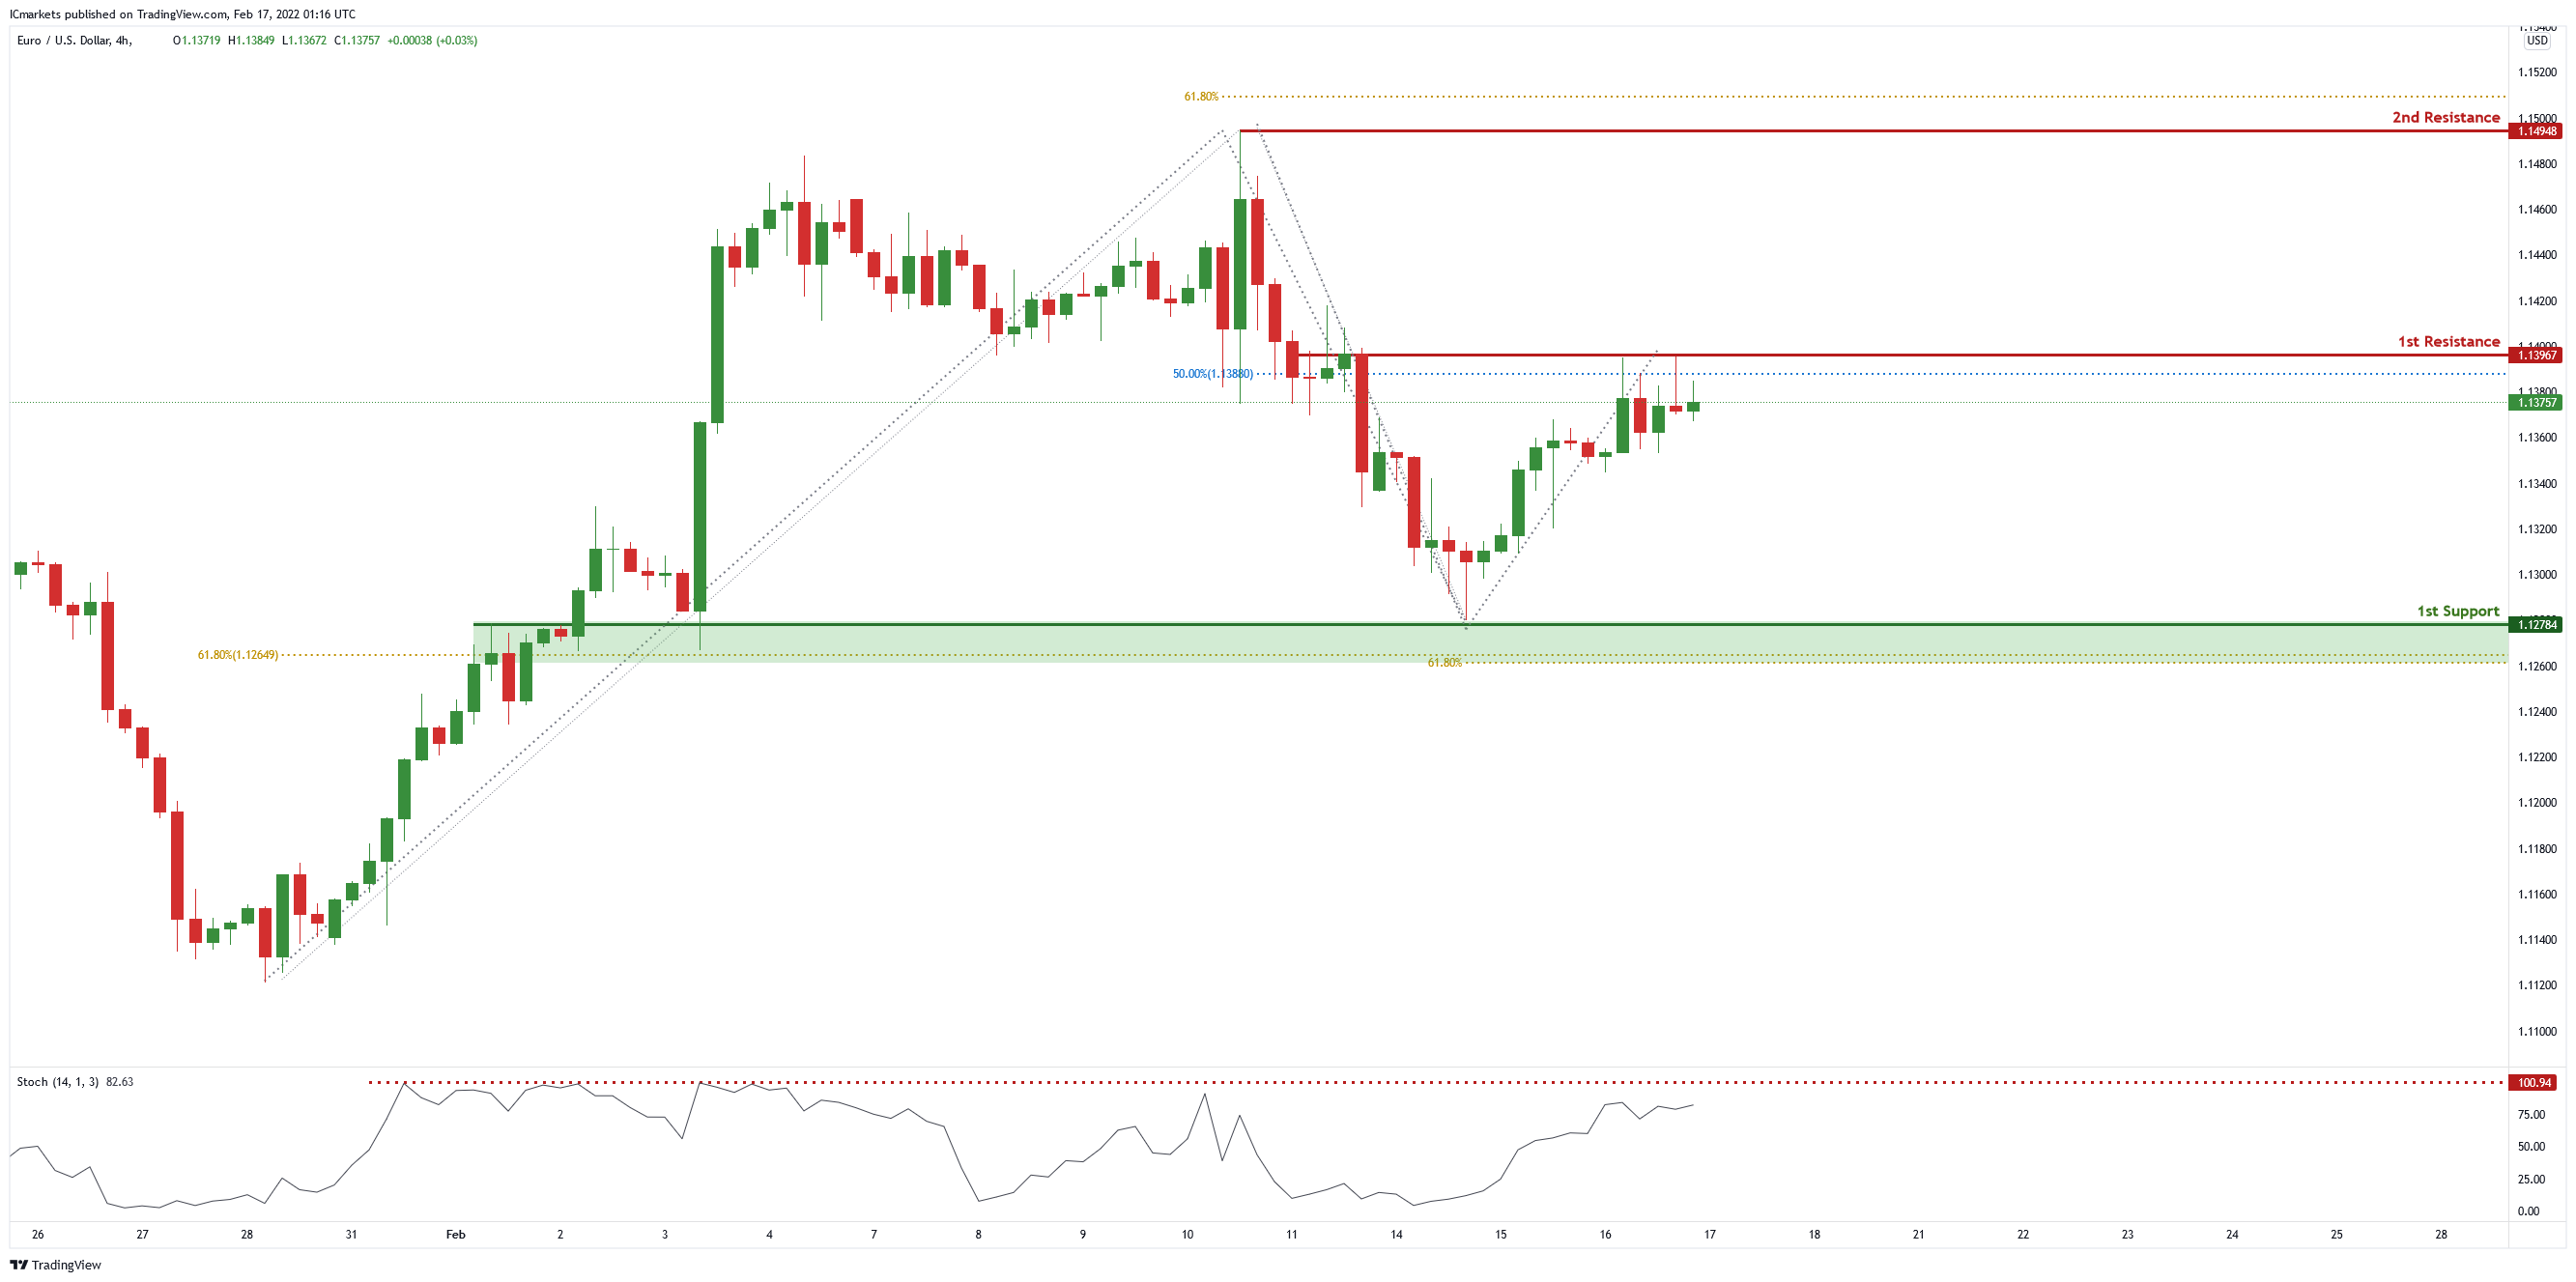
On the H4 chart, price is near 1st resistance level of 1.13967 in line with 50% Fibonacci retracement. Price can potentially dip to the 1st support level of 1.12784 in line with 61.8% Fibonacci retracement and 61.8% Fibonacci projection. Our bearish bias is supported by the stochastic indicator as it is near the resistance level.
Areas of consideration
- H4 1st resistance at 1.13967
- H4 1st support at 1.12784
USD/JPY:
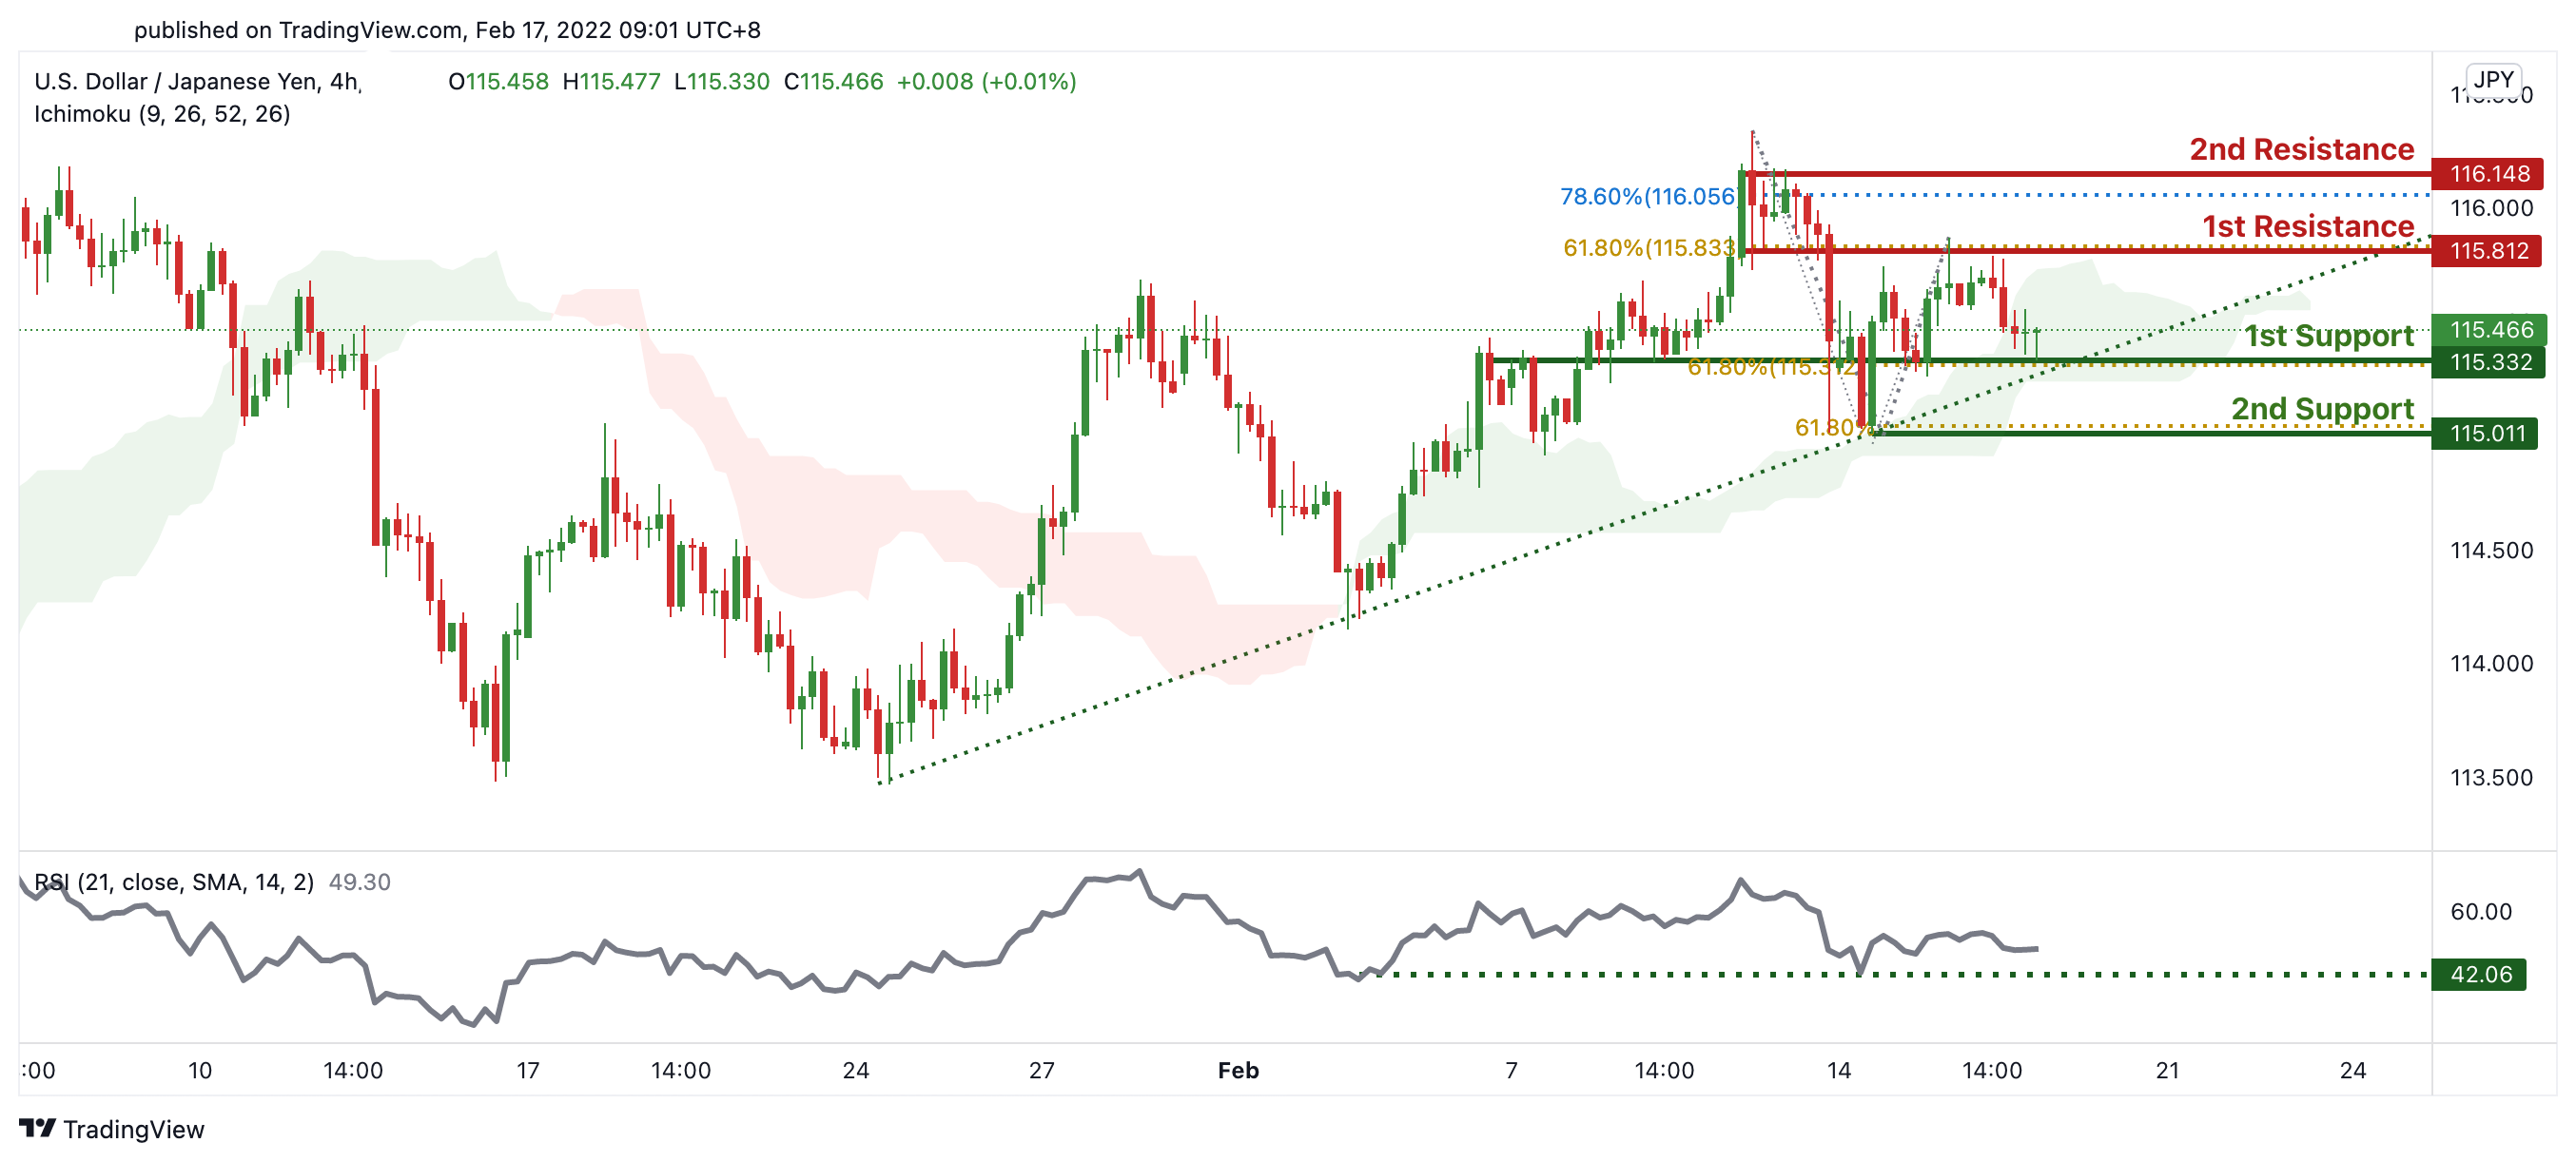
On the H4 chart, price is abiding to the ascending trendline support signifying an overall bullish momentum. We can expect price to bounce at 115.332 in line with 61.8% Fibonacci extension towards our 1st resistance at 115.812 in line with 61.8% Fibonacci retracement and 78.6% Fibonacci retracement. Our bullish bias is further supported by the Ichimoku cloud acting as a support and RSI at levels where bounces previously occurred.
Areas of consideration:
- H4 1st support at 115.332
- H4 1st resistance at 115.812
AUD/USD:
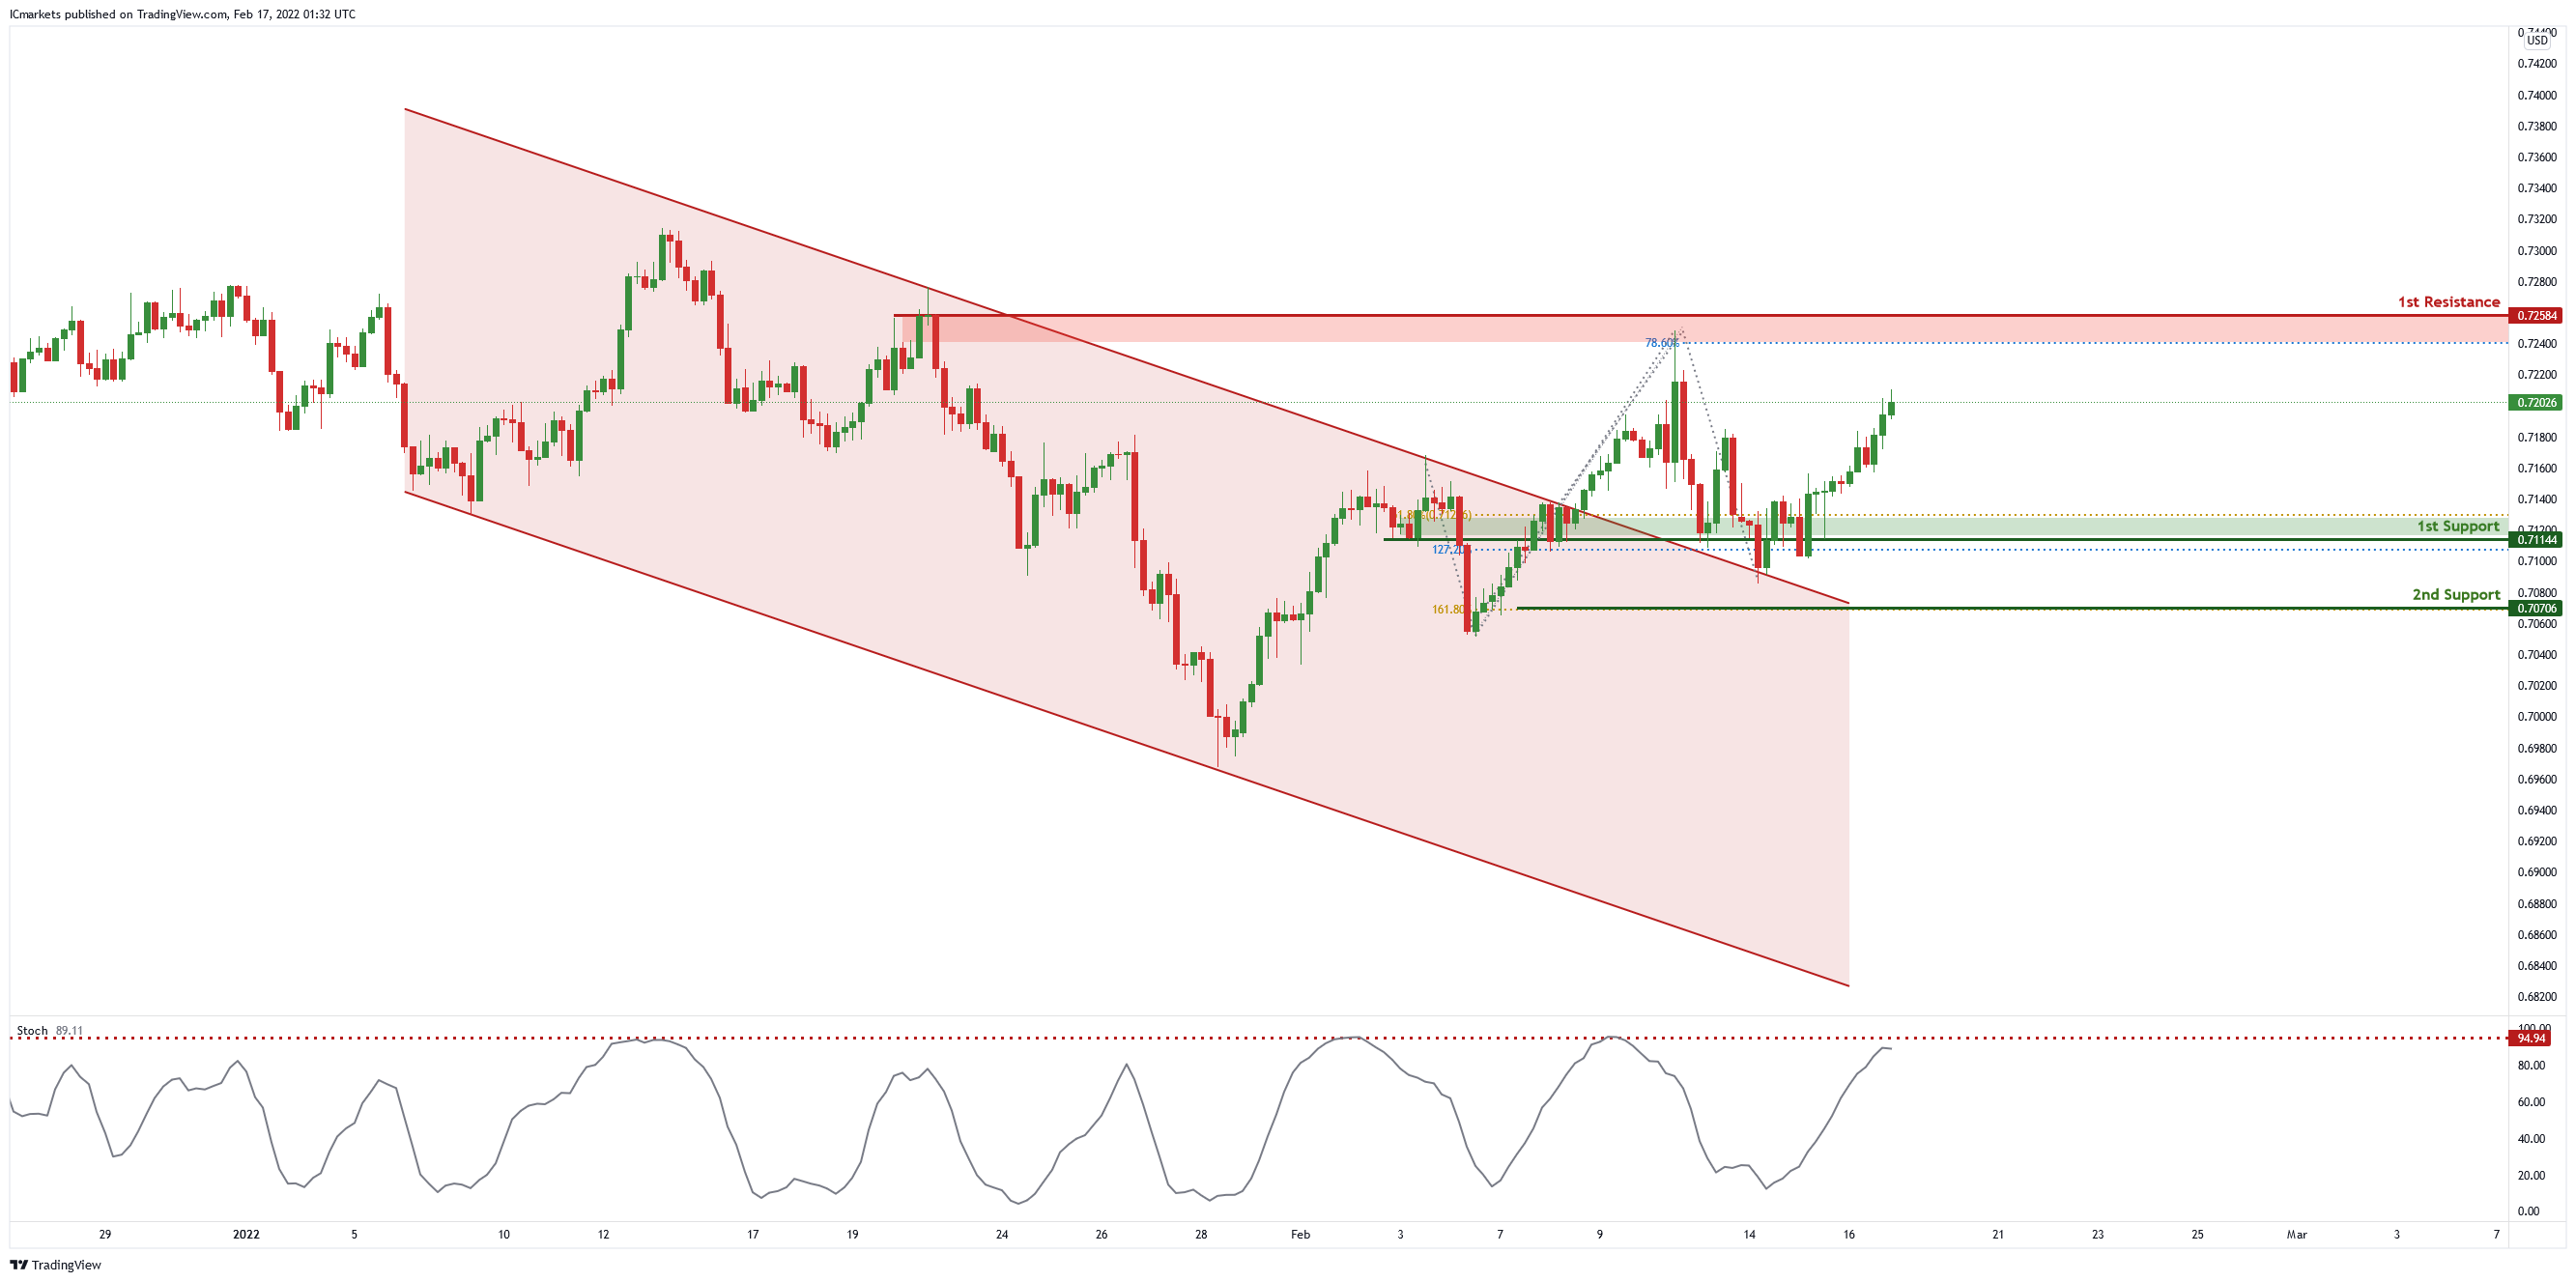
Price broke out of the descending channel. Price is near the 1st resistance level of 0.72584 in line with 78.6% Fibonacci projection. Price can potentially dip to the 1st support level of 0.71144 in line with 127.2% Fibonacci projection and 61.8% Fibonacci retracement. Our bearish bias is supported by the stochastic indicator as it is near resistance level.
Areas of consideration :
- H4 1st resistance of 0.72584
- H4 1st support of 0.71144
NZD/USD:
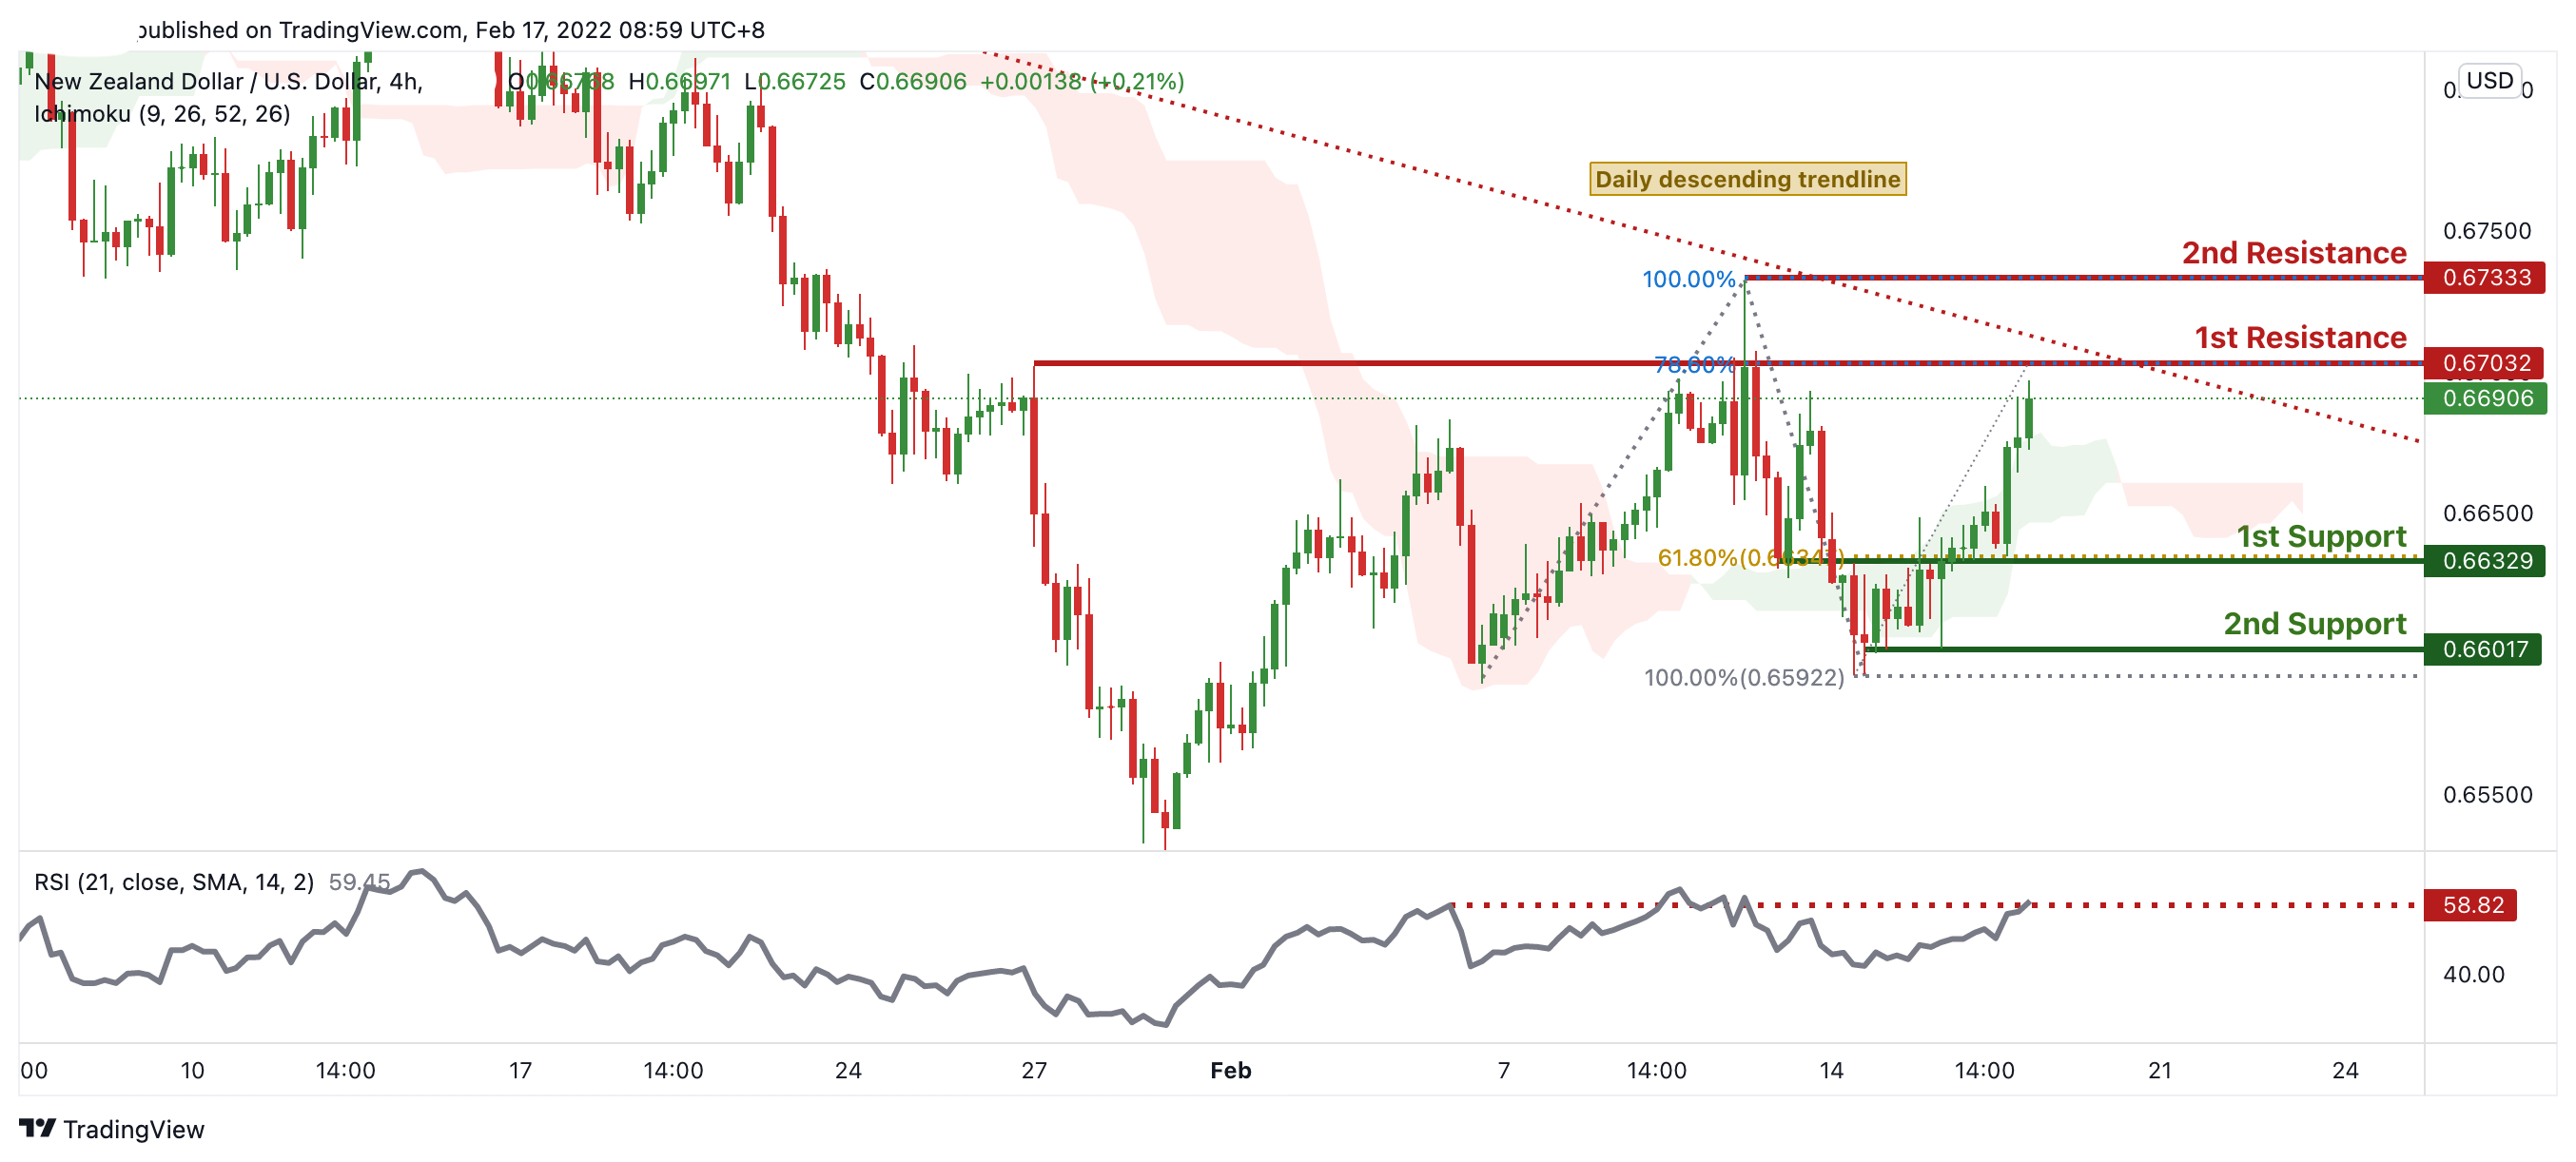
On the H4 timeframe, prices are on bearish momentum and abiding to a descending trendline. We see potential for bearish momentum from our 1st resistance at 0.67032 in line with 78.6% Fibonacci extension towards our 1st support at 0.66329 in line with 61.8% Fibonacci retracement. Our bias is further supported by RSI being at levels where dips previously occurred and also ichimoku cloud forecasting bearish momentum . Alternatively, our stop loss will be placed at 2nd resistance at 0.67333 in line 100% Fibonacci extension.
Areas of consideration:
- H4 time frame, 1st resistance at 0.67032
- H4 time frame, 1st support at 0.66329
USD/CAD:
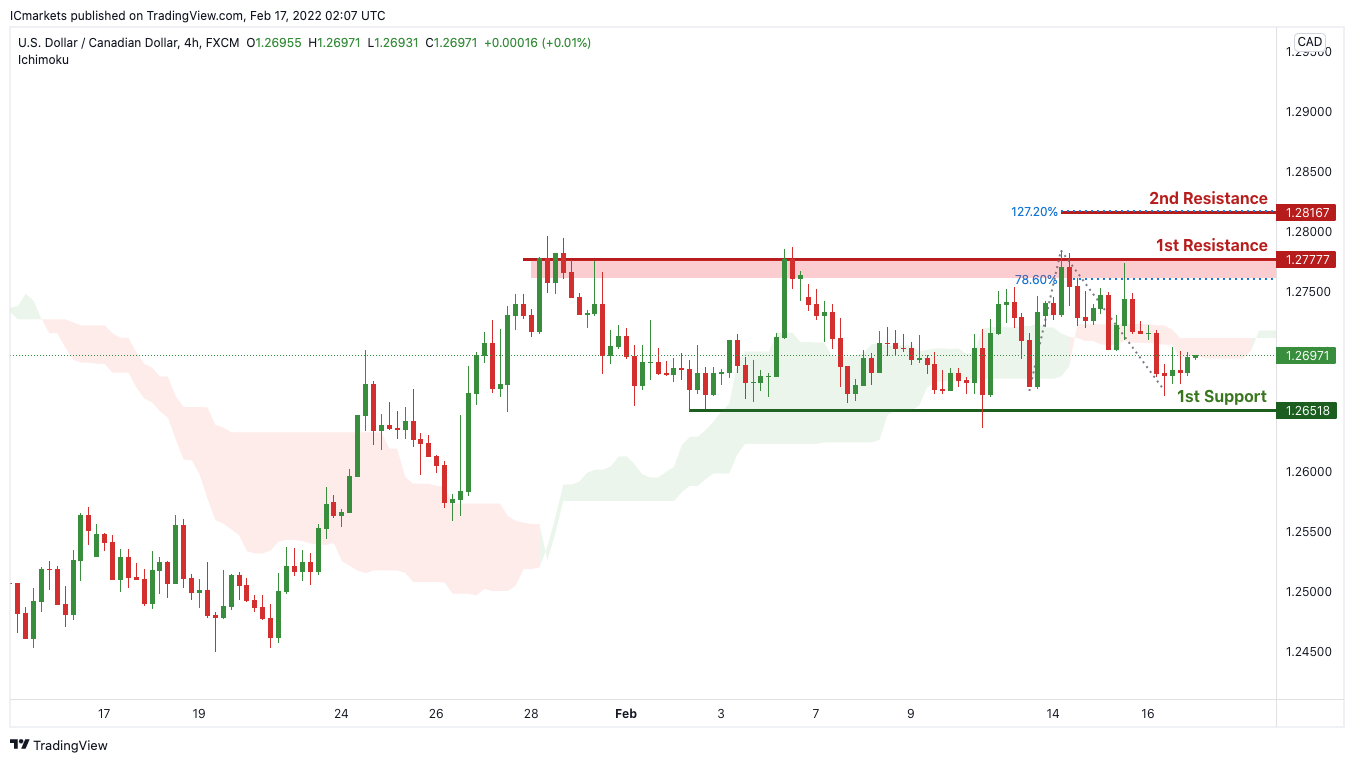
On the H4, with price moving below the ichimoku cloud, we can expect price to drop from our 1st resistance at 1.277777 in line horizontal graphical swing high resistance to our 1st support in line with horizontal overlap support and 78.6% Fibonacci retracement at 1.26518. Alternatively, price may break 1st resistance structure and head for 2nd resistance, which coincides with horizontal swing high resistance at 1.28167.
Areas of consideration:
- H4 time frame, 1st support at 1.26518
- H4 time frame, 1st resistance at 1.277777
OIL:
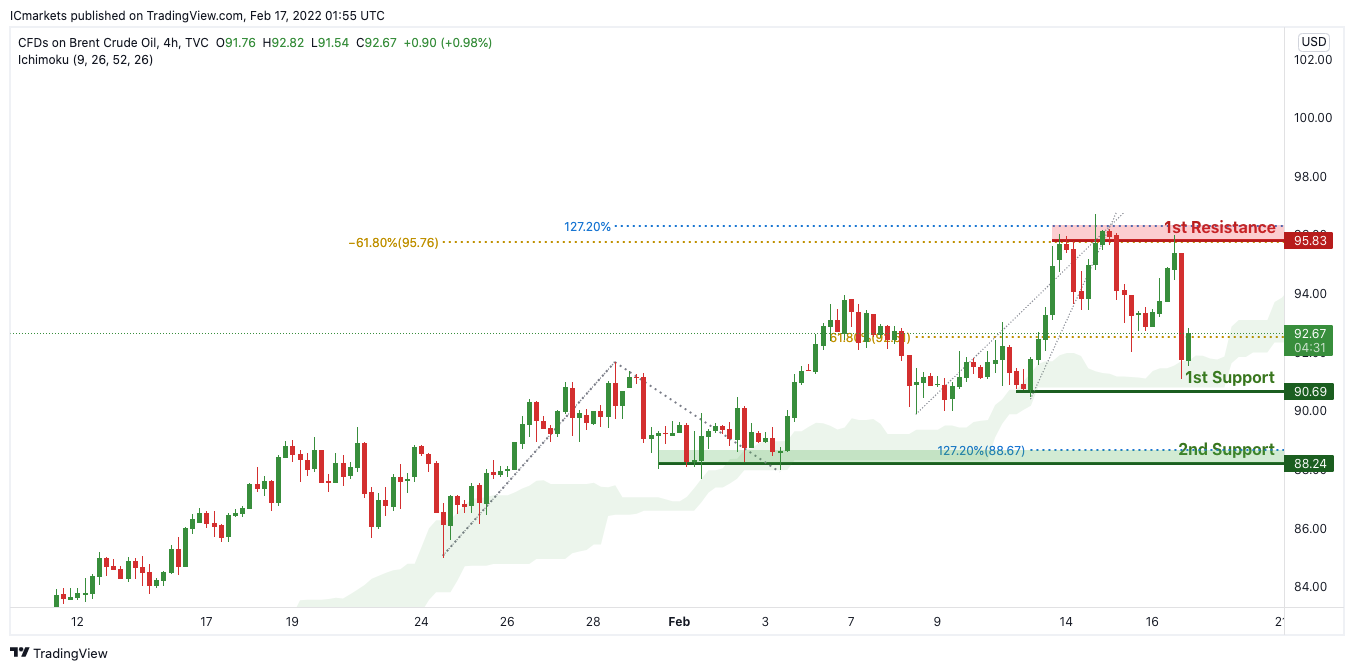
On the H4, with price expected to bounce off the support of the ichimoku cloud, signifying an overall bullish momentum. We can expect price to rise to our 1st resistance at 95.83 in line horizontal graphical swing high resistance and -61.8% Fibonacci expansion and 127.2% Fibonacci extension level from our 1st support in line with horizontal overlap support and 61.8% Fibonacci retracement at 90.69. Alternatively, price may break 1st support structure and head for 2nd support, which coincides with horizontal swing low support and 127.2% Fibonacci extension at 88.24.
Areas of consideration:
- H4 time frame, 1st resistance of 95.83
- H4 time frame, 1st support of 90.69
Dow Jones Industrial Average:
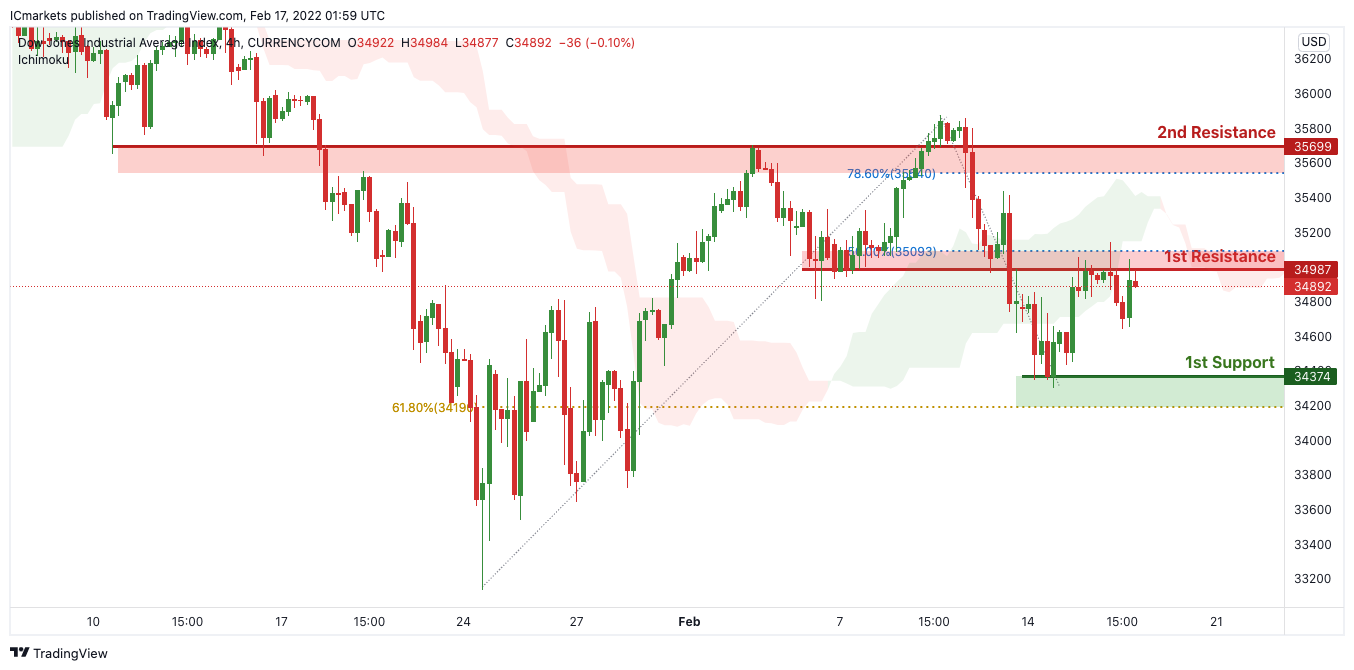
On the H4, with prices moving below the ichimoku cloud, we see the potential for a drop to our 1st support at 34374 in line with horizontal swing low support from our 1st resistance at 34987 in line with the 50% Fibonacci retracement. Alternatively, price may break 1st resistance structure and head for 2nd resistance at 35699, in line with the horizontal overlap resistance and 78.6% Fibonacci retracement.
Areas of consideration:
- H4 time frame, 1st resistance of 34987
- H4 time frame, 1st support of 34374
GBP/JPY Daily Outlook
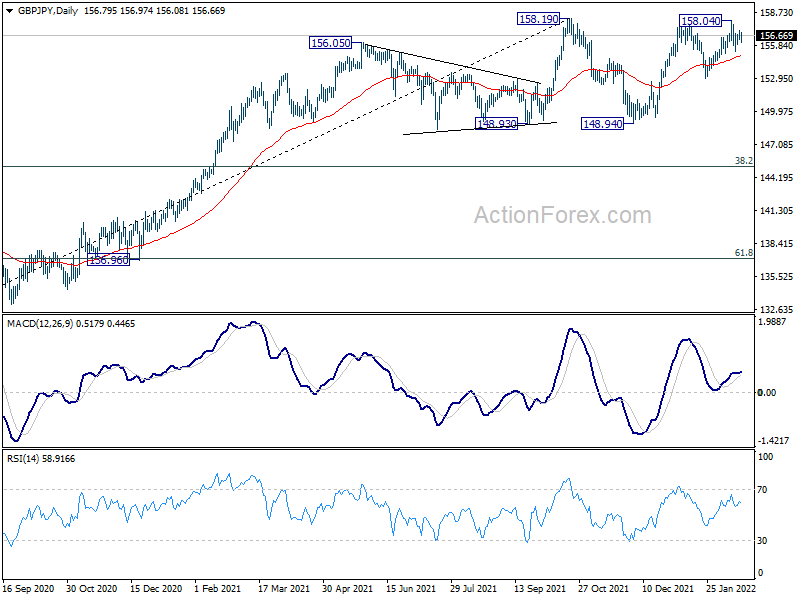
Daily Pivots: (S1) 156.09; (P) 156.45; (R1) 156.94; More...
Outlook in GBP/JPY is unchanged and intraday bias stays neutral. On the downside, break of 155.11 resistance should confirm rejection by 158.19 resistance. Intraday bias will be turned to the downside for 152.88 support, to extend the corrective pattern from 158.19 with another falling leg. However, on the upside, sustained break of 158.19 will resume larger up trend.
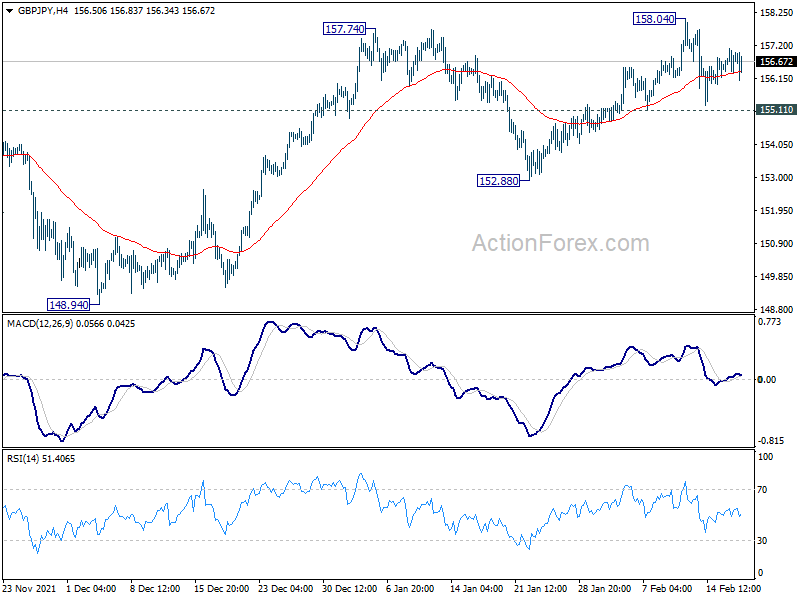
In the bigger picture, price actions from 158.19 are seen as developing into a consolidation pattern to up trend from 123.94 (2020 low). Downside should be contained by 123.94 to 158.19 at 145.10 to bring rebound. Firm break of 158.19 will resume the up trend to long term fibonacci level at 167.93. However, sustained break of 145.10 will raise the chance of trend reversal and target 61.8% retracement at 137.02.