Sample Category Title
All Eyes On The US CPI Rates For August
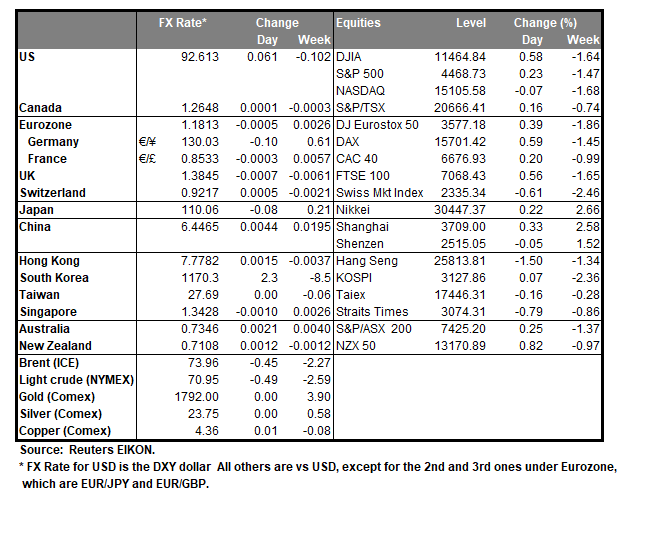
The USD remained rather steady, maybe with a few gains, against a number of its counterparts, despite volatility having increased somewhat during yesterday’s sessions as well as today’s Asian session. Market expectations are for CPI rates to tick down which theoretically could weaken the USD as it could ease pressure on the Fed to start tapering its QE program rather earlier than later. Yet the rates are to remain at high levels and a tick down may prove insufficient for market worries regarding the inflationary pressures in the US economy to be calmed down. On the other hand, gold prices edged lower during today’s Asian session, also due to the strengthening of the USD, yet the overall sideways movement seems to be still present. US Stocks ended the day mixed with low volatility in anticipation of the US CPI rates and given that US yields slipped lower yesterday.
EUR/USD rose yesterday after bouncing on the 1.1785 (S1) support line. We tend to maintain a bias for a sideways movement given also that the RSI indicator below our 4-hour chart remains near the reading of 50, implying a rather indecisive market. Should the USD remain in high demand, we may see the pair dropping and breaking the 1.1785 (S1) support line, aiming for the 1.1695 (S2) support level. Should a buying interest be displayed by the market we may see EUR/USD rising, breaking the 1.1885 (R1) resistance line and take aim for the 1.1990 (R2) resistance hurdle.
Apple’s new iPhone to be unveiled?
Apple Inc (#AAPL) could be unveiling its new iPhone, as well as the new Apple watch and AirPods in a special event planned for today. Analysts tend to expect some changes yet nothing drastic technically speaking, highlighting the possibility of an improved processor and camera system for the time being. The mid-September launch usually results in a sales surge in the last week of Apple’s fiscal fourth quarter as millions purchase the new iPhones and overall is expected to create a lot of buzz around Apple’s share price. It should be noted that Apple’s share price suffered a blow on Friday after the company lost a court case regarding its App store policies after a long dispute with Epic Games.
Apple’s (AAPL) share price seems to have stabilised somewhat after suffering a hit on Friday as it bounced on the 148.40 (S1) support line. We tend to remain uncertain for the share price’s stabilisation, given that the RSI indicator below our 1-hour chart is just above the reading of 30, underscoring that the bears are still present. On the other hand, Apple’s special event could alter the share’s direction, depending on the outcome. Should the bears regain control over the share’s direction, we may see it breaking the 148.40 (S1) support line and take aim for the 146.50 (S2) support level. Should bulls take over, we may see the share’s price breaking the 149.80 (R1) resistance line and aim for the 152.10 (R2) resistance level.
Other economic highlights today and the following Asian session:
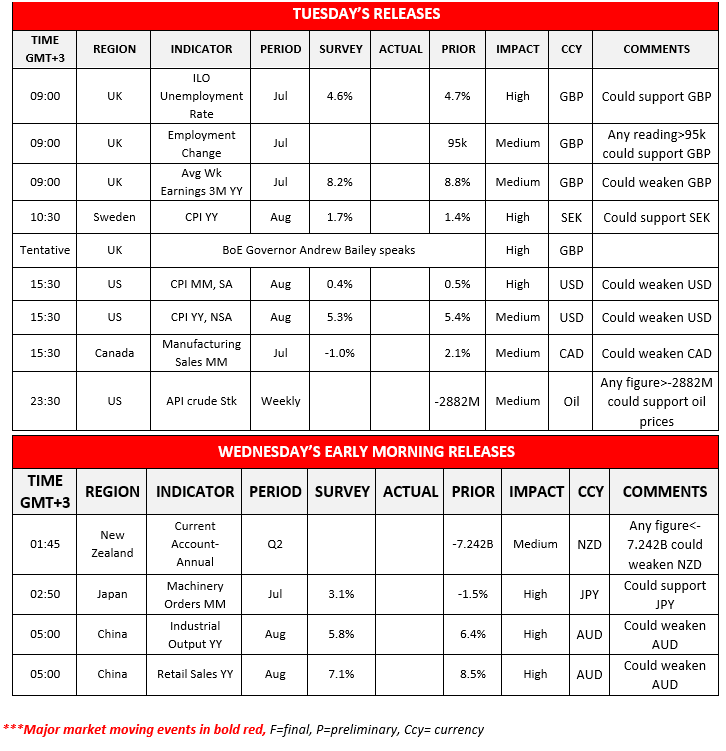
Today during the European session, we get UK’s employment data for July and should the rates and figures imply a tightening of the UK employment market we may see GBP getting some support. Later on, we note from Sweden the release of the CPI rates for August and if the rates accelerate, SEK could gain as it could provide a boost for Riksbank’s confidence. The main event for the day is expected to be the release of the US CPI rates as mentioned above, while CAD traders may keep an eye out for Canada’s manufacturing sales for July and oil traders could be more interested in the release of the weekly API crude oil inventories figure. During tomorrow’s Asian session we get from New Zealand the current account balance for Q2, from Japan the machinery orders for July, while Aussie traders may be eyeing the release of China’s industrial output and retail sales growth rates for August.
EUR/USD H4 Chart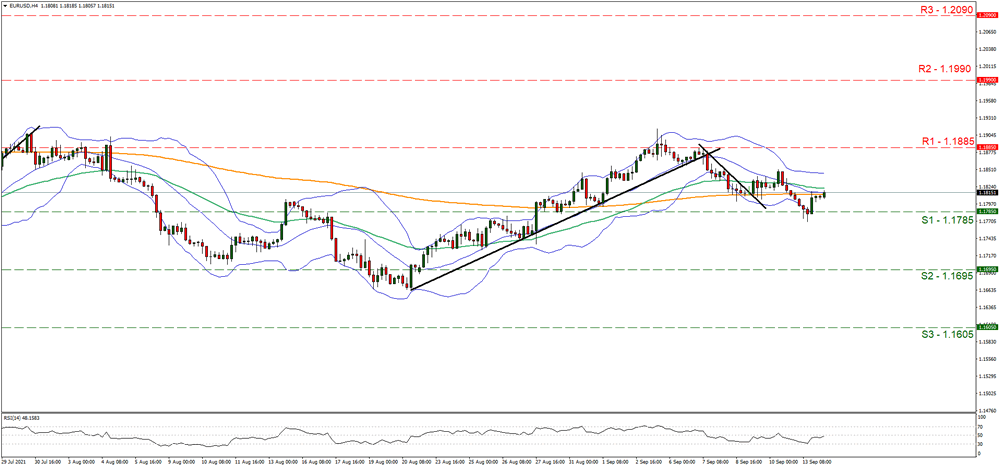
Support: 1.1785 (S1), 1.1695 (S2), 1.1605 (S3)
Resistance: 1.1885 (R1), 1.1990 (R2), 1.2090 (R3)
#AAPL H1 Chart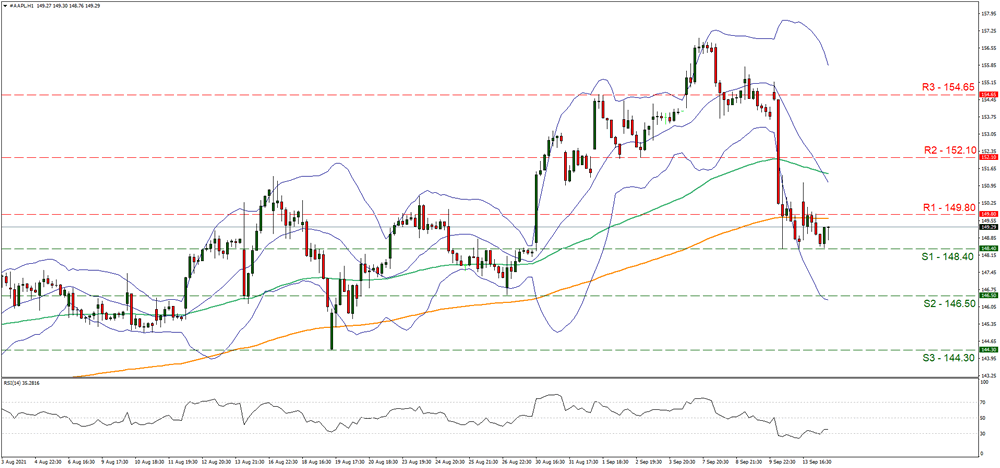
Support: 148.40 (S1), 146.50 (S2), 164.30 (S3)
Resistance: 149.80 (R1), 152.10 (R2), 154.65 (R3)
The Analytical Overview Of The Main Currency Pairs
The EUR/USD currency pair
Technical indicators of the currency pair:
Prev Open: 1.1813
Prev Close: 1.1810
% chg. over the last day: -0.03%
The head of the Philadelphia Fed Patrick Harker has become another official who wants the central bank to start cutting stimulus measures as soon as this year. On the one hand, such verbal interventions lead to an increase in the dollar index at the moment. However, traders should not forget that the European Central Bank is also preparing to cut stimulus, which will have a fundamental effect on the euro strength.
Recomendaciones de trading
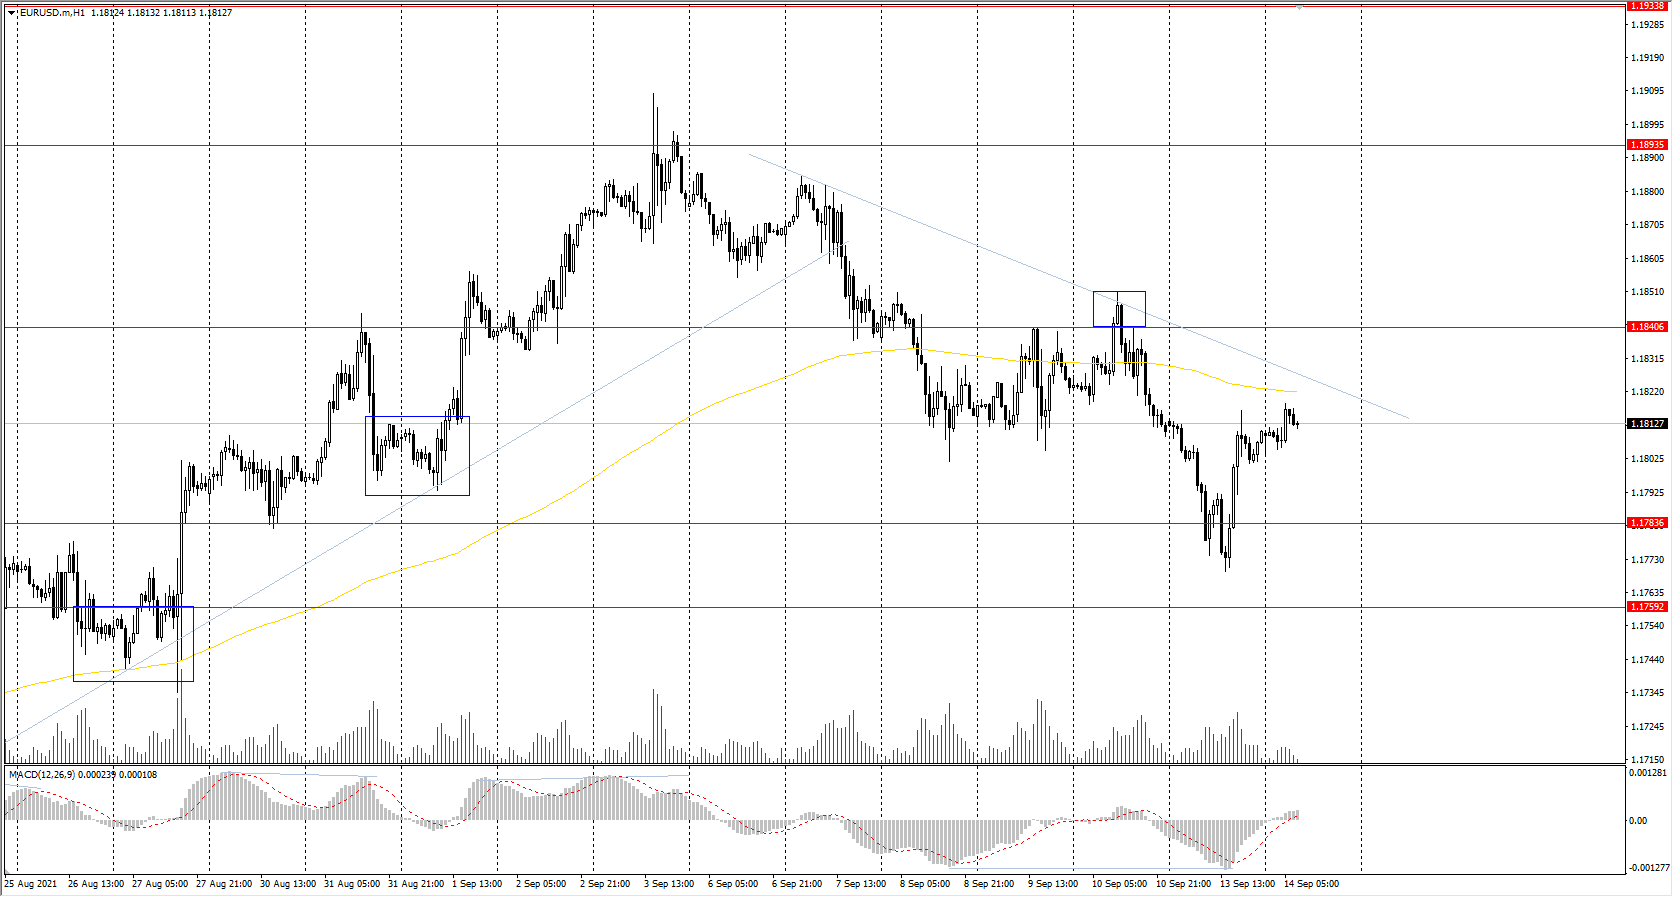
Support levels: 1.1783, 1.1759, 1.1704, 1.1620
Resistance levels: 1.1840, 1.1894, 1.1934, 1.1969
From the technical point of view, the general trend on the EUR/USD currency pair is bullish. Yesterday, the buyers took the initiative from the support level 1.1783. The MACD indicator is in the negative zone, but there are signs of sellers' weakness and an increase in buyers' strength. Under such market conditions, buy trades can be considered from the support levels where buyers show initiative. It is better to look for sell trades from the resistance levels above the moving average and only with short targets.
Alternative scenario: if the price breaks through the 1.1704 support level and fixes below, the mid-term uptrend will likely be broken.
News feed for 2021.09.14:
- US Consumer Price Index (m/m) at 15:30 (GMT+3);
- US Core Consumer Price Index (m/m) at 15:30 (GMT+3).
The GBP/USD currency pair
Technical indicators of the currency pair:
Prev Open: 1.3833
Prev Close: 1.3842
% chg. over the last day: +0.07%
The UK government is considering the possibility of postponing checks on food imports amid fears of increased pressure on supermarket supplies in the run-up to Christmas. Business executives have said that import cancellation rules will not solve the problem because food shortages are related to a lack of truck drivers.
Recomendaciones de trading
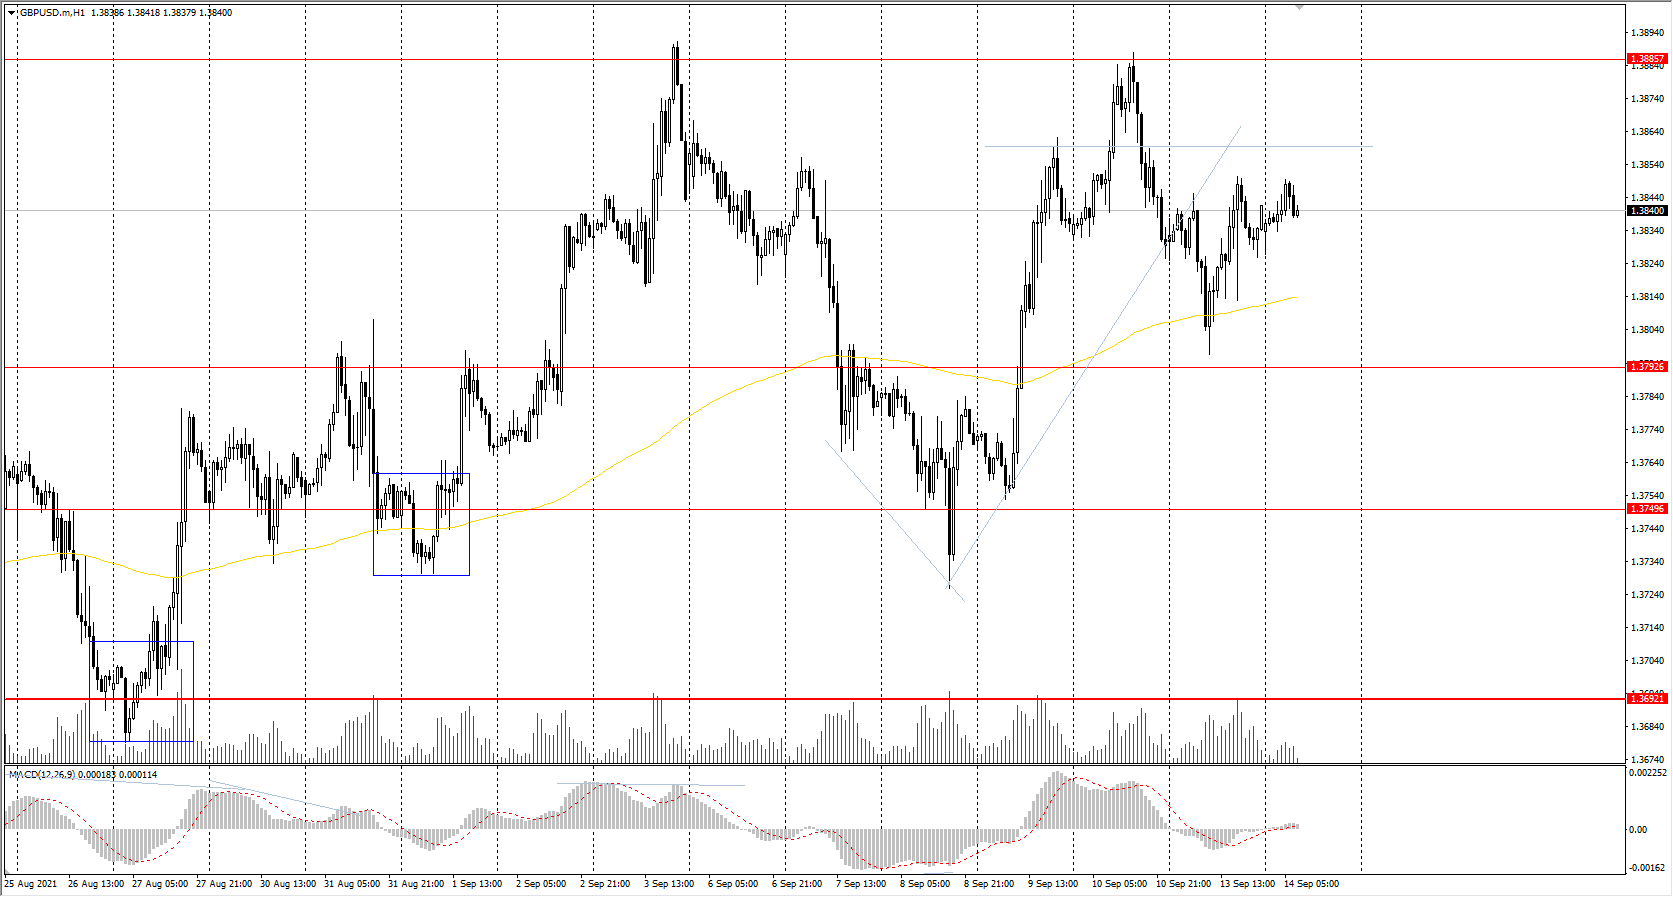
Support levels: 1.3793, 1.3750, 1.3692, 1.3632, 1.3614, 1.3525
Resistance levels: 1.3886, 1.3935, 1.4002
On the hourly time frame, the GBP/USD trend is bullish. But against the background of the dollar index growth, the growth of GBP/USD quotes is limited. The MACD indicator has become inactive. Under such market conditions, it is better to look for buy trades from the support levels near the moving average line. Sell positions can be considered from the resistance levels with short targets throughout the day.
Alternative scenario: if the price breaks through the 1.3692 support level and consolidates below, the bearish scenario will likely resume.
News feed for 2021.09.14:
- UK Average Earnings Index (m/m) at 09:00 (GMT+3);
- UK Claimant Count Change (m/m) at 09:00 (GMT+3);
- UK Unemployment Rate (m/m) at 09:00 (GMT+3).
The USD/JPY currency pair
Technical indicators of the currency pair:
Prev Open: 109.85
Prev Close: 109.99
% chg. over the last day: +0.12%
Japan's revised industrial production hasn’t been changed over the past month. The Japanese Yen is highly correlated with the dollar index right now, but the USD/JPY price is trading in a wide corridor amid the strengthening of both currencies.
Recomendaciones de trading
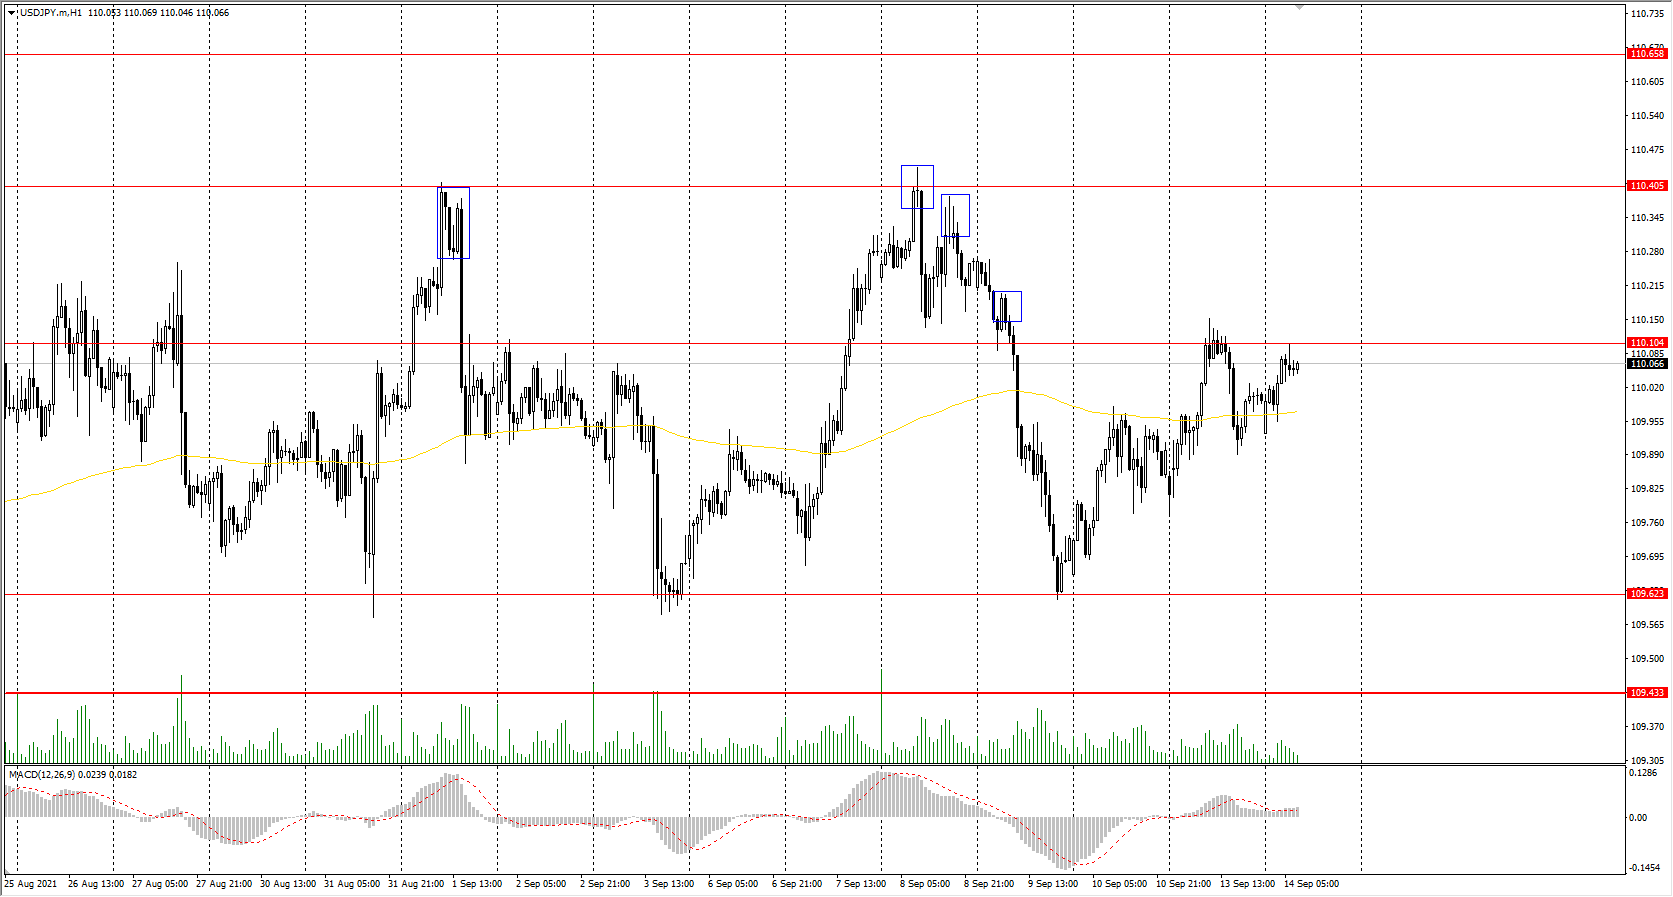
Support levels: 109.62, 109.43, 109.19, 108.65
Resistance levels: 110.11, 110.40, 110.66, 110.95, 111.48
The main trend on the USD/JPY currency pair is bullish. But the Japanese yen has shown strength in recent days, which, together with the rise in the dollar index, led to the formation of a wide trading range, within which the price has consolidated. The MACD indicator has become inactive. Under such market conditions, traders should look for buy trades from the support level where buyers show initiative throughout the day. Sell positions should be considered on the lower time frames with short targets from the zones where sellers show initiative.
Alternative scenario: if the price falls below 109.43, the uptrend is likely to be broken.
The USD/CAD currency pair
Technical indicators of the currency pair:
Prev Open: 1.2680
Prev Close: 1.2641
% chg. over the last day: -0.30%
The Canadian dollar is a commodity currency, so the USD/CAD currency pair is highly dependent on the dynamics of the dollar index and oil prices. By the end of yesterday’s trading session, the dollar index lost its positions while oil prices grew. As a result, the USD/CAD price has slightly decreased due to the strengthening of the Canadian dollar.
Recomendaciones de trading
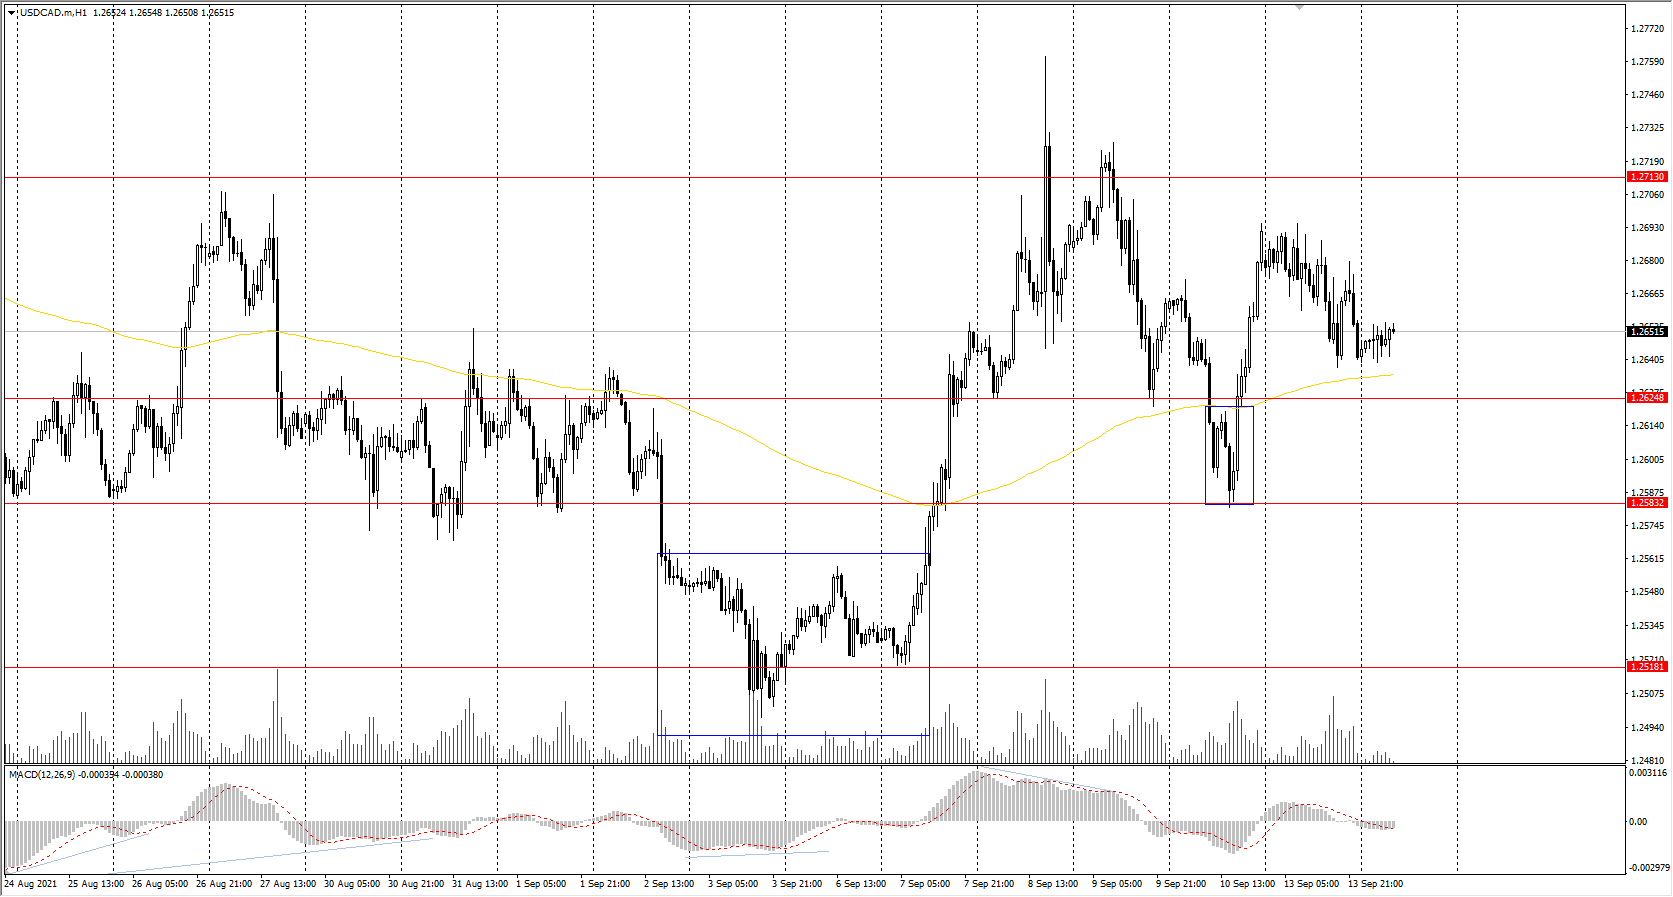
Support levels: 1.2625, 1.2583, 1.2518, 1.2425
Resistance levels: 1.2713, 1.2812, 1.2891, 1.2951
In terms of technical analysis, the trend on the USD/CAD currency pair is bearish. But the price has consolidated in a local correctional upward movement. The MACD indicator became inactive. Buy positions can be considered from the support levels where buyers show initiative, and only with short targets. It is better to look for sell positions from the resistance levels of a higher time frame.
Alternative scenario: if the price breaks through the 1.2812 resistance level and fixes above, the uptrend will likely resume.
Investors Are Waiting For Inflation Data In The US And Europe
The US stock indices closed in the green zone yesterday. The Dow Jones added 0.76%, the S&P 500 increased by 0.23%, while the Nasdaq Composite technology index slightly decreased by 0.07%. On the one hand, the market was positively influenced by the investors' expectations that inflation would not accelerate and the Federal Reserve System and the US government would continue to support the economy. On the other hand, Patrick Harker, head of the Philadelphia Fed, also wants the central bank to start cutting stimulus as soon as this year. It also should be noted that statistically, September and October are weak months for the major US indices. The indices tend to drop before winter and then experience a bullish rally for Christmas.
European stock indices also closed in the green zone due to an increase in energy companies' shares amid higher electricity and oil prices. The British FTSE 100 index added 0.6%, French CAC 40 increased by 0.2%, German DAX jumped by 0.6%, Italian FTSE MIB added 0.9%, and Spanish IBEX 35 jumped by 1.4%.
Commodity prices are rising again. European gas and electricity prices have set new records, while commodity prices are on the verge of exceeding ten-year highs. This threatens faster inflation, higher consumer spending, and pressure on central banks to limit the massive stimulus measures underlying much of the rise in commodity prices. Aluminum and steel prices have also resumed growth. OPEC+ officials see higher demand for oil this year and next.
Gold prices are trading around $1800 per troy ounce. Gold has lost some ground over the past 7 days as the dollar index and US Treasury bond yields increased. Traders should not expect the precious metals prices to grow substantially till the end of the year, and gold and silver are likely to lose their prices sharply if the "tapering" is announced.
Asian stock indices showed different dynamics yesterday. Australia's ASX200 index decreased by 0.31%, China's CSI300 blue-chip index decreased by 0.2%, but Tokyo's Nikkei 225 added 0.72%. Hong Kong Hang Seng Index and Chinese CSI300 have already lost 1.21% and 1.51%, respectively, since today’s opening. Alibaba Group Holding decreased by 1.6% yesterday. The Chinese authorities intend to split the Alipay payment service, which has more than 1 billion users. Beijing demands to separate Huabei and Jiebe online lending services into an independent business, attract outside shareholders, and create a separate application for these operations.
There is a new Delta outbreak in southeastern China. In just four days, 102 cases were reported in three cities in Fujian province with a population of 5 million. This is not much for the density of this region, but local authorities have already taken restrictive measures.
The head of the Reserve Bank of Australia (RBA), Philip Lowe, said that restrictions due to the coronavirus would cause a sharp decline in the economy this quarter but expressed confidence that activity would quickly recover after removing restrictions in the next quarter. Also, Philip Lowe confirmed that interest rates would remain low until 2024.
Main market quotes:
- S&P 500 (F) 4,468.73 +10.15 (+0.23%)
- Dow Jones 34,869.63 +261.91 (+0.76%)
- DAX 15,701.42 +91.61 (+0.59%)
- FTSE 100 7,068.43 +39.23 (+0.56%)
- USD Index 92.62 −0.02 (−0.02%)
Important events for today:
- Australia RBA Governor Philip Lowe’s Speech at 05:45 (GMT+3);
- UK Average Earnings Index (m/m) at 09:00 (GMT+3);
- UK Claimant Count Change (m/m) at 09:00 (GMT+3);
- UK Unemployment Rate (m/m) at 09:00 (GMT+3);
- US Consumer Price Index (m/m) at 15:30 (GMT+3);
- US Core Consumer Price Index (m/m) at 15:30 (GMT+3).
US Inflation Under The Microscope
- Markets brace for latest edition of US inflation today
- Wall Street stabilizes, aussie struggles on RBA signals
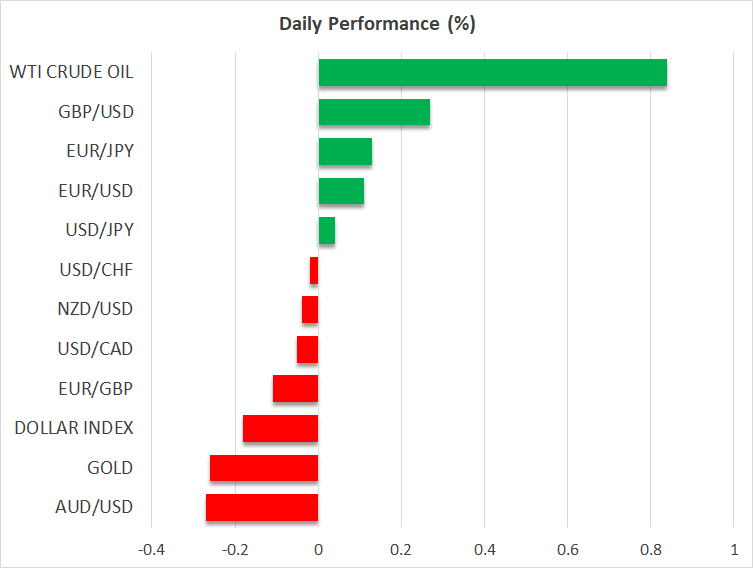
- Dollar takes a step back, British pound and oil advance
US inflation to set the tone
With the Fed having almost locked in a November taper announcement, the question now is whether Chairman Powell will use next week’s policy meeting to give the markets an early warning. The answer might boil down to what the upcoming inflation report shows. Forecasts suggest both the headline and core CPI rates inched down slightly in August on a yearly basis.
The main variable for the Fed will be whether inflationary pressures remain concentrated in a handful of reopening-linked sectors or whether they have started to broaden out. Any signs that price pressures are becoming more entrenched would likely boost the dollar as traders bring forward the Fed’s normalization timeline, but hit dollar-denominated assets like gold.
Of course, this will only affect short-term trading. Ultimately, it doesn’t matter much whether the Fed will push the taper button in September, November, or even December. It’s only a matter of time. The crucial part for FX markets is whether interest rates will be raised next year, which seems realistic in an environment of stickier inflation, especially if Congress makes good on its spending promises.
Wall Street stabilizes, oil pushes higher
US equities had a mixed performance on Monday. The Dow Jones rose 0.8% but the tech-heavy Nasdaq closed marginally lower as value plays outperformed growth. The S&P 500 was somewhere in the middle, advancing by 0.2%. Stocks with high growth potential have outperformed cheaper value names for a decade now thanks to low interest rates, to the point where the relative performance gap between the two has reached new extremes lately.
This is typically a harbinger of a sector rotation towards value plays, particularly in a market with already-stretched valuations and with several risks looming, such as a withdrawal of cheap liquidity and higher taxes for corporations. Value tends to weather any corrective storms much better.
In the commodity arena, oil prices are trading at six-week highs after hurricane Nicholas made landfall on the Texas Gulf Coast, threatening to throw drilling sites and refineries that are still reeling from hurricane Ida into more disarray. Natural disasters rarely have a lasting impact on oil prices, but when you chain two of them together at one of the world’s most important production hubs, it’s another story.
Dollar pulls back, aussie takes RBA hit
In the FX spectrum, things are relatively quiet. The US dollar surrendered its recent gains as the mood in equity markets improved and is currently on the back foot.
Meanwhile, the British pound is on the offensive after some encouraging jobs numbers. The unemployment rate fell to 4.6% and while wage growth cooled a little, it remains quite elevated, keeping real wages comfortably positive. There’s a risk of a spike in unemployment now that the furlough program is being tapered, but the record number of job openings in the economy suggests any such spike won’t last long.
Finally, the Australian dollar is under fire today after RBA Governor Lowe reaffirmed his central bank won’t raise rates until 2024 and questioned why markets are even pricing in rate hikes before that. Another source of worry is how China’s Evegrande debacle will play and how serious contagion risks are in case it defaults.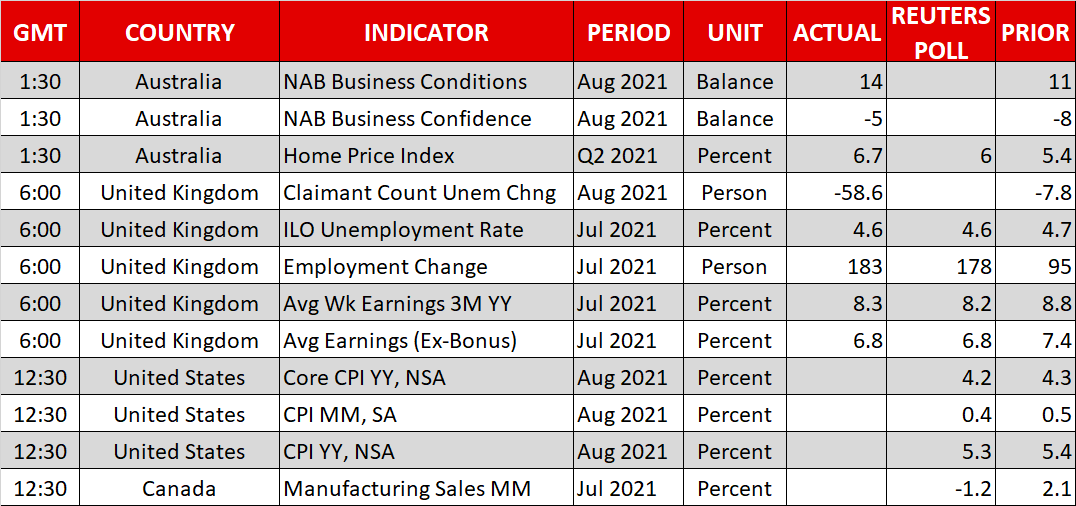
Oil Edges Higher, Gold Fidgets
Oil prices spike higher
When one looks back at oil’s price volatility over last week, what stands out is the short-term gnomes rush from one side of the range to the other on a daily basis. So, despite a lot of intra-day noise, prices really went nowhere last week. Friday was much the same, the rally almost exactly unwinding the falls of the day before as the theme of the day became Hurricane Ida disrupted US production, despite no one really caring the previous session. Nobody is better at fitting the most esoteric news stories to fit/justify the price action than oil markets.
Brent crude rose by 2.13% to USD 72.85 on Friday, with WTI climbing 2.40% to USD 69.60 a barrel, cancelling out Thursday’s price drops. Things have got a little more interesting in Asia with oil rising once again today, perhaps driven by the North Korean cruise missile test or news that Russia is struggling to raise production to meet its OPEC+ quotas. Either way, Brent crude is 0.40% higher at USD 73.15, and WTI is 0.55% higher at USD 69.95 a barrel. The latter may also be getting some post-Ida tailwinds.
Although it would not surprise me in the least if oil prices unwound their gains later today, with looking bid-at-the-top and offered-at-the-bottom oil’s Modus Operandi at the moment, today’s rally in Asia could potentially change the technical picture.
A rise by Brent crude through USD 73.70 a barrel could signal the rally has legs and target gains to the USD 76.00 a barrel area. Support is USD 72.70, followed by a big hole to USD 71.00 a barrel. Similarly, if WTI rises through resistance at USD 70.80, its rally could extend to USD 74.00 a barrel in the coming days. Support is at USD 69.60, followed by a very little until USD 67.60 a barrel.
Gold nervously steady
Gold continues to range between USD 1780.00 and USD 1800.00 an ounce, with a slight rise in the US dollar on Friday, pushing it 0.38% lower to USD 1787.50 an ounce. Another directionless session in Asia has seen it creep 0.23% higher to USD 1791.60 an ounce.
Gold’s price action continues to be seriously underwhelming, unable to rally when the US dollar falls and moving lower when it rises. Gold needs to recapture and hold above USD 1800.00 an ounce this week, preferable $1830.00, to soothe the nerves of nervous long-positions.
The balance of probabilities is increasing, though, that gold has more downside ahead. A daily close below USD 1780.00 opens further losses to USD 1750.00 an ounce. Failure of the latter could see gold fall as low as USD 1700.00 an ounce. Resistance in the USD 1800.00 to USD 1805.00 an ounce area continues to cap insipid attempts at recovery.
The US Dollar Remains Firm
US dollar calm ahead of consumer inflation
The US dollar spiked higher intra-day overnight after another Fed official joined the tapering bandwagon. The rally soon faded, though, as US yields moved slightly lower. The dollar index finished almost unchanged at 92.61, despite testing 92.90 during the session. It is unchanged in yet another wait-and-see Asian session.
It was much the same across the other major currencies, which fell versus the greenback intraday before rallying to finish almost unchanged for the day in New York. EUR/USD is trading at 1.1815, midway between support resistance at 1.1750 and 1.1850. GBP/USD is at 1.3845, midway between support resistance at 1.3800 and 1.3900. USD/JPY did not move overnight and is at 100.07 this morning, while markets wait for a break of its multi-week 109.50/110.50 range. AUD/USD and NZD/USD had a quiet overnight session before easing by 0.20% in Asia to 0.7250 and 0.7110, respectively. Higher US inflation tonight could send both sharply lower with support at 0.7340 and 0.7080 the levels to watch.
Except for the Singapore dollar, AsiaFX retreated modestly overnight, with the US dollar holding onto those gains. Notably, USD/MYR has risen to 4.1475 this morning, with the ringgit receiving no boost from higher oil prices. The new government honeymoon could be over as soon as it started. Especially as the new Prime Minister looks set to appoint former PM Najib Razak as an economic advisor. Seriously, you couldn’t make this up.
G-10 and Asian currencies look set to remain slightly offered versus the US dollar until the US inflation data this evening as markets remain torn between inflation nerves and tapering and peak recovery. The data may help to answer some of those questions, but in all likelihood, we are likely to see US dollar strength modestly continue into next week’s FOMC.
Asian Equities Track Wall Street Higher
Asian markets higher but China dips
US equities broke their modest losing streak last night, as the dip-buyers could wait no longer. US yields eased slightly, and buyers pushed the S&P 500 0.23% higher and the Dow Jones 0.77% higher. Fears that the Democrats will raise corporate taxes to 25% seemed to weigh on the tech-heavy Nasdaq, which finished 0.07% lower. Given that big-tech doesn’t pay a lot of tax relatively anyway, and that saying and actually passing tax rises in the US are two totally different beasts, the negativity around the Nasdaq is probably overdone. Apple is releasing some new iPhones tonight, which should be enough to spark a tech rally.
Investors are keeping a close eye on tonight’s US inflation data, with Headline Inflation MOM expected at 0.40% and Core Inflation MoM at 0.30%. Nobody was talking about tapering and inflation after the disastrous Non-Farm Payrolls two weeks ago; but if inflation comes in higher than expected, tapering fever will evident. With markets back on inflation and tapering watch, the path of least resistance is higher prints from the data. That would likely weigh on equities.
In Asia, equities are mostly higher, except China, where Evergrande worries and the further disembowelling of Ant Financial yesterday continue to weigh on China markets. The Shanghai Composite has fallen by 0.20%, and the CSI 300 and Hang Seng are lower by 0.30%.
Elsewhere, the picture is brighter. The Nikkei 225 is 0.40% higher, with chip-makers boosting the Kospi by 0.80%. Singapore has climbed 0.35%, while Taiwan is hovering just above unchanged. Kuala Lumpur bucks the trend, falling 0.30% today, but Jakarta has risen by 0.40%. In Australia, an overnight tumble by iron ore prices seems to be weighing on local markets, the ASX 200 and All Ordinaries falling by 0.20%.
European markets shook of Asia’s nerves yesterday to open higher, and I expect they will do so again this afternoon, given the mostly positive, if quiet, Asia session.
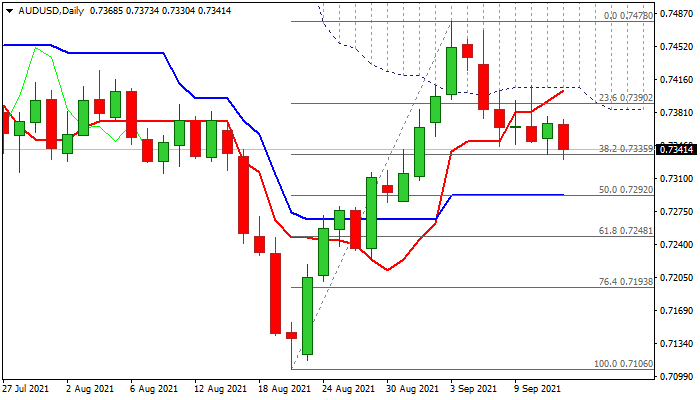
AUD/USD Outlook: Aussie Dips To Two-Week Low On Dovish RBA, US CPI Data In Focus
The Australian dollar accelerated lower in late Asian / early European session on Tuesday, pressured by dovish comments from RBA governor Lowe.
The central bank’s outlook remains optimistic regarding economic recovery, with expectations that growth will pick up in the fourth quarter after slowdown in Q3 due to lockdowns.
But the RBA remains very cautious regarding interest rates and Lowe signaled that interest rates are not expected to rise from record lows until 2024, mainly due to persistently slow wage growth, countering the market expectations for the first rate hikes in late 2022 and 2023.
Fresh weakness hit two-week low on probe through pivotal Fibo support at 0.7335 (38.2% of 0.7106/0.7478 upleg), signaling continuation of pullback from 0.7478 (Sep 3 recovery high) after thee-day congestion.
Bears are boosted by falling daily cloud and eye daily Kijun-Sen (0.7292), clear break of which would signal an end of corrective phase (0.7106/0.7478) and risk extension towards 0.7248/00 (Fibo 61.8% / psychological).
Rapid loss of bullish momentum on daily chart supports the action, but oversold stochastic warns that bears may face headwinds, but near-term bias is expected to remain bearish while the price action remains capped by falling 55DMA (0.7367).
US inflation data, due later today, are in focus and could further lift the US dollar on better than expected Aug figures.
Res: 0.7367, 0.7383, 0.7409, 0.7426.
Sup: 0.7312, 0.7292, 0.7248, 0.7222.
Gold Is Waiting For The US Inflation Data
US consumer inflation is in the spotlight today. Investors expect a slowdown in the year-over-year growth rate from the current 5.4% (it’s a high of the last 30 years).
The wait-and-see attitude of the markets probably reduced the degree of pressure on the US stock prices, where indices managed to turn higher intraday and close in the green zone after four sessions of decline.
Inflation data can add to market volatility by triggering a reassessment of Fed policy expectations, affecting currencies, equities, and gold prices.
The producer price data showed a decline in the monthly price growth rate, but enough to push the annual inflation rate further upwards. Furthermore, the overall price growth rate remains distinctly above the Fed's target, exceeds the average inflation rate of the last 20 years (2.2% for PPI and 2.1% for CPI) and removes the anchor of inflation expectations.
Higher inflation figures would raise again a question of accelerating the withdrawal of stimulus. If data is firmly above forecasts it will revive speculation that the Fed is supposed to announce the start of a QE rollback as soon as the next week. These expectations have fallen sharply after the disappointingly weak labour market figures at the beginning of the month. Several other indicators also demonstrated a loss of economic growth momentum.
High inflation figures have the potential to bring back correction sentiment in equity markets after a brief pause. Annual inflation above 5.5% might be a strong reason for the S&P500 to break support at its 50-day moving average (now at 4430), sending the index to test the August lows at 4353 and even trigger a deeper correction towards 4100.
Gold, hovering around $1790 since last Thursday, might take an even harder hit. The bears are waiting for a good signal to launch an attack. It is now holding it below significant levels, a major round level of $1800 and under the 200 and 50-day moving averages. The first of these averages have been in place for the last two and a half months.
Gold stocks have continued to fall in recent days, losing 3-4% over the last month, although gold prices have been little changed over the same time, reflecting disbelief in the sector's prospects.
Meanwhile, uncertainty over the Fed's future moves and inflation is now relatively high. The closest similar period in history was in 2011-2012 when gold prices fluctuated between $1530 and 1800. Now a similar sideways movement is in the range of $1690-1900.
The inability to steadily overcome $1800 in previous weeks and weak interest in gold stocks suggest that in the coming days, we will see a move towards the lower boundary of the range to the area of $1690.
GBPUSD Flattens Near 200-Day SMA, Neutral Overall
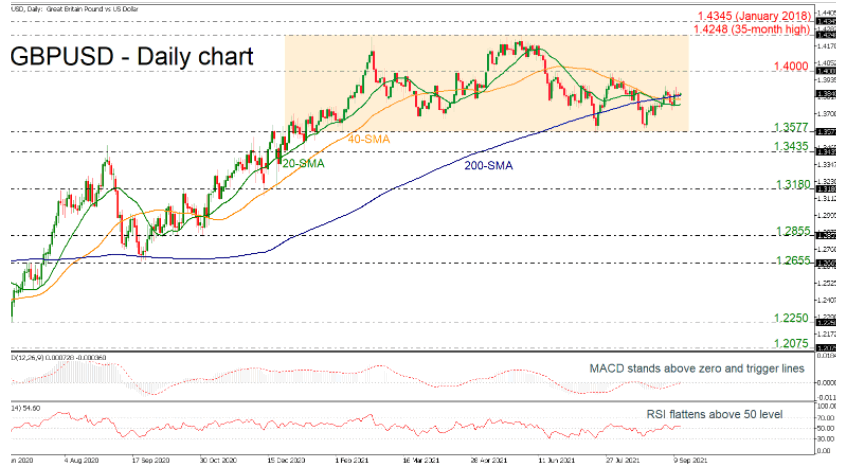
GBPUSD has been in a trading range since the end of December 2020, showing no significant directional moves.
In the short-term picture, the price is also flattening near the strong 200-day simple moving average (SMA), with the technical indicators confirming the neutral bias. The MACD is holding near its zero line and the RSI is moving sideways above the 50 level, both with weak momentum.
Should the pair strengthen its positive momentum, the next resistance could come around the 1.4000 psychological mark, which has been acting as a mid-level of the broader consolidation area. Above this level, the next target could be placed within the 1.4248-1.4345 region, a break of which would shift the bias to positive.
However, if prices are unable to break into the upper half of the range, the risk would shift back to the downside, with the 20-day SMA at 1.3770 coming into focus. Even lower, the next key support to watch could be detected near 1.3577 and 1.3435. Failure to hold above these boundaries would switch the neutral phase to negative.
Overall, GBPUSD has been incapable to post any significant moves in the broad picture. Only an exit from the long-term consolidation area would change the current view.