Sample Category Title
Pound Rises after Solid Job Data
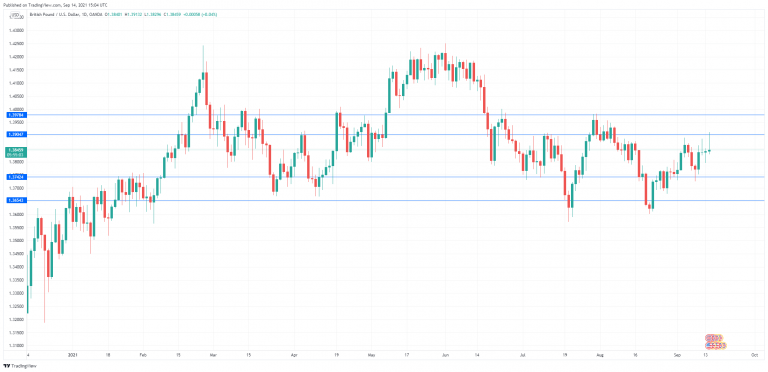
The British pound showed gains earlier in the day and punched above the 1.39 line. However, the currency was unable to consolidate these gains. GBP/USD is currently trading at 1.3853, up 0.09% on the day.
UK labor market continues to improve
There was positive news on the UK employment front earlier in the day. The number of payroll employees moved up for a ninth straight month, unemployment rolls continue to fall sharply, and the unemployment rate fell to 4.6%, down from 4.9% beforehand. This is certainly encouraging news, but not to such an extent that Bank of England policymakers will feel much pressure to raise interest rates. If, however, economic activity continues to improve and the Delta variant of Covid is brought under control, the BoE may have to reconsider its wait-and-see policy.
Has US inflation turned a corner?
Inflation remains high on the radar of the markets, and today’s consumer inflation numbers were highly anticipated. The recent spike in inflation levels, which has been fueled by the reopening of economies and the easing of Covid restrictions, has become an important factor in the Fed’s decision-making process. The Fed has insisted that the spike in inflation is temporary, but the markets have become more sceptical as inflation levels continue to climb.
The August CPI numbers pointed to a slight easing in inflation, and may signal that inflation is finally under control. Headline CPI registered a 0.3% gain (MoM), down from 0.5% in July. On an annualized basis, CPI gained 5.3%, down slightly from 5.4% in July. Core CPI dipped to 0.1% (MoM), down from 0.3% in July. Core CPI (YoY) rose 4.0%, down from 4.3% beforehand. If inflation continues to ease, the Fed can afford to delay its tapering plans and this could put downward pressure on the US dollar.
GBP/USD Technical Analysis
- There is resistance at 1.3904. Above, there is resistance at 1.3978
- On the downside, we have support at 1.3742 and 1.3654
NZ Dollar on Unsteady Hround ahead of GDP
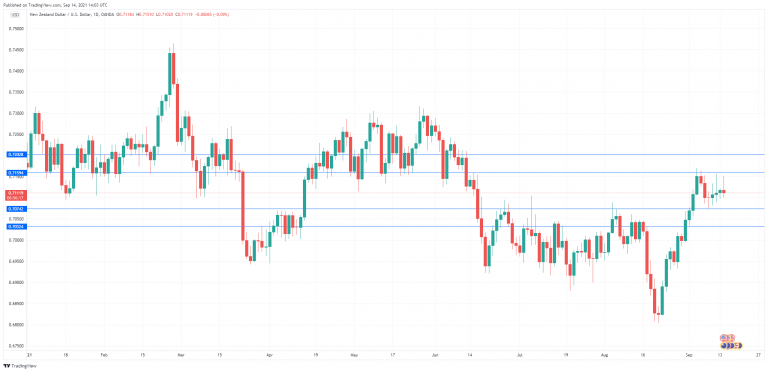
The New Zealand dollar moved higher earlier in the day but has since surrendered these gains. NZD/USD is currently trading at 0.7114 down 0.06% on the day.
New Zealand GDP ahead
New Zealand releases GDP for the second quarter on Wednesday, and the kiwi could have a banner day. The consensus stands at a whopping 16.3% gain (YoY). Granted, the consensus is significantly inflated since it is in comparison with Q2 of 2020, when Covid-19 was at its height. Still, a double-digit gain would point to strong economic activity and investors would likely give a thumbs-up to the New Zealand dollar. The New Zealand dollar has barreled higher, with gains of 1.1o% in August and 0.97% in September. The RBNZ has been forced to delay plans to hike interest rates, but a strong GDP report is sure to fuel speculation of a rate hike in the coming months. There’s little doubt that RBNZ policymakers are itching to raise rates – after the August policy meeting, Assistant Governor Christian Hawkesby stated that “a 50 basis point move was definitely on the table”.
US CPI slows, a bit
Inflation has become closely watched, after years of low inflation which hardly garnered a comment. The recent spike in inflation levels, which has been fueled by the reopening of economies and the easing of Covid restrictions, could have a crucial impact on the Federal Reserve’s monetary policy. The Fed has insisted that inflation will cool down, but the markets have become more sceptical with each passing month that inflation moves higher.
The August CPI data may, however, support the Fed’s stance. Headline CPI registered a 0.3% gain (MoM), down from 0.5% in July. On an annualized basis, CPI gained 5.3%, down slightly from 5.4% in July. Core CPI dipped to 0.1% (MoM), down from 0.3% in July. Core CPI (YoY) rose 4.0%, down from 4.3% beforehand. This does not mark a huge slowdown by any means, but may signal that inflation has finally been brought under control. If so, there will be less pressure on the Fed to taper, which could weigh on the US dollar.
NZD/USD Technical
- There is resistance at 0.7159 and 0.7202
- On the downside, there is support at 0.7074. Close by, there is support at 0.7032
Fed Vindicated a Little as this Round of Inflation Looks Transitory, Stocks Pop on Soft CPI and More
It looks like the Fed may have got inflation right. An inflation slowdown could be what is needed to justify their taper delay and suggests they have a couple more months to see how the labor market recovery unfolds. Softer inflation numbers sent US stocks initially higher as expectations for a Fed taper announcement drift to December.
The Russell 2000 index initially outperformed as softer inflation data helps small-cap stocks the most, but that rally did not last. The rotation back to the reopening trade was faded, as economists saw trouble for US companies’ margins, mainly because the rise in producer prices was not passed onto the consumer. The Russell 2000 index and Dow Jones Industrial Average quickly turned negative, while the S&P 500 index was slightly lower and the Nasdaq was grasping at a small gain.
The focus will shift to Apple’s big reveal for the iPhone 13, a new Apple Watch and AirPods. The annual event will likely excite the consumer and lead to a very strong holiday season for Apple. Apple shares are heading into this event well off its record highs, which could allow for strong upside if they impress today.
The next big round of economic releases happens tonight in Asia, which could show the Chinese economy continues to slow. If growth slows too quickly, traders should not be surprised to see more easing from Beijing.
Inflation
The relentless surge across some prices have started to decline. Used car and truck prices declined 1.5%, a positive sign that the global chip shortage might be easing a little bit. This inflation round easily went to team transitory as indexes for airline fares, used cars and trucks, and motor vehicle insurance all declined over the month. Inflation that is hitting the economy is mostly food and energy prices.
The other economic data release of the day was the NFIB small business optimism index. Small business owners are losing confidence in the strength of future business conditions, which could support the Fed’s patience in tapering. Fifty percent of owners said openings could not be filled, up a point from July and a 48-year record high. The problem with the labor market is there is an insufficient amount of qualified candidates for the record amount of job openings. The headline NFIB small business optimism index rose 0.4 points to 100.1.
Oil
Crude prices settled higher after first going on a rollercoaster ride in early trade. Oil prices tumbled early after China announced the plan to sell 7.38 million barrels from its strategic reserves. Last week, China shocked energy markets by announcing that they would tap their reserves for the first time. The China reserve sale driven drop was short-lived as energy traders viewed the amount of barrels as small, roughly a half day’s worth of crude processing.
The focus in the energy market still remains on US production and if Storm Nicholas leads to flooding that could keep production shut-in.
WTI crude rallied after a softer than expected CPI reading sent the dollar sharply lower. Oil rallied alongside all risky assets as the smallest price gain in seven months suggested the Fed won’t be in a hurry to make a taper announcement.
The US inflation report showed the index for airline fares plunged, decreasing 9.1% over the month, a confirmation that demand has moderated.
With an oil market still heavily in deficit, WTI crude will continue to rise if US stockpiles continue to fall and if China’s economy doesn’t slow down too much. Over the short-term WTI crude should not have much trouble hitting the mid-$70s.
Gold
Gold prices got a strong boost from a lighter-than-expected inflation report, that completely removed the risk of a September Fed taper announcement and likely shifted expectations all the way to December. Treasury yields plunged and that helped gold tentatively pierce the $1800 level. This is a pivotal moment for gold and if it can’t push higher as yields plunge, selling pressure could quickly return.
CPI is decelerating and that should be very good for gold in the short-term as real interest rates go down. After the August CPI print, gold should have enough momentum to stabilize above $1800 by the end of today, but if it doesn’t, it could get very ugly.
Bitcoin
Bitcoin prices rebounded after a better-than-feared CPI report sent Treasury yields plunging. The Fed is in no rush to taper and that overflowing bowl of stimulus is good news for cryptocurrencies. Relentless government spending and chaos in fiat currencies is good news for Bitcoin and that narrative is not going away anytime soon. Today, the Mexican central bank said the government bought international reserves worth $7 billion in the past week. Mexico has a debt problem and that story is shared with most of Latin America.
Bitcoin appears to be stabilizing and could continue to consolidate around the $45,000 to $50,000 level.
Canada’s Inflation to Approach 4%, Reinforce BoC October Taper
The Canadian dollar is close to erasing its yearly gains even though the Bank of Canada is ahead of other central banks in terms of withdrawing pandemic-era stimulus. Expectations of tapering appear to have been fully priced in, so investors are seeking fresh incentives to turn bullish on the loonie again. Hotter-than-anticipated inflation might be one such incentive. The latest readings on the consumer price index (CPI) are out on Wednesday at 12:30 GMT.
Some unforeseen headwinds
Canada’s economy unexpectedly contracted in the second quarter as the damage from the spring lockdowns was far greater than what was projected by most, including the BoC. Although the recovery has gotten back on track during the third quarter and Canada’s very high vaccine uptake is keeping a lid on the Delta wave, the fact that the economic slack is now larger than previously thought and uncertainty surrounding the outlook has increased considerably, investors see little chance of the Bank of Canada accelerating its normalization timeline.
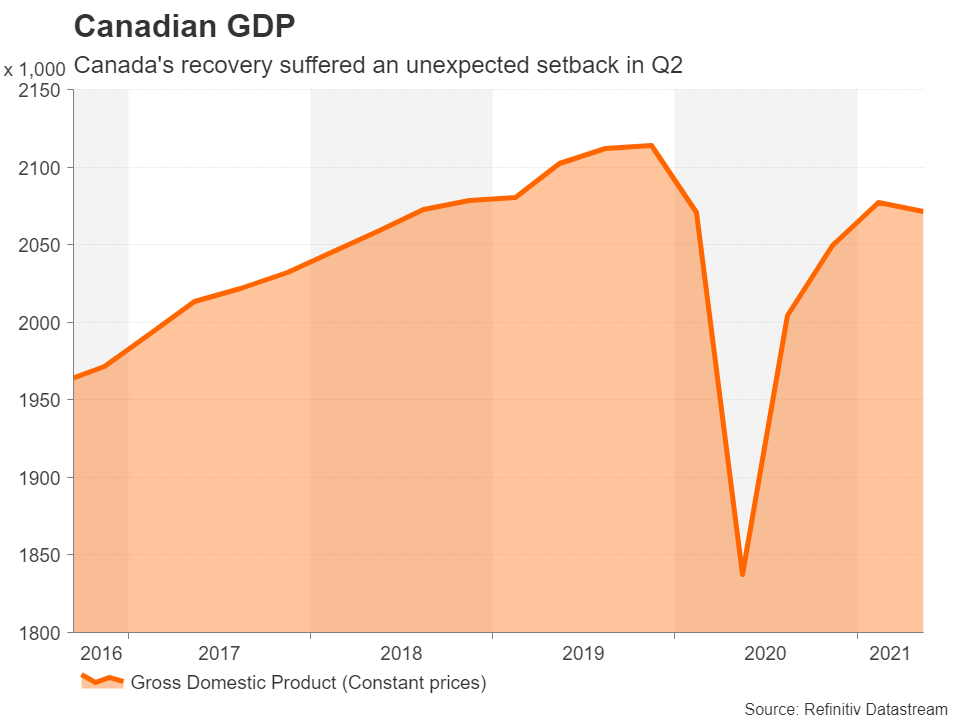
Back in April, the BoC predicted that the pandemic-induced slack in the economy would be absorbed in the second half of 2022, fuelling speculation of an end-of-year rate hike. But given the somewhat gloomier picture about the global economy in recent months, it seems likely that even if the BoC’s normalization path isn’t derailed, the end of 2022 is the earliest that policymakers will be able to raise interest rates.
Loonie has been underperforming
This may be what’s taken the wind out of the loonie’s sales lately as the other commodity dollars such as the aussie and kiwi have made a much more impressive rebound against the US dollar after the Fed taper fever died down in mid-to-late August. The BoC was only mildly worried about the elevated downside risks at its September meeting, but investors have nevertheless appeared to have pared back expectations of hawkish surprises going forward.
CPI to hit close to 4% in August
However, with inflation in Canada simmering almost as hot as in south of the border, it’s almost certain that there will be one more round of tapering by year end. Canada’s headline CPI rate jumped to a decade-high of 3.7% year-on-year in July. It is forecast to rise further in August, to 3.9%, well above the BoC’s upper target range of 3%. The month-on-month rate, however, is forecast to ease to 0.1% from 0.6%, which could be a sign that some of the transitory factors pushing up prices are fading.
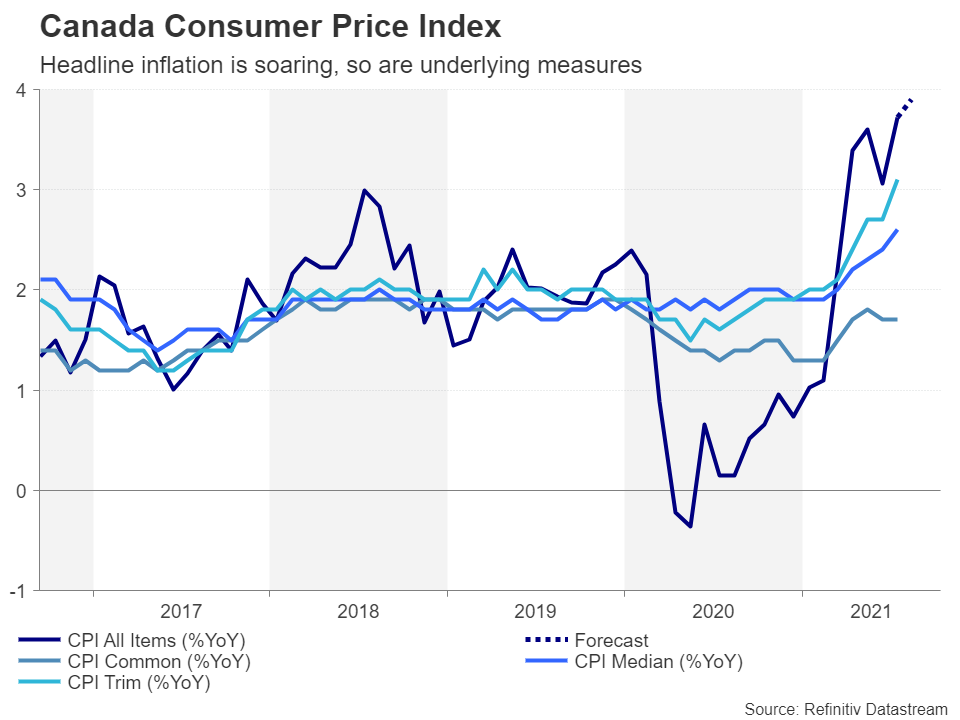
Traders will also be keeping an eye on the Bank of Canada’s three core measures of inflation: CPI Common, CPI Median and CPI Trim. The Median and Trim readings have picked up substantially lately, adding to policymakers’ urgency in wanting to scale back their bond purchases. A further uptick in these measures in August would underscore the need for the BoC to reduce its weekly purchases by another C$1 billion in October.
Loonie needs more than CPI boost to regain front foot
If the CPI data do not disappoint or even exceed expectations, the loonie might firm a little against the greenback. Dollar/loonie could slide back towards its 50- and 200-day moving averages to make a fresh attempt to break below the 1.2475 support region. Below that, the 1.23 mark would be the next critical level for the loonie bulls, though this would be a much more challenging barrier and may be difficult to overcome unless the Fed lays out a dovish taper path of its own.
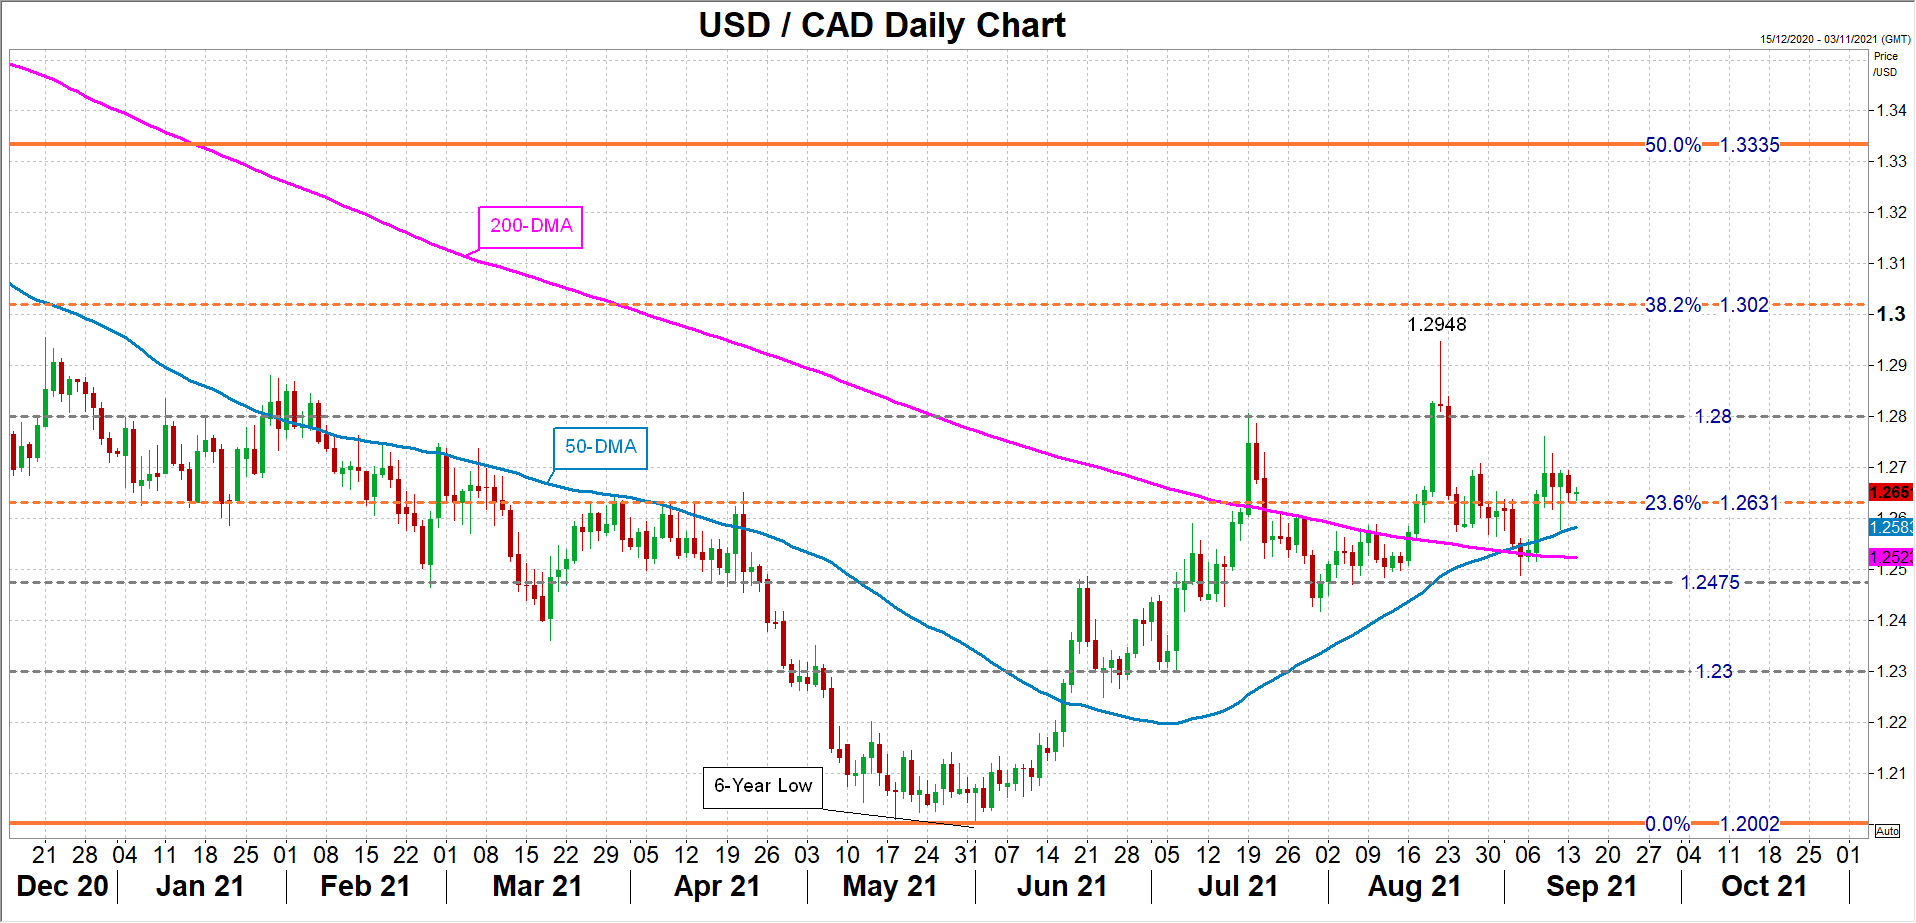
However, if the CPI numbers are weaker-than-expected, dollar/loonie could climb towards the 1.28 level initially, before having another go at the August peak of 1.2948.
Sunset Market Commentary
Markets
US August CPI inflation data took center stage today. Both headline and core inflation slowed on a monthly and yearly basis, generally coming in below consensus. The headline reading printed at 0.3% M/M and 5.3% Y/Y, implying a fourth month straight of 5%+ inflation. Core inflation rose by 0.1% M/M, to be up 4% Y/Y. It was the slowest monthly increase for the core gauge since February. Details showed an impact from the Deltavariant outbreak via for example monthly declines in lodging away from home (-2.9% M/M) and airline fares (-9.1% M/M). Bloomberg Economics broke the CPI figure down in re-opening components and non-reopening components. The former contributed -0.22% to the monthly decline in CPI while the latter contributed 0.35%, the most since December 2016. Used car prices seem over their top as well (-1.5% M/M) while the semiconductor shortage continues to put upward pressure on new car prices. Owners’ equivalent rent of residence doesn’t show the feared acceleration yet; rising at a steady 0.3% M/M.
Markets reacted following the “dovish” interpretation of the inflation numbers i.e. siding with the Fed’s temporary inflation argument and suggesting that the doves inside the FOMC gain some additional leverage to postpone the effective start of slowing down net asset purchases by some months. A below-par September payrolls is their other argument to buy some time still. We still expect a tapering announcement at next week’s FOMC meeting and argued before that a small time lag between announcement and start could be the resulting quid pro quo. In our base scenario, net asset purchases grind to a halt by mid next year, allowing for a first rate hike by the end of 2022. In any case, US Treasuries outperformed German Bunds today. US yields shed 0.6 bps to 1.4 bps with the belly of the curve outperforming the wings. German yields add 0.5 bps to 1 bp across the curve. 10-yr yield spread changes vs Germany are broadly unchanged with Italy (-3 bps) outperforming. Relative yield dynamics played in the dollar’s disadvantage with EUR/USD jumping from 1.18 to 1.1840 on the release. The trade weighted dollar tests last week’s low at 92.33. USD/JPY is still pivoting around the 110 big figure.
News flow was extremely thin apart from the US CPI. We retain sterling strength, probably related to the UK vaccine booster drive since strong UK labour market data didn’t spark an immediate market reaction this morning. EUR/GBP changes hands in the low 0.85 area. GBP/USD takes out 1.39 for the first time since early August.
News Headlines
Swedish inflation accelerated significantly in August. The headline number jumped from 1.4% y/y to a consensus-beating 2.1%. Inflation measured using a fixed interest rate (CPIF), the Riksbank’s favorite gauge, soared from 1.7% to 2.4%. Core CPIF stripping energy prices rose from 0.5% y/y to 1.4%. Clothing & footwear, household goods and restaurants & hotels all spurred last month’s price increases. The August reading was higher than the Riksbank projected in its July inflation report and is probably going to result in an upward revision of its inflation forecast when governor Ingves reconvenes next week. CPIF in the last report was seen at 1.7-1.8% the entire policy horizon. Being below the 2%-target, the central bank did not pencil in any rate hikes until deep in 2024. Today’s outcome at the very least questions this flat rate path. The Swedish krone strengthened from EUR/SEK 10.16 to 10.13.
The EU returned to the bond market today. It was selling seven-year debt for which it pulled another massive orderbook worth more than 85bn euros. The EU eventually tapped 9bn of bonds maturing in 2028 via banks with a pricing set at 14 bps below swap. The sale is part of the EU’s €800bn big recovery programme of which roughly a third will be in green bonds (sale starting in October). The European bloc will also start selling short-dated bills for the first time tomorrow.
US: Transitory Sources of Inflation Slowed in August CPI
Consumer price growth continued to cool in August, up 0.3% month-on-month (m/m), down from 0.5% in July. As a result, headline inflation was 5.3% year-on-year (y/y), a tick below July's pace.
Core inflation (ex. food and energy) also continued to cool, rising a modest 0.1% m/m in August, after rising 0.3% m/m in July. That saw the year-on-year rate of core inflation ease to 4.0% in August, down from 4.3% in July.
Energy prices bucked the broader cooling trend, rising 2.0% m/m on higher prices at the pump. Energy costs have risen for three consecutive months were up 25% versus a year ago.
Underneath the modest increase in core prices, core goods prices rose 0.3% m/m. New vehicle prices continued to rise sharply, up 1.2% m/m in August. However, used vehicle prices continued to ease after their pandemic-related spike, declining 1.5% in August. Prices for household furniture and operations were also up 1.3% m/m, driven mainly by furniture.
Prices for core services were flat in August, coming down from hotter readings in the spring. The important shelter category rose a trend like 0.2% m/m, as slightly larger 0.3% increases for rent and owners' equivalent rent were weighed down by a 2.9% m/m drop in lodging away from home. Transportation services prices fell 2.3% m/m overall, led lower by a 9.1% m/m drop in airline fares and an 8.5% m/m drop in car and truck rental prices.
Key Implications
As expected, many of the re-opening-related price spikes seen through the spring cooled in August. "Travel-related" prices, which had been a big factor in driving 30-year highs in core inflation in the spring, fell in August helping to keep core inflation tame. The path forward for these travel related prices is highly uncertain. With Covid cases at high levels in many parts of country, demand for travel is likely to remain subpar for the near future.
August's inflation data supports the Fed's view that much of the inflation spike in recent months has proven transitory. Travel-related services, and used car prices are cooling. However, other key categories are quietly warming up in the background. Rent inflation is picking up, as is medical care. And once the post-pandemic price reversals are no longer a weight on inflation, these more persistent categories are likely to help keep inflation above target. We continue to expect the Fed to start tapering asset purchases by year end, consistent with Powell's recent messaging at Jackson Hole.
Canada’s Manufacturing Sales Pull Back in July
Canada's manufacturing sales fell 1.5% (m/m) in July, slightly worse than Statistics Canada's flash estimate of -1.2%. The picture was less encouraging after accounting for price effects, with manufacturing shipment volumes down 1.7% on the month.
The decline in manufacturing shipments spanned 12 of the 21 industries. Wood products (-21.8%), aerospace products and parts (-19%), petroleum and coal products (-2.3%), and miscellaneous products (-12.1%) were the main drivers of the contraction. Sales of motor vehicles (+13.5%), motor vehicle parts (+7.6%), primary metals (+3.9%), and plastics and rubber products (+3.3%) provided some offset.
Forward looking indicators were mixed, with new orders down 2.6% and unfilled orders up 0.6%. Inventories increased 2.6%, lifting the inventory-to-sales ratio to 1.58 (from 1.51 in June).
Key Implications
It's one step forward, two step backwards for Canada's manufacturing sales. Just as auto sales are starting to show signs of life, other industries are taking a bite out of growth. July's release adds to the list of recent indicators pointing to a soft patch in Canada's economy early on in the summer, and adds credence to Statistics Canada's expectations for a 0.4% decline in real GDP in July.
It could get worse before it gets better for the manufacturing sector. August's Labour Force Survey data revealed declines in employment and hours worked, a negative signal for output in the industry during the month. But it's not all gloom. PMI indicators suggest that sentiment in the industry is still solid in both in Canada and the United States. The outlook, however, remains clouded by supply chain disruptions. Should these constraints continue to gradually dissipate, a normalization in auto production (which remains far detached from pre-pandemic levels) could provide a decent lift to overall manufacturing output in the coming quarters.
EUR/USD Mid-Day Outlook
Daily Pivots: (S1) 1.1782; (P) 1.1799; (R1) 1.1829; More...
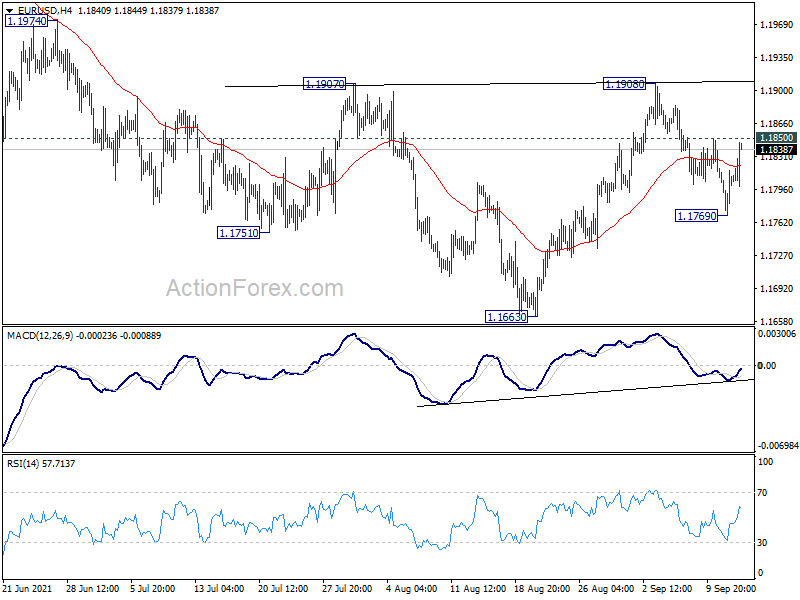
Intraday bias in EUR/USD stays neutral first. On the upside, break of break of 1.1850 will turn bias back to the upside for 1.1907/1908 key structural resistance zone. Sustained break there will complete a head and shoulder bottom pattern (ls: 1.1751; h: 1.1663; rs: 1.1769). That would also revive the case that consolidation pattern from 1.2348 has completed. Such development will turn near term outlook bullish for retesting 1.2348 high. On the downside, below 1.1769 will resume the fall from 1.1908 to retest 1.1663 low.
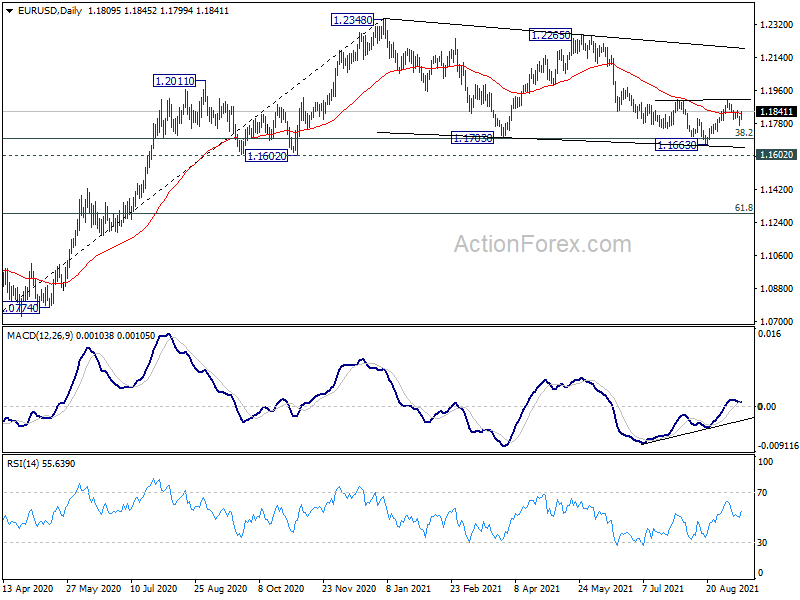
In the bigger picture, rise from 1.0635 is seen as the third leg of the pattern from 1.0339 (2017 low). Further rally remains in favors long as 1.1602 support holds, to cluster resistance at 1.2555 next, (38.2% retracement of 1.6039 to 1.0339 at 1.2516). However sustained break of 1.1602 will argue that the rise from 1.0635 is over, and turn medium term outlook bearish again. Deeper fall would be seen to 61.8% retracement of 1.0635 to 1.2348 at 1.1289 and below.
USD/CHF Mid-Day Outlook
Daily Pivots: (S1) 0.9189; (P) 0.9215; (R1) 0.9250; More....
Intraday bias in USD/CHF is turned neutral with the current retreat. ON the downside, break of 0.9149 will turn focus to 0.9098 support. Break there will target further decline to 0.9017 support. On the upside, break of 0.9239/41 will target 0.9273 resistance instead.
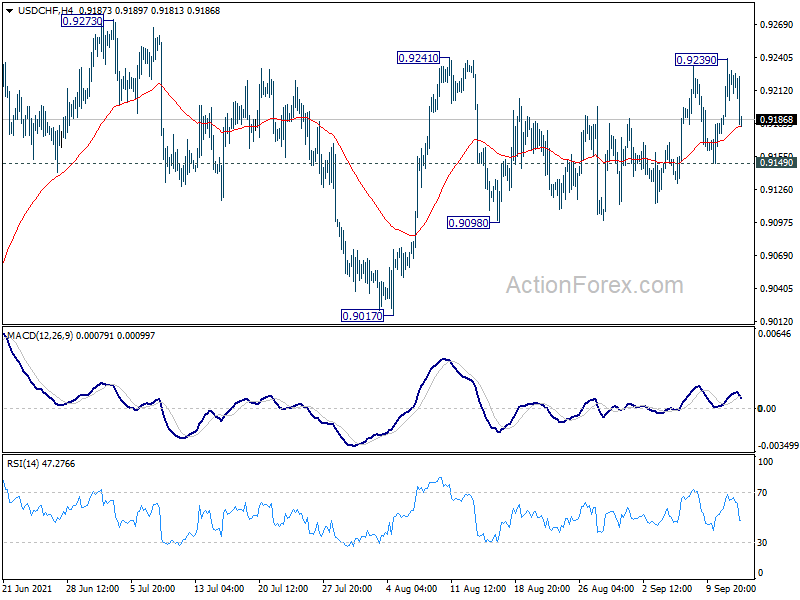
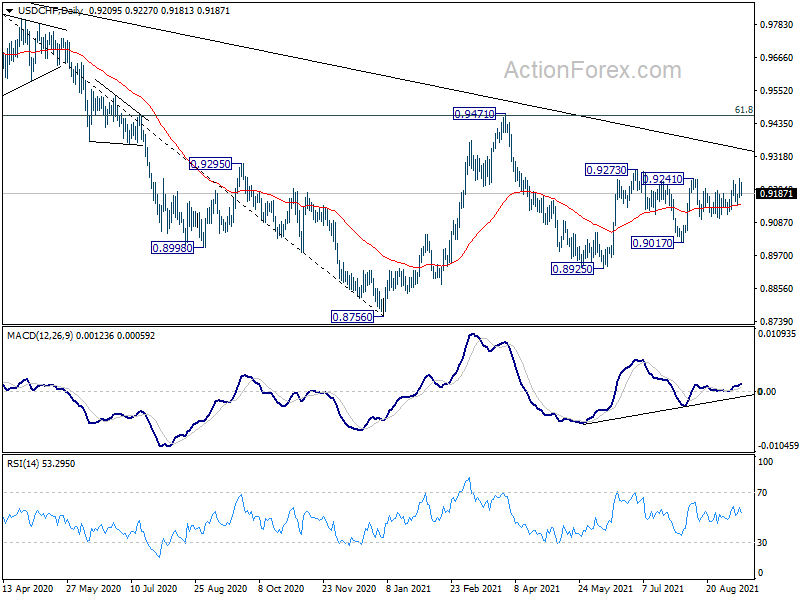
In the bigger picture, USD/CHF is still struggling around 55 week EMA (now at 0.9178) and outlook is mixed for now. Confirmed rejection by the 55 week EMA will retain medium term bearishness. That is, larger fall from 1.0342 would resume through 0.8756 low at a later stage. However, sustained trading above 55 week EMA will tilt favor to the case of bullish reversal. Focus would then be turned to 0.9471 resistance for confirmation.
USD/JPY Mid-Day Outlook
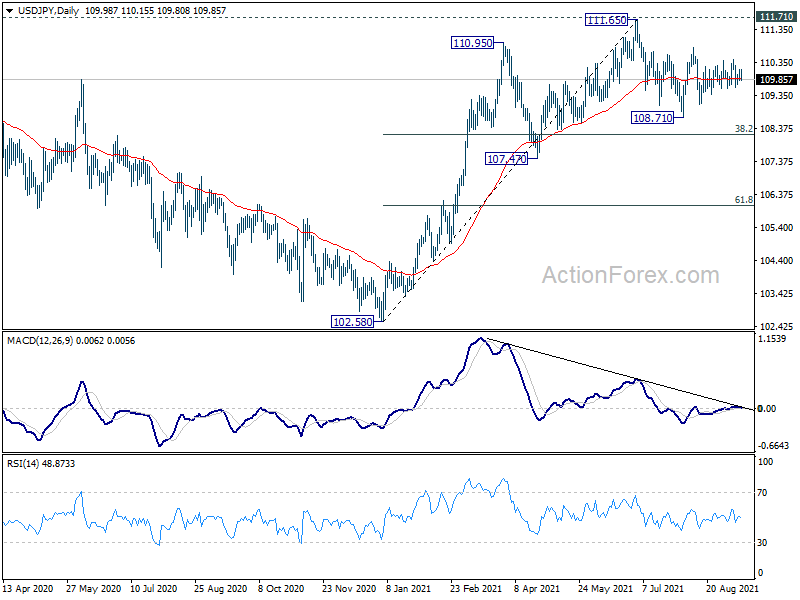
Daily Pivots: (S1) 109.85; (P) 110.01; (R1) 110.16; More...
USD/JPY drops mildly today but stays in range of 109.10/110.79. Intraday bias remains neutral for the moment. On the upside, break of 110.79 will resume the rebound from 108.71 to retest 111.65 high. On the downside, break of 109.10 will target 108.71 support first. Firm break there will resume the decline from 111.65 and target 38.2% retracement of 102.58 to 111.65 at 108.18 next.
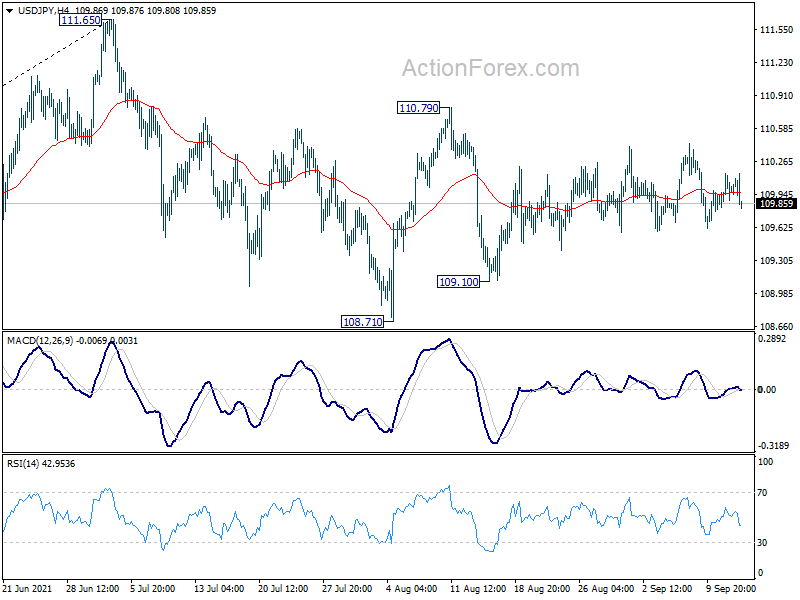
In the bigger picture, medium term outlook is staying neutral with 111.71 resistance intact. The pattern from 101.18 could still extend with another falling leg. Sustained trading below 55 day EMA will bring deeper fall to 107.47 support and below. Nevertheless, strong break of 111.71 resistance will confirm completion of the corrective decline from 118.65 (2016 high). Further rise should then be seen to 114.54 and then 118.65 resistance.