Sample Category Title
USD/CAD Bounces Off Support
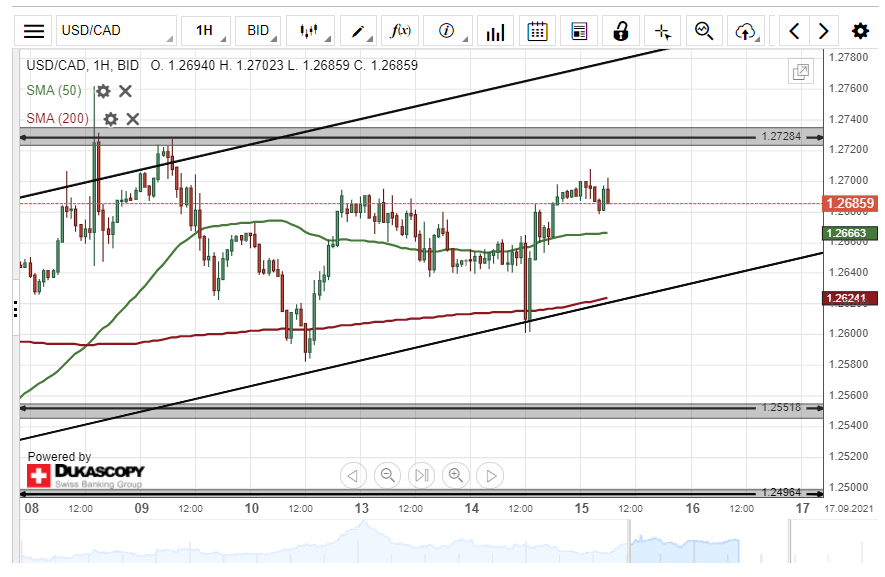
The USD/CAD currency pair bounced off a support level formed by the 200– hour simple moving average at 1.2622 on Tuesday. As a result, the US Dollar surged by 88 pips or 0.70% against the Canadian Dollar.
As for Wednesday's trading session, the exchange rate could continue to trend higher. Bullish traders might target the 1.2760 level during the following trading session.
However, the currency exchange rate could encounter resistance at 1.2728 within the following trading session.
GBP/JPY Breakout Occurs
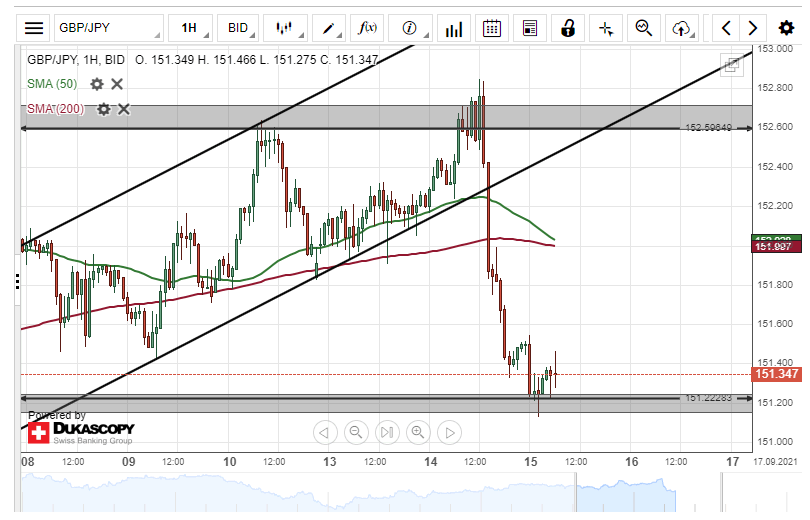
Downside risks dominated the GBP/JPY currency pair on Tuesday. As a result, the British Pound plunged by 138 pips or 0.91% against the Japanese Yen during Tuesday's trading session.
Given that a breakout has occurred, bearish traders could continue to drive the exchange rate lower during the following trading session. The possible target for sellers would be near the 150.80 area.
However, a support level at 151.22 could provide support for the currency exchange rate within this session.
AUD/USD Two Scenarios Likely
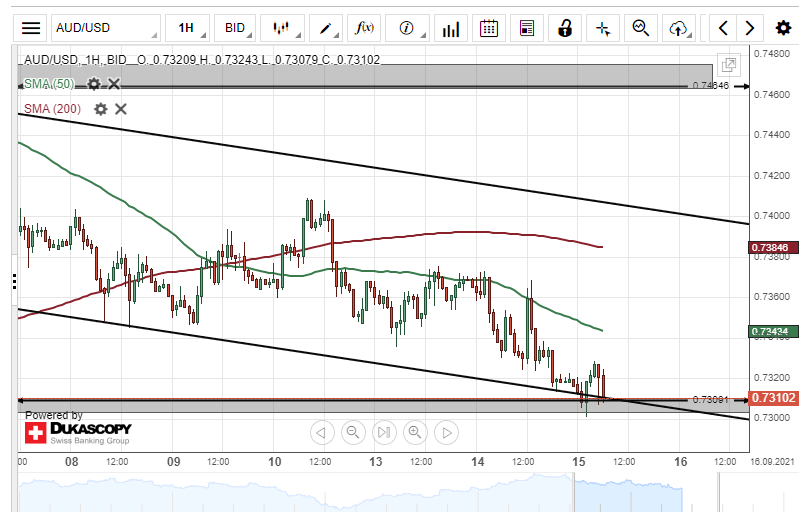
On Tuesday, the Australian Dollar declined by 52 pips or 0.71% against the US Dollar. The 50– hour simple moving average pressured the currency pair lower during Tuesday's trading session.
Technical indicators suggest selling signals on the 4H time-frame chart. Most likely, the AUD/USD exchange rate could continue to edge lower during the following trading session.
However, the lower line of a descending channel pattern could provide support for the currency exchange rate within this session.
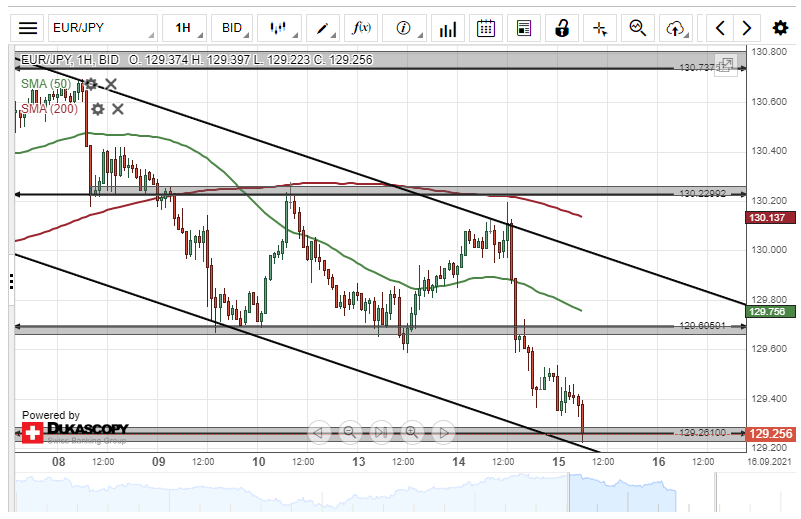
EUR/JPY Decline Likely To Continue
On Tuesday, the common European currency declined by 69 pips or 0.53% against the Japanese Yen. The currency pair breached the 50– hour simple moving average during Tuesday's trading session.
The EUR/JPY exchange rate is currently trading near the lower line of a descending channel pattern and could be set for a breakout.
If the breakout occurs, a decline towards the 129.00 level could be expected within this session.
However, if the channel pattern holds, buyers are likely to target the resistance level at 129.69 today.
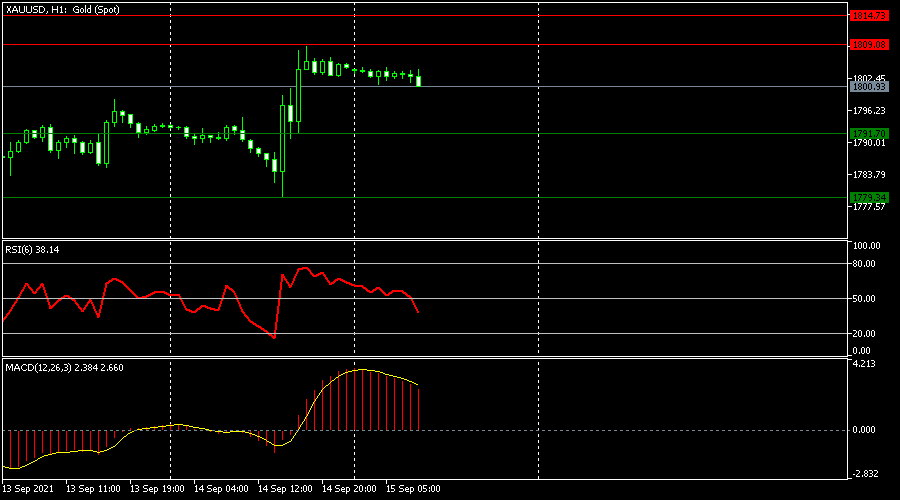
XAUUSD Is Possibly Bearish
Technical analysis
The RSI is below 50
The MACD is above 0, with the indicator line pointing down.
Most likely scenario - SELL
Target prices: 1,791.70 1,779.34
Alternative scenario - BUY
Target prices: 1,809.08 1,814.73
Key levels
Support 1,791.70 1,779.34
Resistance 1,809.08 1,814.73
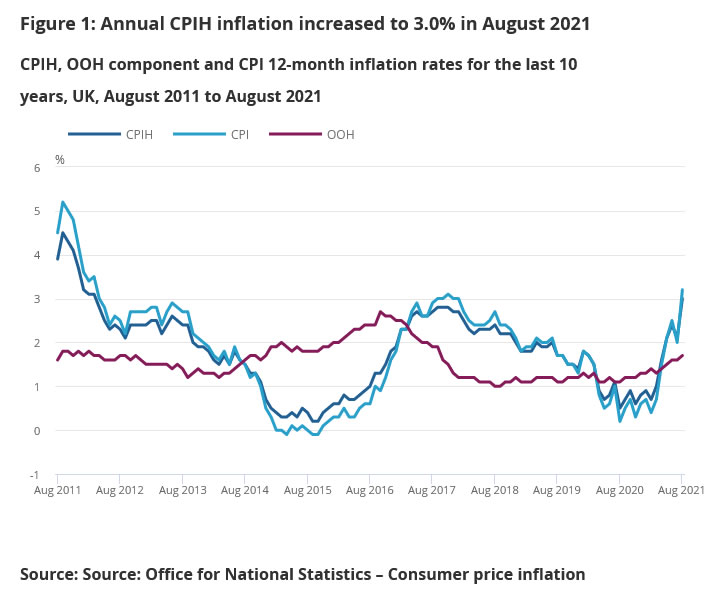
UK CPI surged from 2% to 3.2% yoy in Aug, largest monthly leap on record
UK CPI surged to 3.2% yoy in August, up from 2.0% yoy, above expectation of 2.9% yoy. That sharp 1.2% jump in CPI was the highest leap recorded, but ONS said "this is likely to be a temporary change. CPI core rose to 3.1% yoy, up from 1.8% yoy, above expectation of 2.9% yoy. RPI also rose to 4.8% yoy, up from 3.8% yoy, above expectation of 4.6% yoy.
Also released, PPI input came in at 0.4% mom, 11.0% yoy, versus expectation of 0.2% mom, 10.3% yoy. PPI output was at 0.7% mom, 5.9% yoy, versus expectation of 0.4% mom, 5.4% yoy. PPI core output was at 1.0% mom, 5.4% yoy.
EUR/USD Daily Outlook
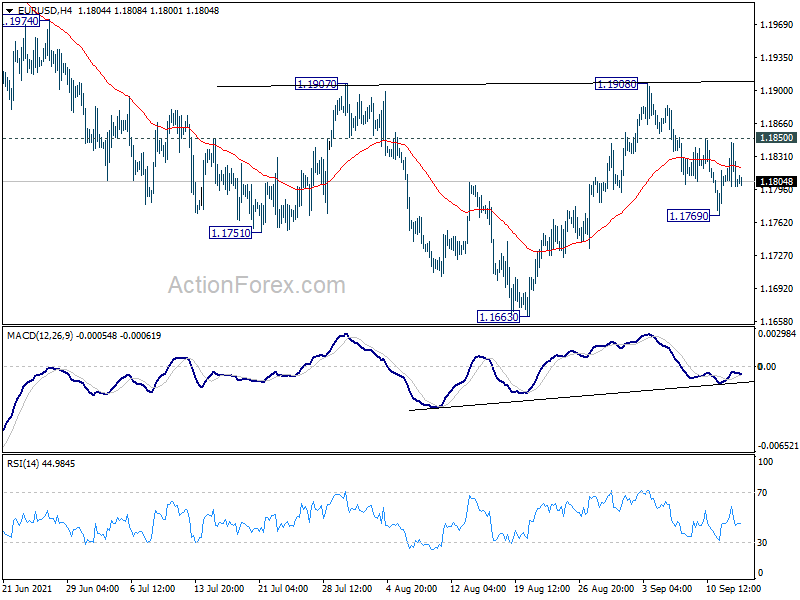
Daily Pivots: (S1) 1.1788; (P) 1.1817; (R1) 1.1834; More...
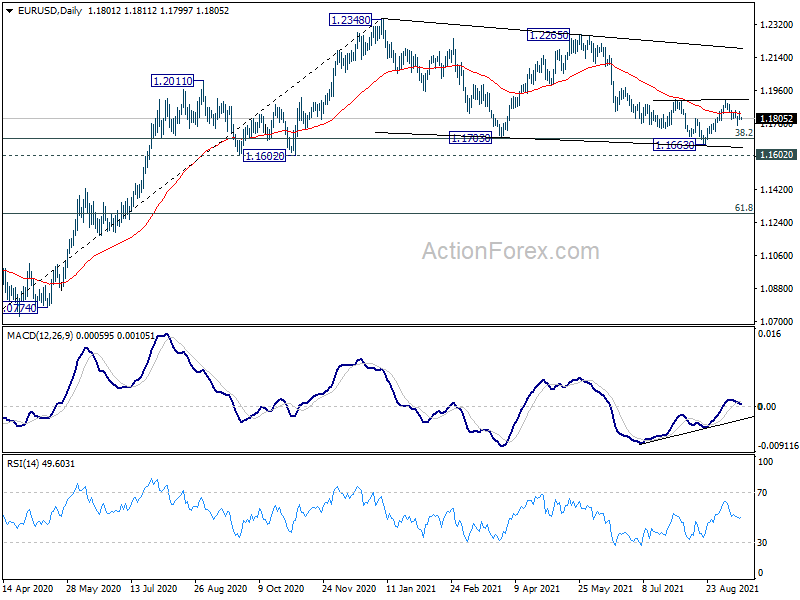
Intraday bias in EUR/USD remains neutral for the moment. On the upside, break of 1.1850 will turn bias back to the upside for 1.1907/1908 key structural resistance zone. Sustained break there will complete a head and shoulder bottom pattern (ls: 1.1751; h: 1.1663; rs: 1.1769). That would also revive the case that consolidation pattern from 1.2348 has completed. Such development will turn near term outlook bullish for retesting 1.2348 high. On the downside, below 1.1769 will resume the fall from 1.1908 to retest 1.1663 low.
In the bigger picture, rise from 1.0635 is seen as the third leg of the pattern from 1.0339 (2017 low). Further rally remains in favors long as 1.1602 support holds, to cluster resistance at 1.2555 next, (38.2% retracement of 1.6039 to 1.0339 at 1.2516). However sustained break of 1.1602 will argue that the rise from 1.0635 is over, and turn medium term outlook bearish again. Deeper fall would be seen to 61.8% retracement of 1.0635 to 1.2348 at 1.1289 and below.
GBP/USD Daily Outlook
Daily Pivots: (S1) 1.3770; (P) 1.3841; (R1) 1.3879; More...
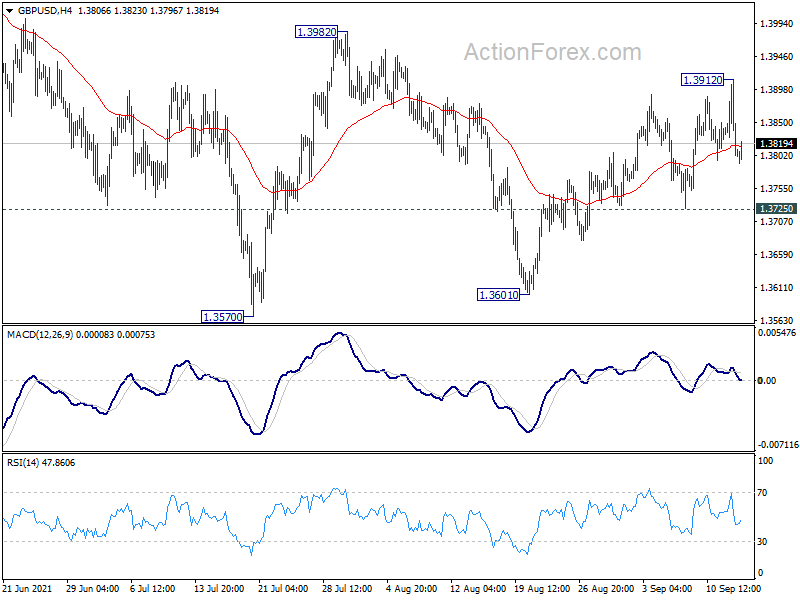
GBP/USD retreated quickly after edging higher to 1.3912. Intraday bias is turned neutral again. On the upside, break of 1.3912 will target 1.3982 resistance next. Decisive break there will indicate that fall from 1.4248 has completed. Stronger rally would then be seen back to 1.4248 high. On the downside, however, break of 1.3725 support will turn bias back to the downside for retesting 1.3570/3601 support zone instead.
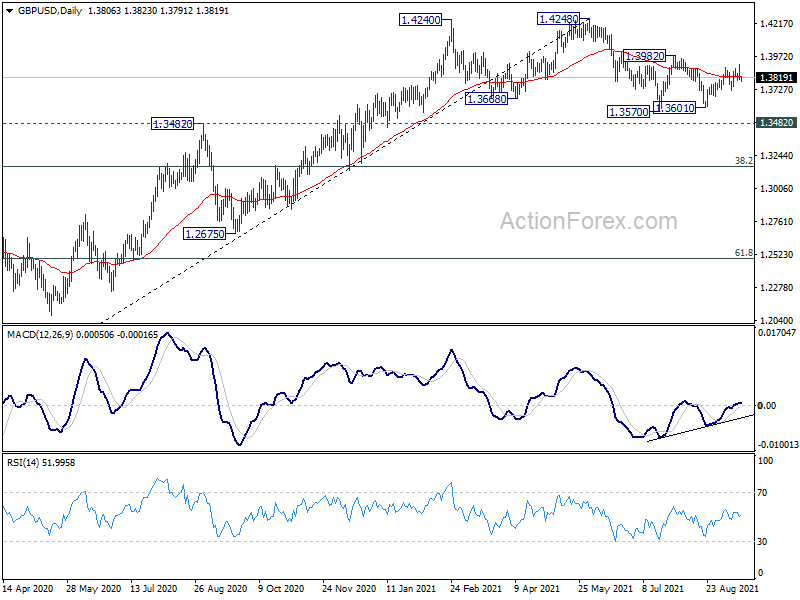
In the bigger picture, as long as 1.3482 resistance turned support holds, we'd still treat price actions from 1.4248 as a corrective move. That is, up trend from 1.1409 (2020 low) is in favor to resume. Decisive break of 1.4376 key resistance (2018 high) would indeed carry long term bullish implications. However, sustained break of 1.3482 will at least bring deeper fall to 38.2% retracement of 1.1409 to 1.4248 at 1.3164, or even further to 61.8% retracement at 1.2493.
Wall Street Sell-Off Gains Steam As Investors Assess US Inflation Data
American equities declined on Tuesday after relatively weak consumer inflation data. The Dow Jones declined by more than 240 points while the S&P 500 and Nasdaq 100 indices fell by more than 0.20%. This decline happened after data by the Bureau of Labor Statistics (BLS) said that consumer prices declined from 5.4% in July to 5.3% in August. Without volatile food and energy prices, prices declined from 4.2% to 4.0%. Still, the price is still substantially higher than the Fed’s target of 2.0%. Also, many analysts expect that equities will underperform in the remainder of the year.
The British pound wavered in the overnight session as traders waited for the UK consumer and producer inflation data. Economists polled by Reuters expect the numbers by the Office of National Statistics (ONS) will show that prices rose from 2.0% in July to about 2.9% in August. The core CPI is also expected to rise to about 2.8%. These numbers will be affected by Rishi Sunak’s “Eat Out to Help Out” program that gave Britons a discount at restaurants last year. The inflation numbers will come a day after the UK published weak employment numbers.
The Canadian dollar declined even after higher crude oil prices. The price of Brent and West Texas Intermediate rose to $74 and $70, respectively after bullish reports by the IEA and OPEC. The two agencies said that they expect that demand will rise at a faster rate than expected. The Canadian dollar will react to the latest inflation numbers that will come out ahead of the American session. The data is expected to show that the CPI jumped to 3.9% in August. Still, the impact of these numbers on the CAD will be limited since the BOC delivered its September meeting last week.
NDX100
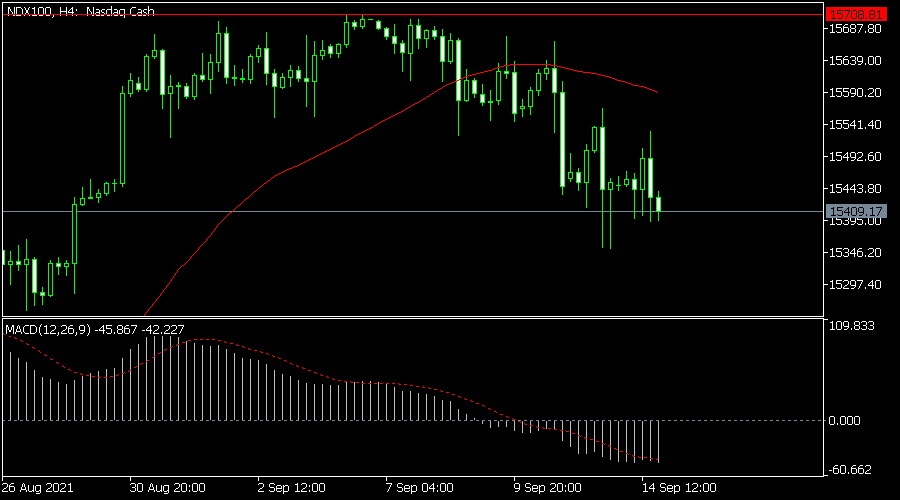
The sell-off of the Nasdaq 100 index continued in the overnight session. The index declined to $15,350, which was the lowest level since August 27th. On the four-hour chart, it remains substantially below its all-time high of $15,708. It has also moved below the 25-day moving averages while the MACD remains below the neutral level. For now, the index will remain in a bearish trend as bears target the key support at $15,000.
EURUSD
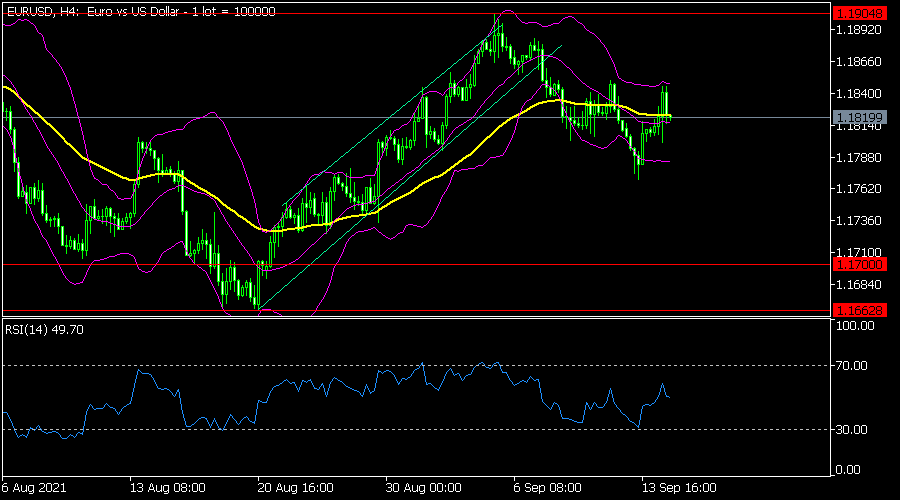
The EURUSD remained in a tight range after the American inflation data. On the four-hour chart, the pair is along with the 25-day and 15-day moving average and the middle line of the Bollinger Bands. The Relative Strength Index (RSI) has also moved from the oversold level of 30 to 50. It has also formed a small head and shoulders pattern. Therefore, there is a likelihood that it will break out higher.
USDCAD
The USDCAD pair rose slightly after the US inflation data. It rose to 1.2670, which was slightly above the key support at 1.2600. It also moved slightly above the 25-day moving average and slightly below the right shoulder of the head and shoulders pattern. The RSI is at the neutral level of 53. Therefore, the pair will likely remain at the current range today.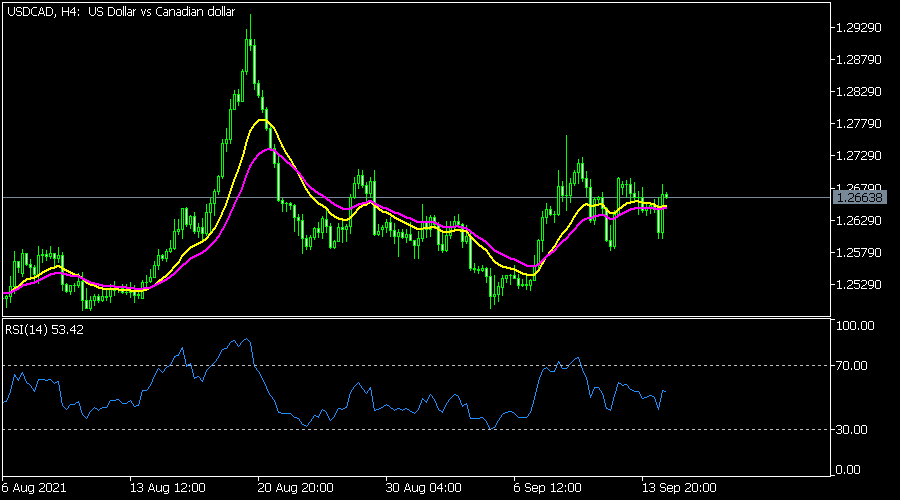
USD/CHF Daily Outlook
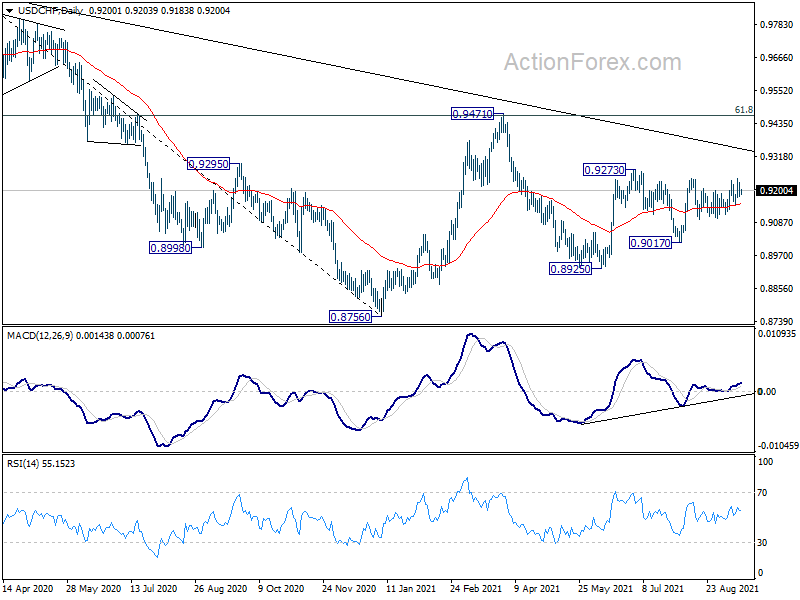
Daily Pivots: (S1) 0.9179; (P) 0.9203; (R1) 0.9226; More....
Intraday bias in USD/CHF remains neutral at this point. On the downside, break of 0.9149 will turn focus to 0.9098 support. Break there will target further decline to 0.9017 support. On the upside, break of 0.9239/41 will target 0.9273 resistance instead.
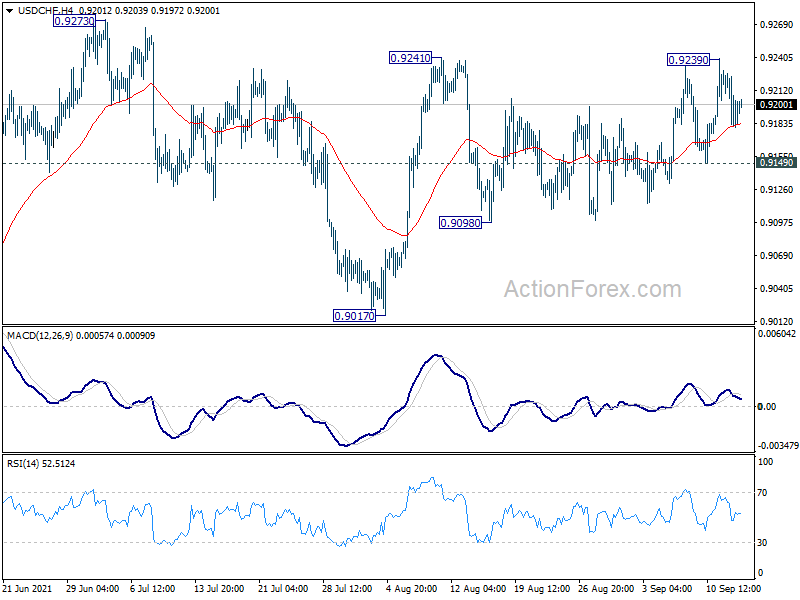
In the bigger picture, USD/CHF is still struggling around 55 week EMA (now at 0.9178) and outlook is mixed for now. Confirmed rejection by the 55 week EMA will retain medium term bearishness. That is, larger fall from 1.0342 would resume through 0.8756 low at a later stage. However, sustained trading above 55 week EMA will tilt favor to the case of bullish reversal. Focus would then be turned to 0.9471 resistance for confirmation.