

Sample Category Title
NZDUSD Edges Across 38.2% Fibonacci Around 0.71
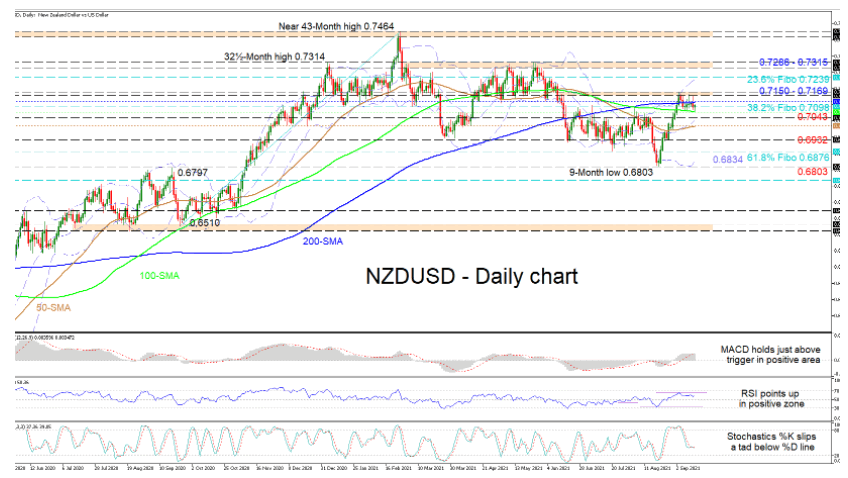
NZDUSD is creeping sideways along the 0.7100 level, which happens to be surrounded by the 100- and 200-day simple moving averages (SMAs) at 0.7070 and 0.7120 respectively, after its latest rally ran out of steam. Judging from the SMAs, they are mostly promoting a neutral price development.
The short-term oscillators appear fairly flat and are signalling weak and mixed signals in directional momentum. The MACD has flattened towards its red trigger line in the positive area, while the RSI is trying to improve in bullish territory. The stochastic oscillator is static with its %K line marginally below its %D line, endorsing no clear price direction in the pair for now.
In a positive scenario, preliminary upside obstructions could come from the 200-day SMA at 0.7120 ahead of the resistance band of 0.7150-0.7169. Piloting higher, the upper Bollinger band coupled with the 0.7239 level, being the 23.6% Fibonacci retracement level of the up leg from 0.6510-0.7464, could delay the test of the 0.7286-0.7315 near-term ceiling, an area involving peaks from early March, April and May.
Alternatively, sellers may struggle to break below the immediate 38.2% Fibo of 0.7098 and the nearby 100-day SMA at 0.7070. However, should this play out, a neighbouring zone of support could develop between 0.7043 until the 50-day SMA at 0.7003, which also encapsulates the mid-Bollinger band. Declining further, the price may meet the 0.6932 low before targeting the 61.8% Fibo of 0.6876. From here, if sellers remain in the driving seat, the lower Bollinger band at 0.6834 may come into focus prior to the key 9-month trough of 0.6803.
Summarizing, NZDUSD’s directional forces seem to have temporarily dried up as the price is stuck between the 100- and 200-day SMAs. Nevertheless, a break above the 0.7150-0.7169 barrier or beneath the 50-day SMA at 0.7003 could produce a new price course.
JP 225 Index Pins New Multi-Year High, Bearish Divergence Detected
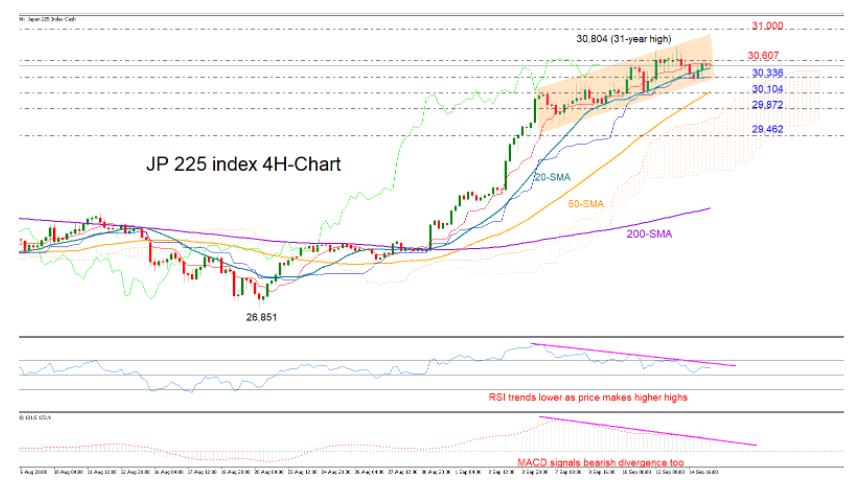
Japan's 225 stock index (cash) surpassed February's high to top at 30,804 on Tuesday – the highest since the 1990 bubble levels – before closing a bit lower.
While the index has corrected the minor pullback below the 20-period simple moving average (SMA) and is currently set to rechallenge the 30,545 – 30,600 barrier, the negative trajectory in the RSI and the MACD continues to conflict the latest higher highs in the market, warning of a bearish divergence phenomenon. In other words, the momentum indicators signal that the market has overextended itself to the upside.
If resistance around the red Tenkan-sen line at 30,545 proves hard to clear, the index could slide to find immediate support around the blue Kijun-sen line at 30,336. A steeper decline could test the 50-period SMA at 30,104, while a drop below the 30,000 threshold could halt around the 29,872 handle, where the upper surface of the Ichimoku cloud happens to be.
On the upside, if the bulls successfully run beyond 30,600, the door would open again for the multi-year high of 30,804. Breaching that ceiling, the 31,000 mark could be of psychological importance, and therefore, could next dare bullish actions.
All in all, the bullish bias in JP 225 seems to be losing steam, with traders waiting for a close below 30,336 before they reduce exposure in the market.
UK CPI Near Decade High
Notes/Observations
- UK CPI near a decade high.
- Chinese IP and Retail Sales data adds to concerns on the global economy.
Asia
- China Aug Retail Sales hit a 1-year low (Y/Y: 2.5% v 7.0%e).
- China Aug Industrial Production registered its slowest growth since July 2020 (Y/Y: 5.3% v 5.8%e).
- China Aug Surveyed Jobless Rate: 5.1% v 5.1%e.
- China National Bureau of Statistics (NBS) Official reiterated stance that major macroeconomic indicators were in reasonable range; foundation for economic recovery needed to be consolidated.
- North Korea fired ballistic missile off its East Coast (Note: Launch comes days after test of 'strategic' cruise missile).
Europe
- ECB’s Schnabel (Germany) reiterated view that did not expect inflation to be persistently too high.
Americas
- Senator Schumer asking the business community to weigh in on Republicans to the dangers of not raising the debt ceiling.
Energy
- Weekly API Crude Oil Inventories: -5.4M v -2.9M prior.
Speakers/Fixed income/FX/Commodities/Erratum
Equities
- Indices [Stoxx600 -0.13% at 467.02, FTSE +0.04% at 7,036.95 , DAX -0.02% at 15,719.35, CAC-40 -0.21% at 6,639.22, IBEX-35 -0.48% at 8,737.50, FTSE MIB -0.15% at 25,987.00, SMI -0.43% at 12,044.90, S&P 500 Futures +0.27%].
- Market Focal Points/Key Themes: European indices open modestly lower and generally remained under pressure as the session wore on; sectors leading to the upside include technology and materials; laggard sectors include consumer discretionary and utilities; oil and gas subsector supported by higher crude prices; Swedish match to spin off cigar business; no major earnings expected during the upcoming US session.
Equities
- Consumer discretionary: H&M [HMB.SE] -3% (sales), Inditex [ITX.ES] -1.5% (earnings).
- Energy: Tullow Oil [TLW.UK] +6% (earnings; CFO steps down).
- Technology: Darktrace [DARK.UK] +9% (earnings; raises outlook).
Speakers
- ECB’s de Cos (Spain) reiterated Council stance that current inflation increase in EU was largely temporary. Not seeing any 2nd round effects at this time. To closely monitor inflation performance.
- EU Commission President Von Der Leyen stated that 19 countries to be back at pre-pandemic levels in 2021; relaunch talk on economic governance review. To address structural issues in economy and present new European chips act. She believed that the region should focus on semiconductor and be a world leader.
- Germany CDU leader Laschet pledged no new taxes and tight budget policy.
- Italy Govt official stated that indicators showed that Q3 GDP growth remains strong.
- German IFO Institute stated that it saw 2021 German CPI at 3.0% and easing to 2.0-2.5% in 2022.
- China Foreign Min Wang Yi stated that he met with South Korea President Moon in Seoul; Would keep high-level exchanges with country.
Currencies/Fixed Income
- USD managed to shrug off some softer CPI data on Tuesday as some safe-haven flows over China concerns provided some support. The US inflation data. Overall the greenback holding within its recent ranges.
- EUR/USD holding above the 1.18 level as pair being supported by solid economic fundamentals in EU but hampered by divergence between Fed policy and that of the ECB.
- Hotter UK CPI data help to push the GBP firmer in the session. Dealers said to be wagering that the BOE would raise its key rate 0.10% to 0.50% during 2022. Overall given the recent central bank speak on uptick being transitory BOE likely won't react to these figures anytime soon. GBP/USD at 1.3830 by mid-session. Some vague rumors resurfacing that PM Johnson could reshuffle his Cabinet soon.
Economic data
- (FI) Finland July GDP Indicator WDA Y/Y: 5.5% v 9.1% prior.
- (NG) Nigeria Aug CPI Y/Y: 17.0% v 17.0%e.
- (UK) Aug CPI M/M: 0.7% v 0.5%e; Y/Y: 3.2% v 2.9%e; CPI Core Y/Y: 3.1% v 2.9%e; CPIH Y/Y: 3.0% v 2.7%e.
- (UK) Aug RPI M/M: 0.6% v 0.5%e; Y/Y: 4.8% v 4.7%e; RPI-X (ex-mortgage Interest Payments Y/Y: 4.9% v 4.7%e; Retail Price Index: 307.4 v 307.1e.
- (UK) Aug PPI Input M/M: 0.4% v 0.2%e; Y/Y: 11.0% v 10.3%e.
- (UK) Aug PPI Output M/M: 0.7% v 0.4%e; Y/Y: 5.9% v 5.4%e.
- (NO) Norway Aug Trade Balance (NOK): 42.6B v 42.2B prior.
- (FR) France Aug Final CPI M/M: 0.6% v 0.6%e; Y/Y: 1.9% v 1.9%e; CPI Ex-Tobacco Index: 106.2 v 106.2e.
- (FR) France Aug Final CPI EU Harmonized M/M: 0.7% v 0.7%e; Y/Y: 2.4% v 2.4%e.
- (IT) Italy Aug Final CPI M/M: 0.4% v 0.5% prelim; Y/Y: 2.0% v 2.1% prelim; CPI FOI Index (ex-tobacco): 104.7 v 104.2 prior.
- (IT) Italy Aug Final CPI EU Harmonized M/M: 0.2% v 0.3% prelim; Y/Y: 2.5% v 2.6%e.
- (PL) Poland Aug Final CPI M/M: 0.3% v 0.2% prelim; Y/Y: 5.5% v 5.4% prelim (5th month above target and highest since 2001).
- (TR) Turkey Aug Central Gov't Budget Balance (HUF): +40.8B v -45.8B prior- (UK) July ONS House Price Index Y/Y: 8.0% v 12.5%e.
- (IT) Italy July General Government Debt: €2.726T v €2.696T prior (record high).
- (EU) Euro Zone July Industrial Production M/M: 1.5% v 0.6%e; Y/Y: 7.7% v 6.0%e.
- (EU) Euro Zone Labour Costs Y/Y: -0.1% v +1.3% prior.
- (GR) Greece July Unemployment Rate: 14.2% v 15.0% prior.
Fixed income Issuance
- (IN) India sold total INR170B vs. INR170B indicated in 3-month, 6-month and 12-month bills.
- (HU) Hungary Debt Agency (AKK) opened its book to sell EUR-denominated 7-year notes via syndicate; guidance seen +75bps to mid-swaps.
- (DK) Denmark sold total DKK5.7B in 2024 and 2031 DGB bonds.
- (UK) DMO sold £2.5B in 0.25% July 2031 Gilts; Avg Yield: 0.740% v 0.664% prior; bid-to-cover: 2.52x v 2.72x prior; Tail: 0.2bps v 0.1bps prior.
- (SE) Sweden sold SEK5.0B vs. SEK5.0B indicated in 6-month Bills; Avg Yield: -0.2566% v -0.1911% prior; bid-to-cover: 2.99x v 1.95x prior.
Looking Ahead
- 05:25 (EU) Daily ECB Liquidity Stats.
- 05:30 (PT) Portugal Debt Agency (IGCP) to sell 6-month and 12-month bills.
- 05:30 (HU) Hungary Debt Agency (AKK) auction.
- 05:30 (ZA) South Africa announces details of next bond auction (held on Tuesdays).
- 06:00 (IE) Ireland July Property Prices M/M: No est v 1.4% prior; Y/Y: No est v 6.9% prior.
- 06:30 (EU) EU to sell 3-month and 6-month bills.
- 06:45 (US) Daily Libor Fixing.
- 07:00 (RU) Russia OFZ Bond auction (if any).
- 07:00 (US) MBA Mortgage Applications w/e Sept 10th: No est v -1.9% prior.
- 07:00 (ZA) South Africa July Retail Sales M/M: -2.7%e v +0.6% prior; Y/Y: 3.3%e v 10.4% prior.
- 07:00 (UK) Weekly PM Question time in House.
- 08:00 (BR) Brazil July Economic Activity Index (Monthly GDP) M/M: 0.4%e v 1.1% prior; Y/Y: 5.0%e v 9.1% prior.
- 08:00 (UK) Daily Baltic Dry Bulk Index.
- 08:30 (US) Sept Empire Manufacturing: 18.0e v 18.3 prior.
- 08:30 (US) Aug Import Price Index M/M: 0.2%e v 0.3% prior; Y/Y: 9.4%e v 10.2% prior; Import Price Index (ex-petroleum) M/M: 0.2%e v 0.1% prior.
- 08:30 (US) Aug Export Price Index M/M: 0.4%e v 1.3% prior; Y/Y: No est v 17.2% prior.
- 08:30 (CA) Canada Aug CPI M/M: 0.1%e v 0.6% prior; Y/Y: 3.9%e v 3.7% prior; Consumer Price Index: 142.3e v 142.3 prior.
- 08:30 (DE)ECB's Schabel (Germany).
- 09:00 (CA) Canada Aug Existing Home Sales M/M: No est v -3.5% prior.
- 09:15 (US) Aug Industrial Production M/M: 0.5%e v 0.9% prior; Capacity Utilization: 76.4%e v 76.1% prior; Manufacturing Production: 0.4%e v 1.4% prior.
- 09:45 (UK) BOE to buy £1.147B in APF Gilt purchase operation (7-20 years).
- 10:30 (US) Weekly DOE Oil Inventories.
- 11:00 (CO) Colombia July Manufacturing Production Y/Y: 15.8%e v 20.8% prior.
- 11:00 (PE) Peru Aug Lima Unemployment Rate: No est v 9.4% prior.
- 11:00 (CO) Colombia July Retail Sales Y/Y: 22.8%e v 24.7% prior.
- 11:00 (IE) ECB’s Lane (Ireland, chief economist).
- 12:00 (CA) Canada to sell 2-year notes.
- 15:00 (CO) Colombia July Industrial Production Y/Y: No est v 13.8% prior.
- 15:00 (AR) Argentina July Capacity Utilization: No est v 64.9% prior.
- 18:45 (NZ) New Zealand Q2 GDP Q/Q: 1.1%e v 1.6% prior; Y/Y: 16.1%e v 2.4% prior.
- 19:50 (JP) Japan Aug Trade Balance: ¥6.5Be v ¥439.4B prior (revised from ¥441.0B); Adjusted Trade Balance: ¥96.5Be v ¥52.7B prior; Exports Y/Y: 34.1%e v 37.0% prior; Imports Y/Y: 40.0%e v 28.5% prior.
- 21:00 (AU) Australia Sept Consumer Inflation Expectation Survey: No est v 3.3% prior.
- 21:30 (AU) Australia Aug Employment Change: -80.0Ke v +2.2K prior; Unemployment Rate: 5.0%e v 4.6% prior.
- 21:30 (AU) Reserve Bank of Australia (RBA) Quarterly Bulletin.
- 23:00 (NZ) New Zealand Aug Non Resident Bond Holdings: No est v 53.0% prior.
- 23:30 (JP) Japan to sell 12-Month Bills.
- 23:35 (JP) Japan to sell 20-Year JGB Bonds.
EUR/USD Analysis: Channel Is Broken
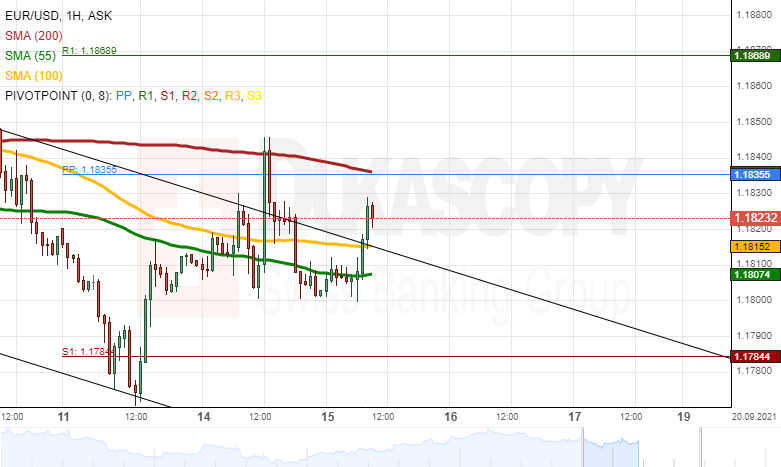
The release of the US Consumer Price Index on Tuesday at 12:30 GMT, caused a drop of the value of the USD. The EUR/USD rate surged and broke the upper trend line of the channel down pattern. By the middle of Wednesday's European trading hours, the pair had started to fluctuate near the 1.1830 mark.
If in the near term future, the EUR/USD pair surges, it would test the resistance of the 200-hour SMA and the weekly simple pivot point at 1.1836. Above these levels, the weekly R1 simple pivot point at 1.1869 could serve as a technical resistance.
On the other hand, the rate could decline. A potential decline most likely would look for support in the 55 and 100-hour simple moving averages at 1.1807 and 1.1815. Below these levels, the 1.1800 mark could provide support. It was spotted that this level provided support on Tuesday evening and Wednesday morning.
GBP/USD Analysis: Finds Support In 1.3800
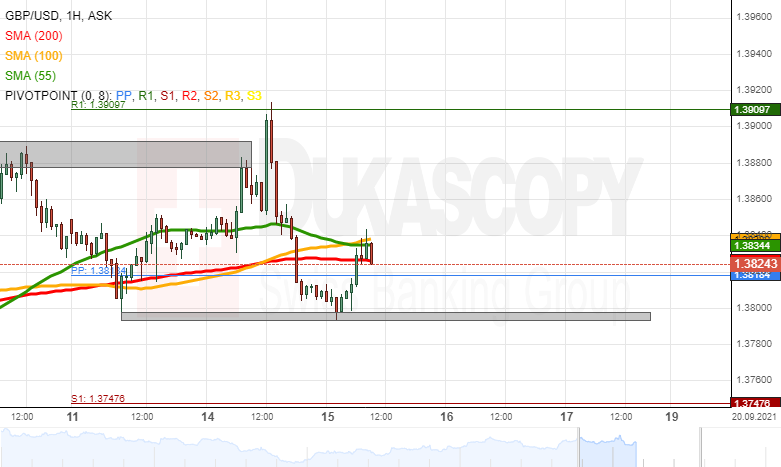
The GBP/USD currency exchange rate found support in the 1.3800 level just after GMT midnight to Wednesday. At mid-day the pair was testing and piercing the resistance of the 55, 100 and 200-hour simple moving averages in the 1.3825/1.3840 zone.
If the pair manages to pass the resistance of the SMAs, it could once again test the weekly R1 simple pivot point at 1.3910 level. However, on its way up the GBP/USD might be slowed down by the 1.3900 mark.
On the other hand, if the SMAs hold and cause a decline, the rate would most likely look for support in the 1.3800 level. In the case of the 1.3800 mark being passed, the weekly S1 simple pivot point at 1.3748 could be reached.
USD/JPY Analysis: Drops By 80 Base Points
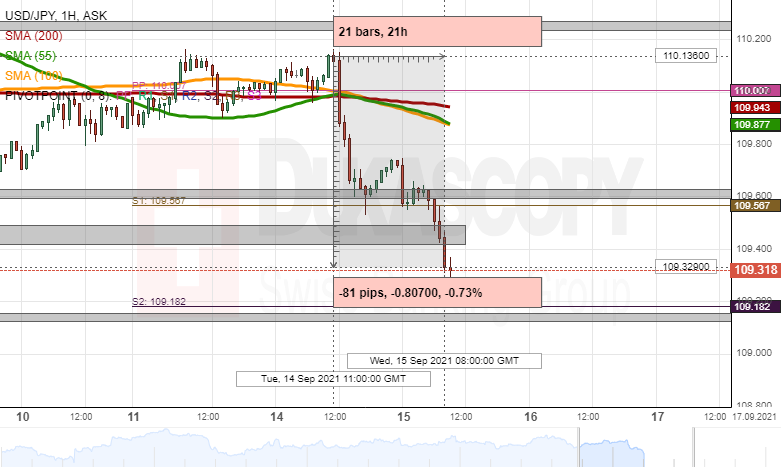
The release of the US Consumer Price Index on Tuesday at 12:30 GMT caused a drop of the US Dollar. On the USD/JPY currency exchange rate charts the initial drop was followed up by a short recovery before the decline resumed. By the middle of Wednesday's European trading hours, the rate had reached the 109.30 level and lost 80 base points.
If the pair continues to decline, technical support could be found in the weekly S2 simple pivot point at 109.18. Below the pivot point, the 109.00 mark might stop or even reverse a decline. Meanwhile, the August 16 and 17 low levels near 109.15 are capable of providing support.
However, a recovery of the rate could find resistance in the weekly S1 simple pivot point at 109.57 and the 109.60 exchange rate level.
Gold Analysis: Breaks Out Of Sideways Range
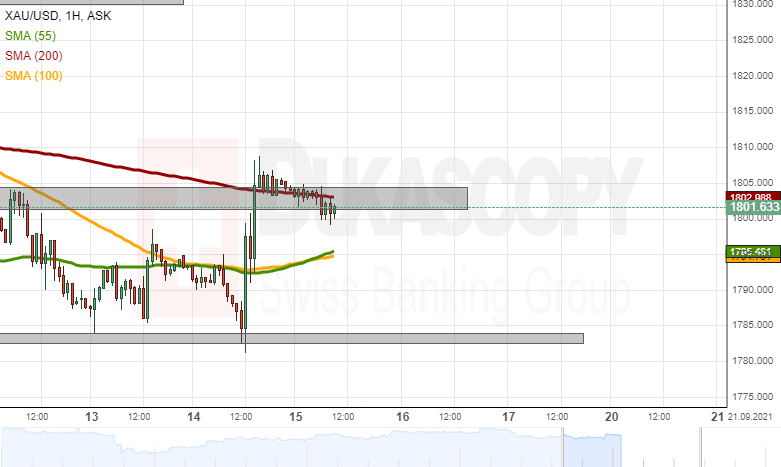
As the price for gold was testing the support zone below the 1,785.00 level, the US Consumer Price Index was released. The worse than forecast US data caused a drop of the value of the USD. Subsequently, the price of gold jumped.
During the three hour surge, the bullion broke above the resistance of the 200-hour SMA and the 1,800.00/1,805.00 resistance zone. The event signals that the price for gold might end sideways trading. However, by the middle of Wednesday's trading, the price had reached below the 200-hour SMA and the 1,800.00 level.
If the yellow metal declines, support could be provided by the 55 and 100-hour SMAs near 1,795.50. However, these levels failed to impact the price throughout this week. Due to that reason, it is a high possibility that the support zone below 1,785.00 could once again be reached.
On the other hand, a surge of gold would test the 200-hour SMA and the 1,800.00/1,805.00 zone before reaching new high levels like the summer high zone at 1,830.00/1,835.00.
UK’s Better-Than-Expected CPI Lifts Sterling
- UK inflation print highest in nine years.
- Lackluster Chinese data adds to market concerns.
- US inflation outlook little changed despite moderating August data.
The UK's August CPI rose 3.2% year-on-year to print at its highest level since March 2012. The better-than-expected numbers offered a gentle lift to the pound which is gaining against most of its G10 peers at the time of writing.
The latest UK inflation figures underscore the buildup in inflationary pressures that are evident across developed economies, while ramping up expectations that central banks may have to ease their foot off the stimulus pedal sooner rather than later. With markets now pricing in an 82% chance of a BOE rate hike in May 2022, that should help create a supportive environment for sterling. The Old Lady is further down the line compared to other major central banks in its quest to normalise policy settings and all eyes now turn to the MPC meeting next week.
China's cooling recovery could dampen sentiment
Asian stocks are a mixed bag on Wednesday, with disappointing economic data out of China souring risk sentiment in the region. China's moderating recovery is adding to the angst surrounding regional assets, while exposing yet again the risks that the Delta variant poses to the global economy. Considering the world's exposure to the Chinese economy, the slowing momentum in growth might add another headwind to risk appetite.
Still, US equity futures are edging higher, as stock bulls dust themselves off after the S&P 500 fell in six out of the past seven sessions. Meanwhile, the dollar index has erased all its losses incurred during the knee-jerk response to the lower-than-expected August US inflation readings. However, gold prices have managed to hang on to most of their gains since, still clinging to the $1800 handle for the time being.
Dollar outlook supported by expectations for Fed tapering
The latest US CPI data doesn't significantly alter the inflation outlook, though it is showing signs that inflationary pressures are waning, potentially affirming Fed Chair Jerome Powell's ‘transitory' views after all. Yet market participants are holding on to expectations that the Fed's tapering will commence before 2021 is over, while the Fed funds futures still point to a greater-than 70% chance of a US rate hike in December 2022. Such a hawkish narrative should buffer the greenback's resilience, which was brought to the fore once more following the latest US inflation release.
The US Dollar Holds Firm
US dollar recovers losses from soft CPI
Although the US dollar dipped on the US inflation miss, the greenback quickly recovered its losses with the dollar index closing almost unchanged at 91.63, where it remains in Asia. The US dollar’s strength even as bond yields eased is strongly suggesting that risk-aversion flows are in play as sentiment globally sours. That should also benefit the Swiss franc and Japanese yen over the rest of the week.
Elsewhere, EUR/USD’s rally quickly petered out leaving it unchanged at 1.1800 in Asia. The 1.1750 and 1.1850 levels remain the ones to watch for the euro’s next directional move. GBP/USD has risen just 10 pips to 1.3815 on the just-released UK inflation, core inflation and PPI data. The MoM and YoY metrics have all come in much higher with inflation alive and well in Her Majesty’s kingdom. The statistics office, like the BoE, has urged caution about the numbers, saying inflation is temporary. Looking at natural gas prices, I am not so sure. The definition of temporary is increasing differently to different people.
GBP/USD failed ahead of its 100-day moving average (DMA) at 1.3915 overnight, before plummeting to 1.3805 close overnight. Sterling is looking more vulnerable than the euro at the moment, and support at 1.3790 really needs to hold to avoid a retest of 1.3700. Given the reaction to the UK inflation data, that may be false hope for bullish sterling traders.
Perhaps the biggest signal that risk sentiment remains fragile this week is the performance of both the Australian and New Zealand dollars overnight. Both Antipodeans finished lower overnight and did not rally temporarily in the posy-US-inflation dollar sell-off. AUD/USD and NZD/USD have retreated once again in Asia, falling 0.10% to 0.7320 and 0.7095 with the Kiwi looking especially vulnerable if 0.7075 breaks. Until positive momentum returns to AUD and NZD, it will be hard to call a top in the greenback’s rally overall.
Asian currencies have barely reacted to the China data today, being mostly unchanged, having retreated only slightly on US dollar strength overnight. The best I can surmise is that AsiaFX is determined to remain in a holding pattern until next week’s FOMC meeting. The low inflation print from the US overnight should have been bullish for Asian currencies, pushing back as it did, the timeline for the Fed taper. Instead, Asian currencies faded slightly implying that lower AsiaFX is the path of least resistance in the days ahead.
Oil Remains Steady, Gold Under Pressure
Oil remains near its recent highs
Oil prices remained firm overnight, despite the lower than forecast US CPI data. Both Brent crude and WTI recorded small increases leaving them at the top of their September ranges. The energy component of the US CPI basket rose overnight, despite other components dragging the overall number down, with no real sign in physical markets of lower demand leading to softer prices. Additionally, Tropical Storm Nicholas has disrupted oil production and refining recovery in the Gulf of Mexico, coming after the devastation of Hurricane Ida. In the bigger picture, natural gas prices are rocketing in the northern hemisphere ahead of winter, especially in Europe and Asia. I believe that will provide some indirect support to oil prices going forward, given the ominous look to the natural gas rally. It could well be a winter of discontent.
Brent crude rose by 0.40% to USD 73.90 overnight, adding 0.30% to USD 74.15 a barrel in Asia. Having cleared resistance at USD 74.00 a barrel, and with Europe arriving, Brent crude is poised to rally to USD 75.00 and possibly USD 76.00 a barrel in the days ahead. Only a fall through USD 72.75 a barrel invalidates the bullish outlook.
WTI rose by 0.20% to USD 70.75 overnight, before climbing by 0.30% in Asia to USD 71.00 a barrel. WTI should now target USD 72.00 and potentially USD 74.00 a barrel in the days ahead. Only a failure of USD 70.00 a barrel will invalidate the bullish outlook.
Gold, the reverse-inflation hedge
It is ironic that as US inflation underperformed overnight, that gold traced out a 0.60% gain to USD 1804.50 an ounce. Apart from partially confirming that gold only really hedges Latin American style-inflation, much of gold’s rally was due to the intraday spike lower by the US dollar. That said, it held onto all those gains even as the US dollar clawed back all of its losses, hinting that some new buyers had been entered the market.
Gold has faded in the Asia session though, falling to USD 1801.00 as Europe starts its day. With the US Dollar expected to remain firm as risk-sentiment sours, gold may have had its one day in the sun, much like Chinese equities these days. The underwhelming performance of gold of late has not changed.
Gold rose to initial resistance at its 200-DMA at $1809.00 overnight but retreated from there. The 200-DMA resistance remains intact therefore and is followed closely by the 100-DMA at USD 1816.50 an ounce and the formidable series of multi-day tops around USD 1834.00 an ounce. Support remains clearly marked at USD 1780.00 and failure will signal deeper losses to USD 1750.00 an ounce.