Sample Category Title
GBPJPY Spikes Above 38.2% Fibo After Rebound Off 151.10
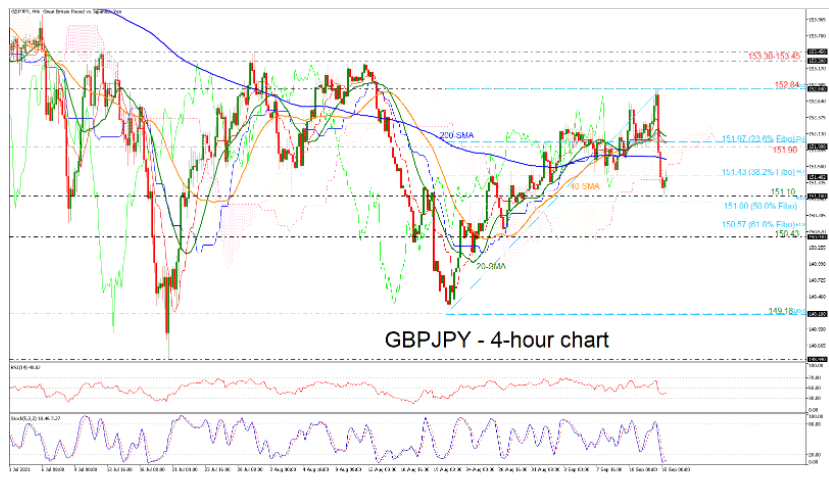
GBPJPY has bounced off the 151.10 support level, posting couple of sessions of gains after the significant selling interest from the 152.84 resistance.
The price is extending its move with a spike above the 38.2% Fibonacci of the up leg from 149.18 to 152.84 at 151.43 and the technical indicators are confirming the recent upside movement. The RSI is pointing upwards in the negative territory, while the %K and %D lines of the stochastic oscillator posted a bullish crossover in the oversold zone, suggesting the end of the bearish price action.
A continuation of the positive move could find immediate resistance at the 200-period simple moving averages (SMAs) at 151.70 ahead of the 151.90-151.97 zone, which encapsulates the 23.6% Fibonacci and the 40-period SMA. Stretching further, the bulls may next haunt the 152.84 high ahead of steeper increases towards 153.30-153.45.
In the event of a drop back below 151.43 may take the market until the 151.10 barrier and the 151.00 psychological mark which is the 50.0% Fibonacci. Failure to bounce on the latter, could bring the 61.8% Fibonacci of 150.57 into view.
In the bigger picture, the market continues to print higher highs and higher lows, holding the positive outlook intact despite the latest sharp dive.
Oil Prices Edge Higher On Supply Issues
WTI's prices have been on the rise for a third consecutive day yesterday and oil traders seem to be still bullish after a drawdown of 5.4 million barrels being reported by the American Petroleum Institute for last week, yesterday. It should be noted that a new hurricane (hurricane Nicholas) is lashing out on the shores of Texas and Louisiana and could prolong a shut-down of oil production in the area, thus tightening supply issues for the commodity's market, despite refineries working. On the flip side, OPEC's monthly report on Monday, showed that the oil producing block trimmed its expectations regarding oil demand for Q4, from 110k bpd to 99.7k bpd, which could weigh on oil prices, yet hurricane news seem to dominate the scene for now. As for releases we would highlight for oil traders the release of the weekly US EIA crude oil inventories figure today, which is expected to show a widened drawdown if compared to last week's figure and if so, could provide some support for oil prices as demand surpassed oil production levels once again.WTI prices edged higher yet remained between the 69.35 (S1) and the 71.10 (R1) levels. Given that the progress made for WTI bidders seems to be slow and the commodity's price seems to stabilize, we maintain a bias for a sideways motion, yet the RSI indicator below our 4-hour chart is above the reading of 50, implying that the Bulls may still have a slight advantage. Should the commodity's price actually be driven by buyers, we may see it breaking the 71.10 (R1) resistance line and thus opening the way for the 74.65 (R2) resistance level. Should a selling interest be displayed by the market we may see WTI prices, dropping, breaking the 69.35 (S1) support line and aim for the 67.00 (S2) support level.
AUD continues to weaken against the USD
The Aussie retreated against the USD yesterday as prices of iron Ore continued their slide lower weighing on the AUD, given that Iron Ore is one of the major export products of the Australian economy especially to China. China's industrial output growth rate for August slowed even more than what the market was expecting and foreshadows difficult days ahead for Australian exporters of the industrial metal. It should be noted that RBA in its latest meeting had mentioned that it expects the economic circumstances to be worse before improving and cited that employment data could weaken in the next months due to the strict lockdown measures employed in various areas of Australia. Aussie traders are expected to keep a close eye on the release of Australia's employment data for August due out during tomorrow's Asian session.
AUD/USD dropped yesterday breaking the 0.7335 (R1) support line, now turned to resistance. We tend to maintain a bearish outlook for the pair, as long as it remains below the downward trendline incepted since the 7th of September. Also please note that the RSI indicator below our 4-hour chart remains near the reading of 30, underscoring the presence of the bears for the pair. Should the bears maintain control over the pair's direction, we may see it breaking the 0.7280 (S1) support line and take aim for the 0.7225 (S2) support level. Should the bulls take over, we may see AUD/USD reversing course, breaking the 0.7335 (R1) resistance line, the prementioned downward trendline and aim for the 0.7420 (R2) resistance level.
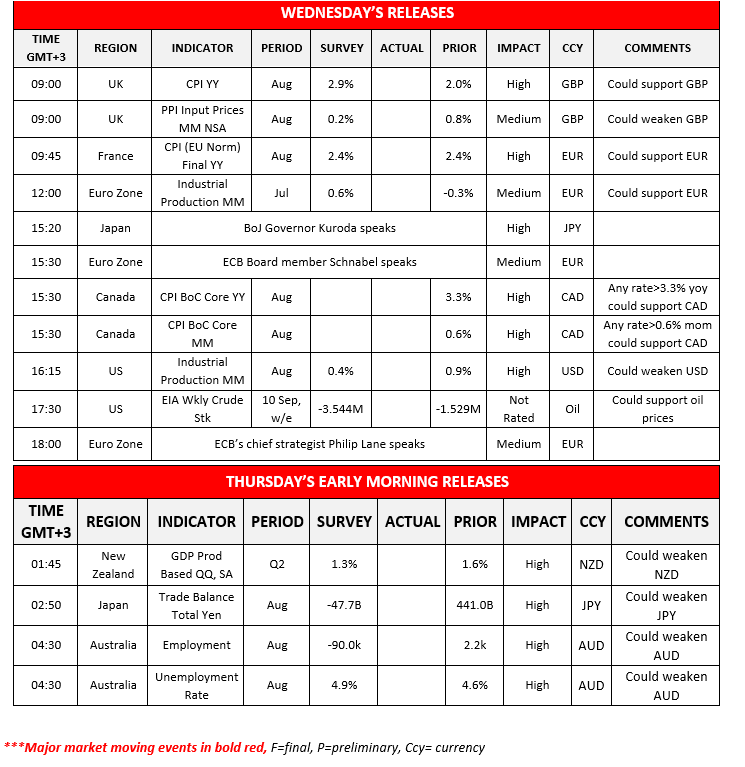
Other economic highlights today and the following Asian session:
During today's European session, we note the release of UK's inflation measures for August and Eurozone's industrial production for July. In the American session we highlight Canada's CPI rates for August, as well as the US industrial production growth rate for August and the weekly EIA crude oil inventories figure. On the monetary front BoJ Governor Kuroda, ECB Board member Schnabel and ECB's chief strategist Philip Lane are scheduled to speak. During tomorrow's Asian session we get New Zealand's GDP rate for Q2, Japan's trade data for August and Australia's employment data for the same month.
WTI H4 Chart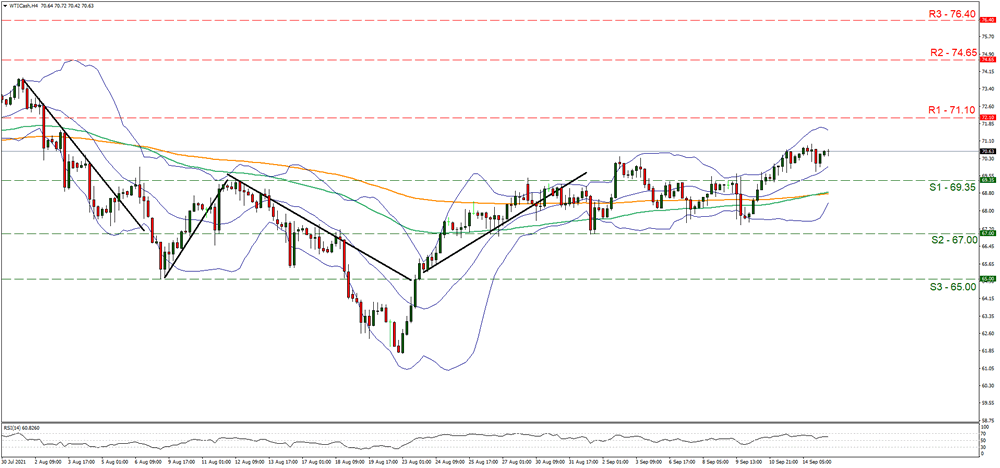
Support: 69.35 (S1), 67.00 (S2), 65.00 (S3)
Resistance: 71.10 (R1), 74.65 (R2), 76.40 (R3)
AUD/USD H4 Chart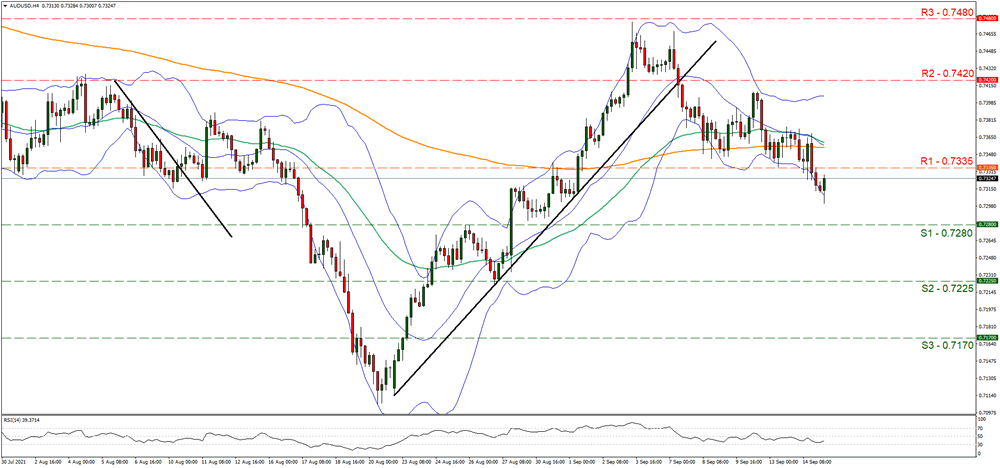
Support: 0.7280 (S1), 0.7225 (S2), 0.7170 (S3)
Resistance: 0.7335 (R1), 0.7420 (R2), 0.7480 (R3)
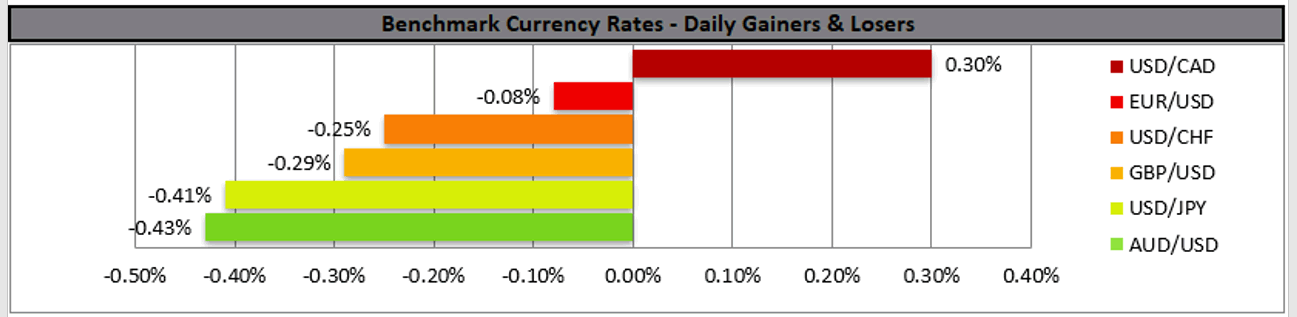
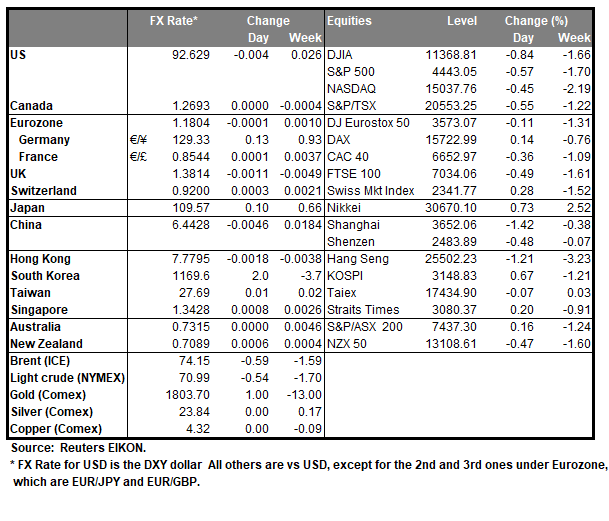
The Analytical Overview Of The Main Currency Pairs
The EUR/USD currency pair
Technical indicators of the currency pair:
Prev Open: 1.1810
Prev Close: 1.1804
% chg. over the last day: -0.05%
The slowdown in consumer price growth in the US has slightly eased investors' fears that the Federal Reserve may cut its stimulus program too soon. The dollar index has slightly strengthened during the release of this news, and now investors are waiting for the Eurozone inflation data to be released on Thursday.
Trading recommendations
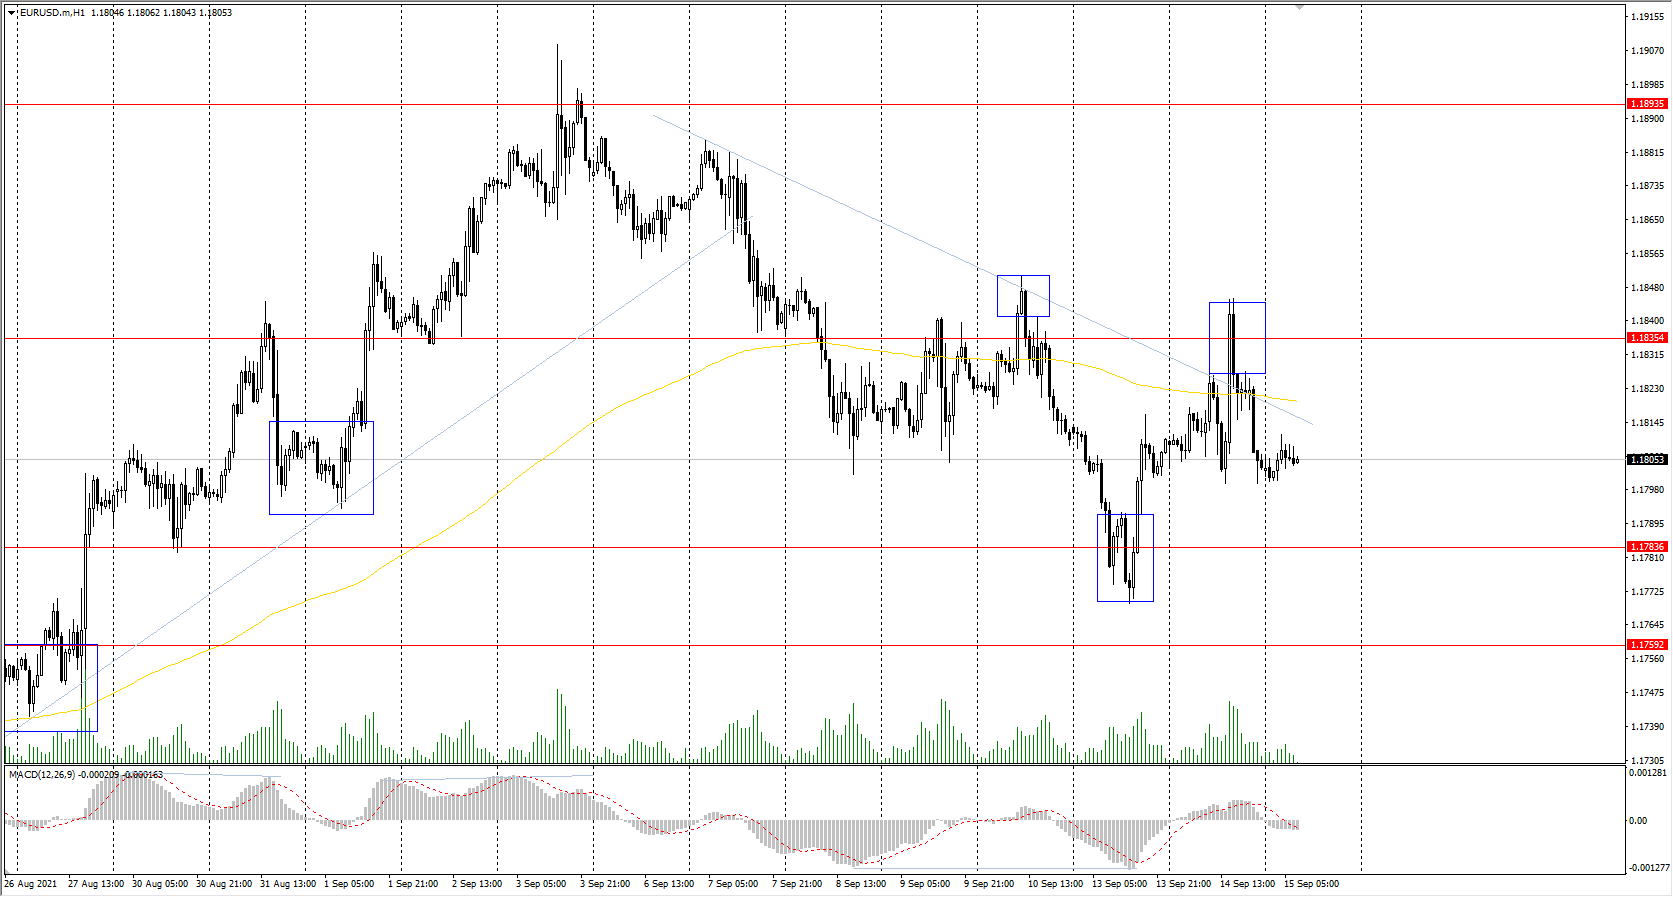
Support levels: 1.1783, 1.1759, 1.1704, 1.1620
Resistance levels: 1.1835, 1.1894, 1.1934, 1.1969
From the technical point of view, the general trend on the EUR/USD currency pair is bullish. The MACD indicator is in the negative zone, but there are no signs of buyers’ and sellers’ strength. Under such market conditions, buy trades can be considered from the support levels where buyers show initiative. It is better to look for sell trades from the resistance levels above the moving average and only with short targets.
Alternative scenario: if the price breaks through the 1.1704 support level and fixes below, the mid-term uptrend will likely be broken.
News feed for 2021.09.15:
- Eurozone Industrial Production (m/m) at 12:00 (GMT+3);
- US Industrial Production (m/m) at 16:15 (GMT+3).
The GBP/USD currency pair
Technical indicators of the currency pair:
Prev Open: 1.3834
Prev Close: 1.3808
% chg. over the last day: -0.19%
In the UK, labor market data showed that the total employment exceeded the pre-pandemic level, and the unemployment rate fell to 4.6% (previous – 4.7%). Inflation data will be released today. The Bank of England expects inflation to rise sharply this year and reach a peak of 4%. Strong inflation will strengthen expectations that the Bank of England will tighten monetary policy faster than the European Central Bank or the US Federal Reserve.
Trading recommendations
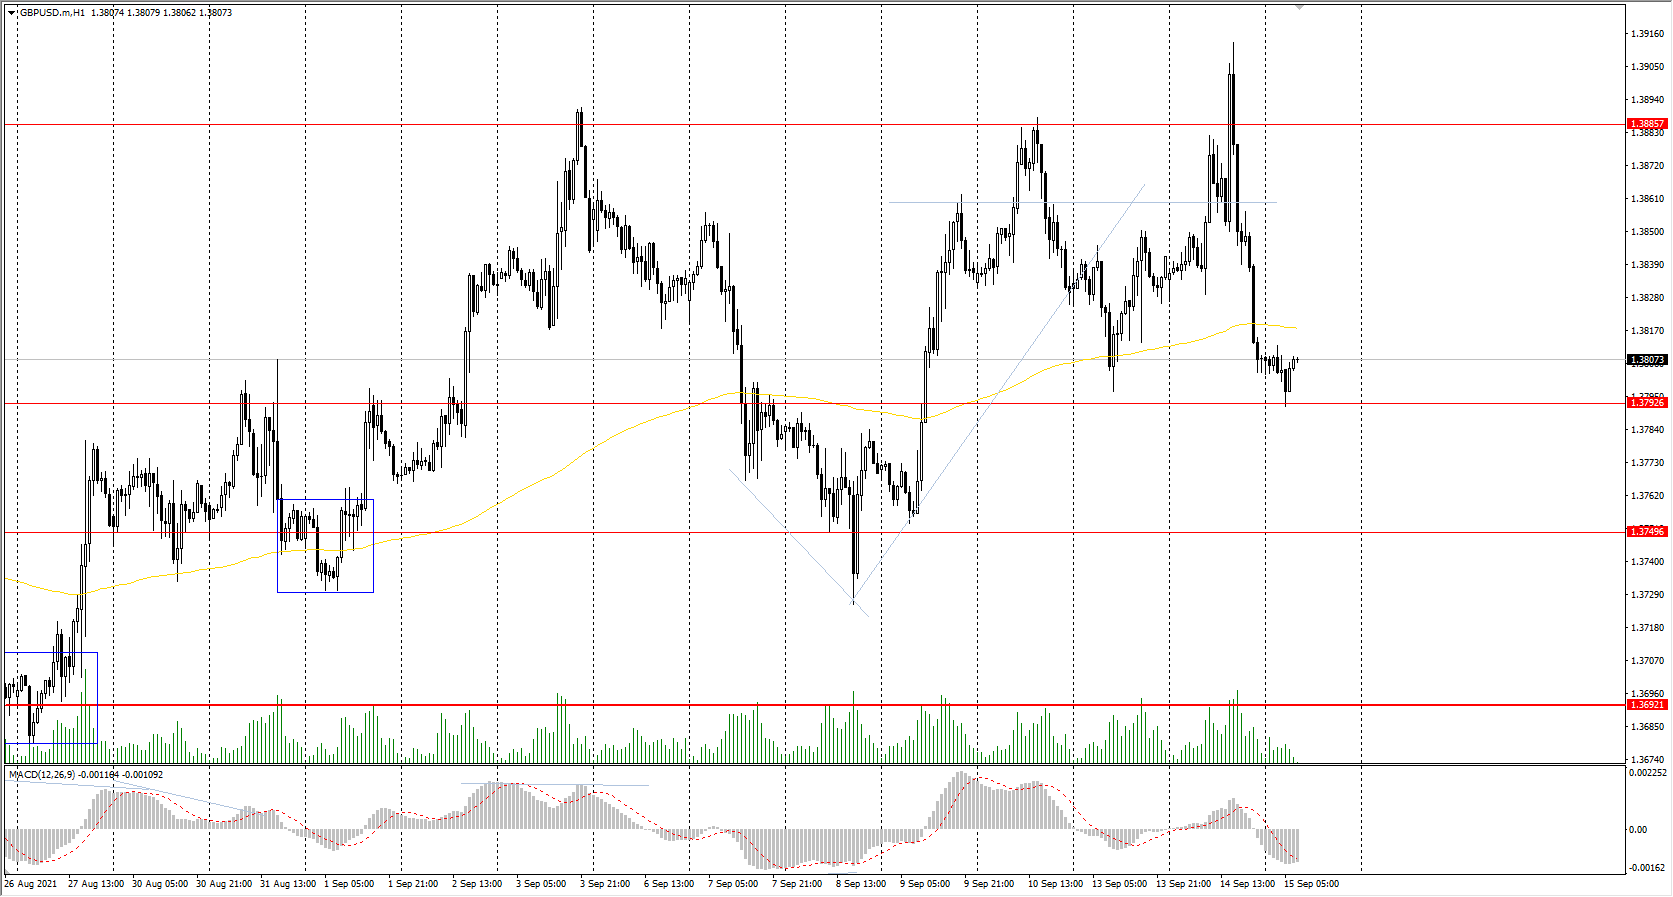
Support levels: 1.3793, 1.3750, 1.3692, 1.3632, 1.3614, 1.3525
Resistance levels: 1.3886, 1.3935, 1.4002
On the hourly time frame, the GBP/USD trend is bullish. But against the background of the dollar index growth, the growth of GBP/USD quotes is limited. The MACD indicator has become negative. Under such market conditions, it is better to look for buy trades from the support levels near the moving average line. Sell positions can be considered from the resistance levels with short targets throughout the day.
Alternative scenario: if the price breaks through the 1.3692 support level and consolidates below, the bearish scenario will likely resume.
News feed for 2021.09.15:
- UK Consumer Price Index (m/m) at 09:00 (GMT+3).
The USD/JPY currency pair
Technical indicators of the currency pair:
Prev Open: 109.93
Prev Close: 109.68
% chg. over the last day: -0.23%
Japan's economic prospects remain bleak. Japan's automotive sector is experiencing difficulties due to delays in global supply chains. Japan's economy grew at a faster-than-expected pace in the second quarter of this year. Still, due to tight restrictions in most of the country, economists expect a slowdown in the pace of recovery based on the results of the third quarter.
Trading recommendations
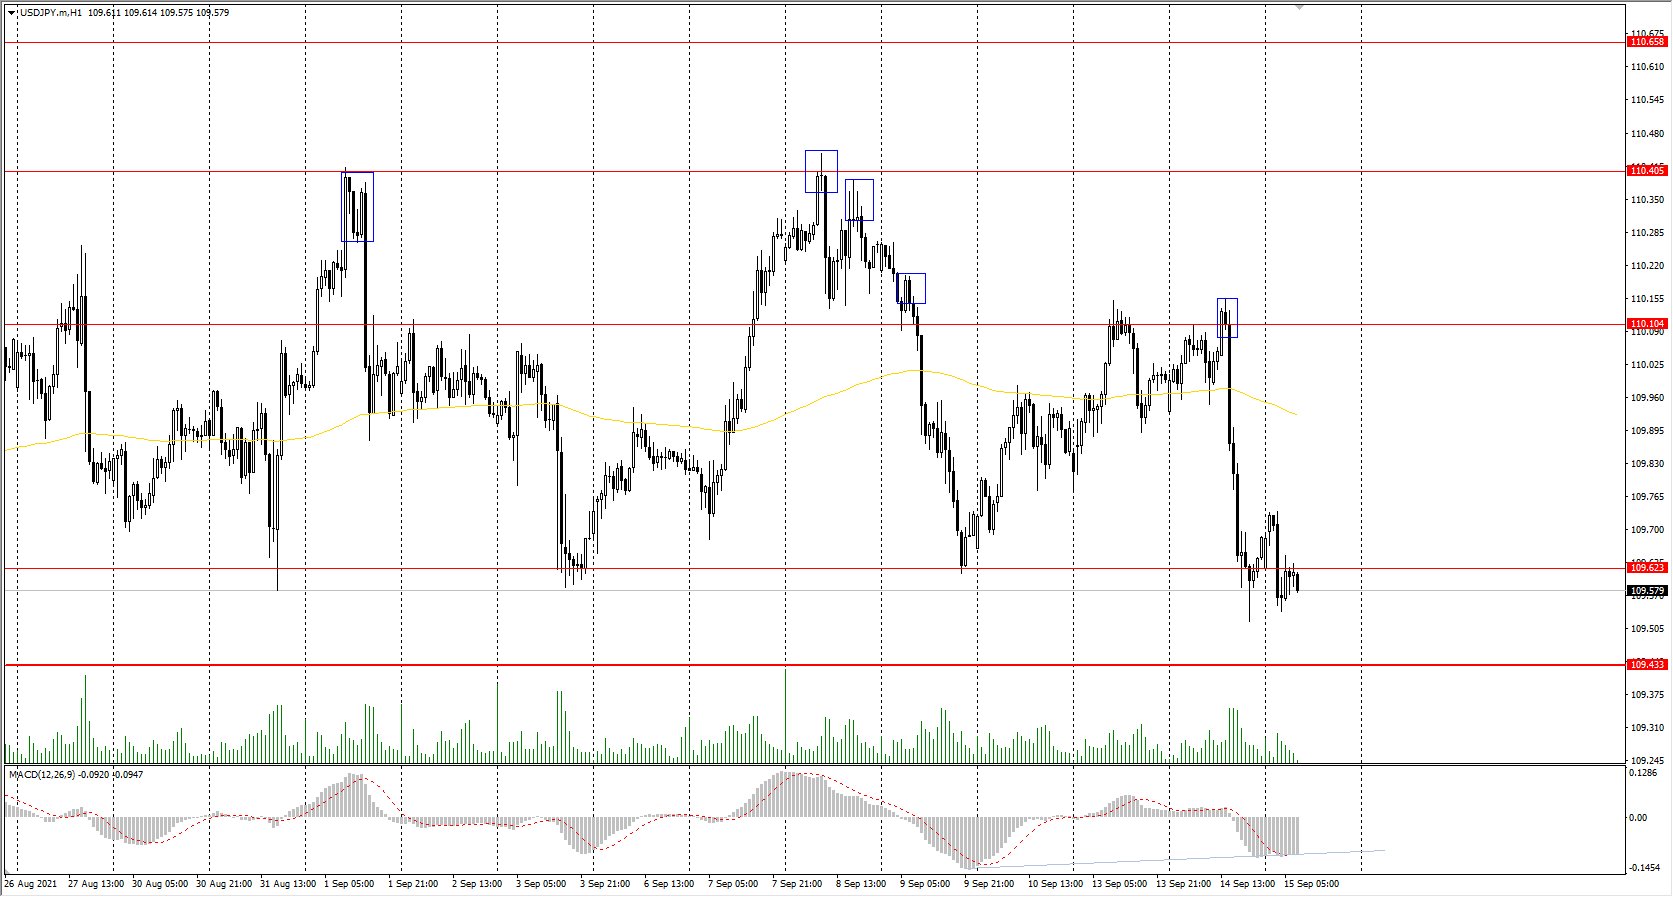
Support levels: 109.62, 109.43, 109.19, 108.65
Resistance levels: 110.11, 110.40, 110.66, 110.95, 111.48
The main trend on the USD/JPY currency pair is bullish. But the Japanese yen has been showing strength recently, even despite the rise in the dollar index. The MACD indicator has become negative, but there are signs of sellers’ weakness. Under such market conditions, traders should look for buy trades from the support level of 109.43, which is also a priority change level. Sell positions should be considered on the lower time frames with short targets from the zones where sellers show initiative.
Alternative scenario: if the price falls below 109.43, the uptrend is likely to be broken.
The USD/CAD currency pair
Technical indicators of the currency pair:
Prev Open: 1.2642
Prev Close: 1.2692
% chg. over the last day: +0.40%
The Canadian dollar is a commodity currency, so the USD/CAD currency pair is highly dependent on the dynamics of the dollar index and oil prices. Yesterday, the dollar index increased while oil prices went down. As a result, the price of USD/CAD increased by almost half a percent.
Trading recommendations
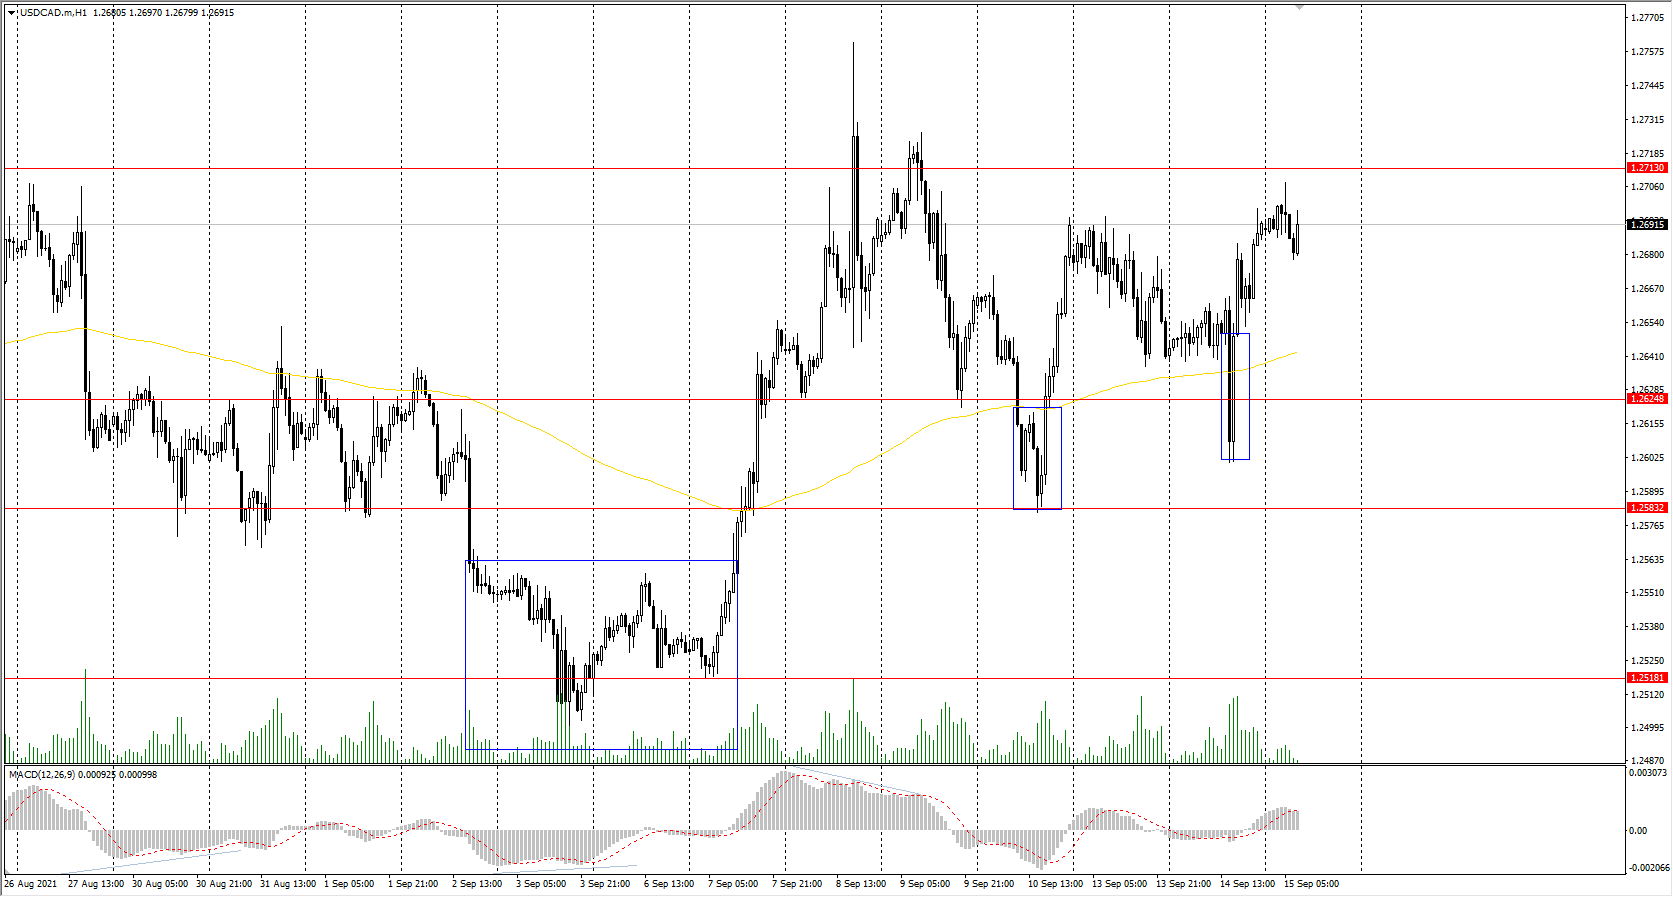
Support levels: 1.2625, 1.2583, 1.2518, 1.2425
Resistance levels: 1.2713, 1.2812, 1.2891, 1.2951
In terms of technical analysis, the trend on the USD/CAD currency pair is bearish. But due to the growth of the dollar index, the price has consolidated in a local correctional upward movement. The MACD indicator is in the positive zone again. Buy positions can be considered from the support levels where buyers show initiative, and only with short targets. It is better to look for sell positions from the resistance levels of a higher time frame.
Alternative scenario: if the price breaks through the 1.2812 resistance level and fixes above, the uptrend will likely resume.
USDJPY Battles With 23.6% Fibo, Loses Ground In Near-Term
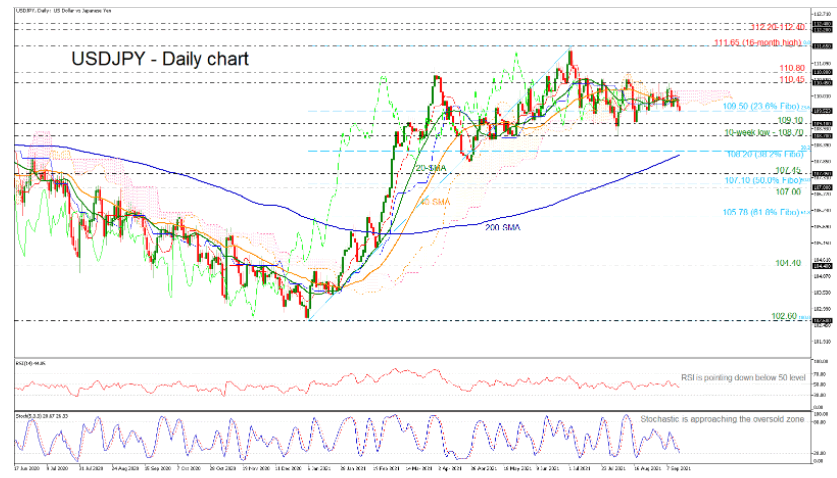
USDJPY has been in a battle with the 23.6% Fibonacci retracement level of the up leg from 102.60 to 111.65 at 109.50 over the last month, creating a tight sideways channel.
The 20- and 40-day simple moving averages (SMAs) as well as the Ichimoku cloud are acting as significant resistance regions. In terms of technical indicators, the RSI is declining in the negative area, while the stochastic is approaching the oversold zone, suggesting steeper decreases in the market.
If the negative pressures intensify, initial tough support could develop from the 109.10 barrier and the ten-week low of 108.70. Pushing under these levels, the 108.20 support, which is the 38.2% Fibonacci and stands near the tough 200-day SMA, may halt further loss.
If buying interest intensifies, resistance may originate from a trench of peaks from 110.45 to 110.80. Overcoming this boundary, the price may jump for the 16-month high of 111.65 before the 112.20-112.40 zone draw traders’ attention.
In brief, the very short-term bias is neutral near the SMAs and the Ichimoku cloud. A break either above 110.80 or below 108.70 could reveal the next clearer direction.
US 30 Breaks Support
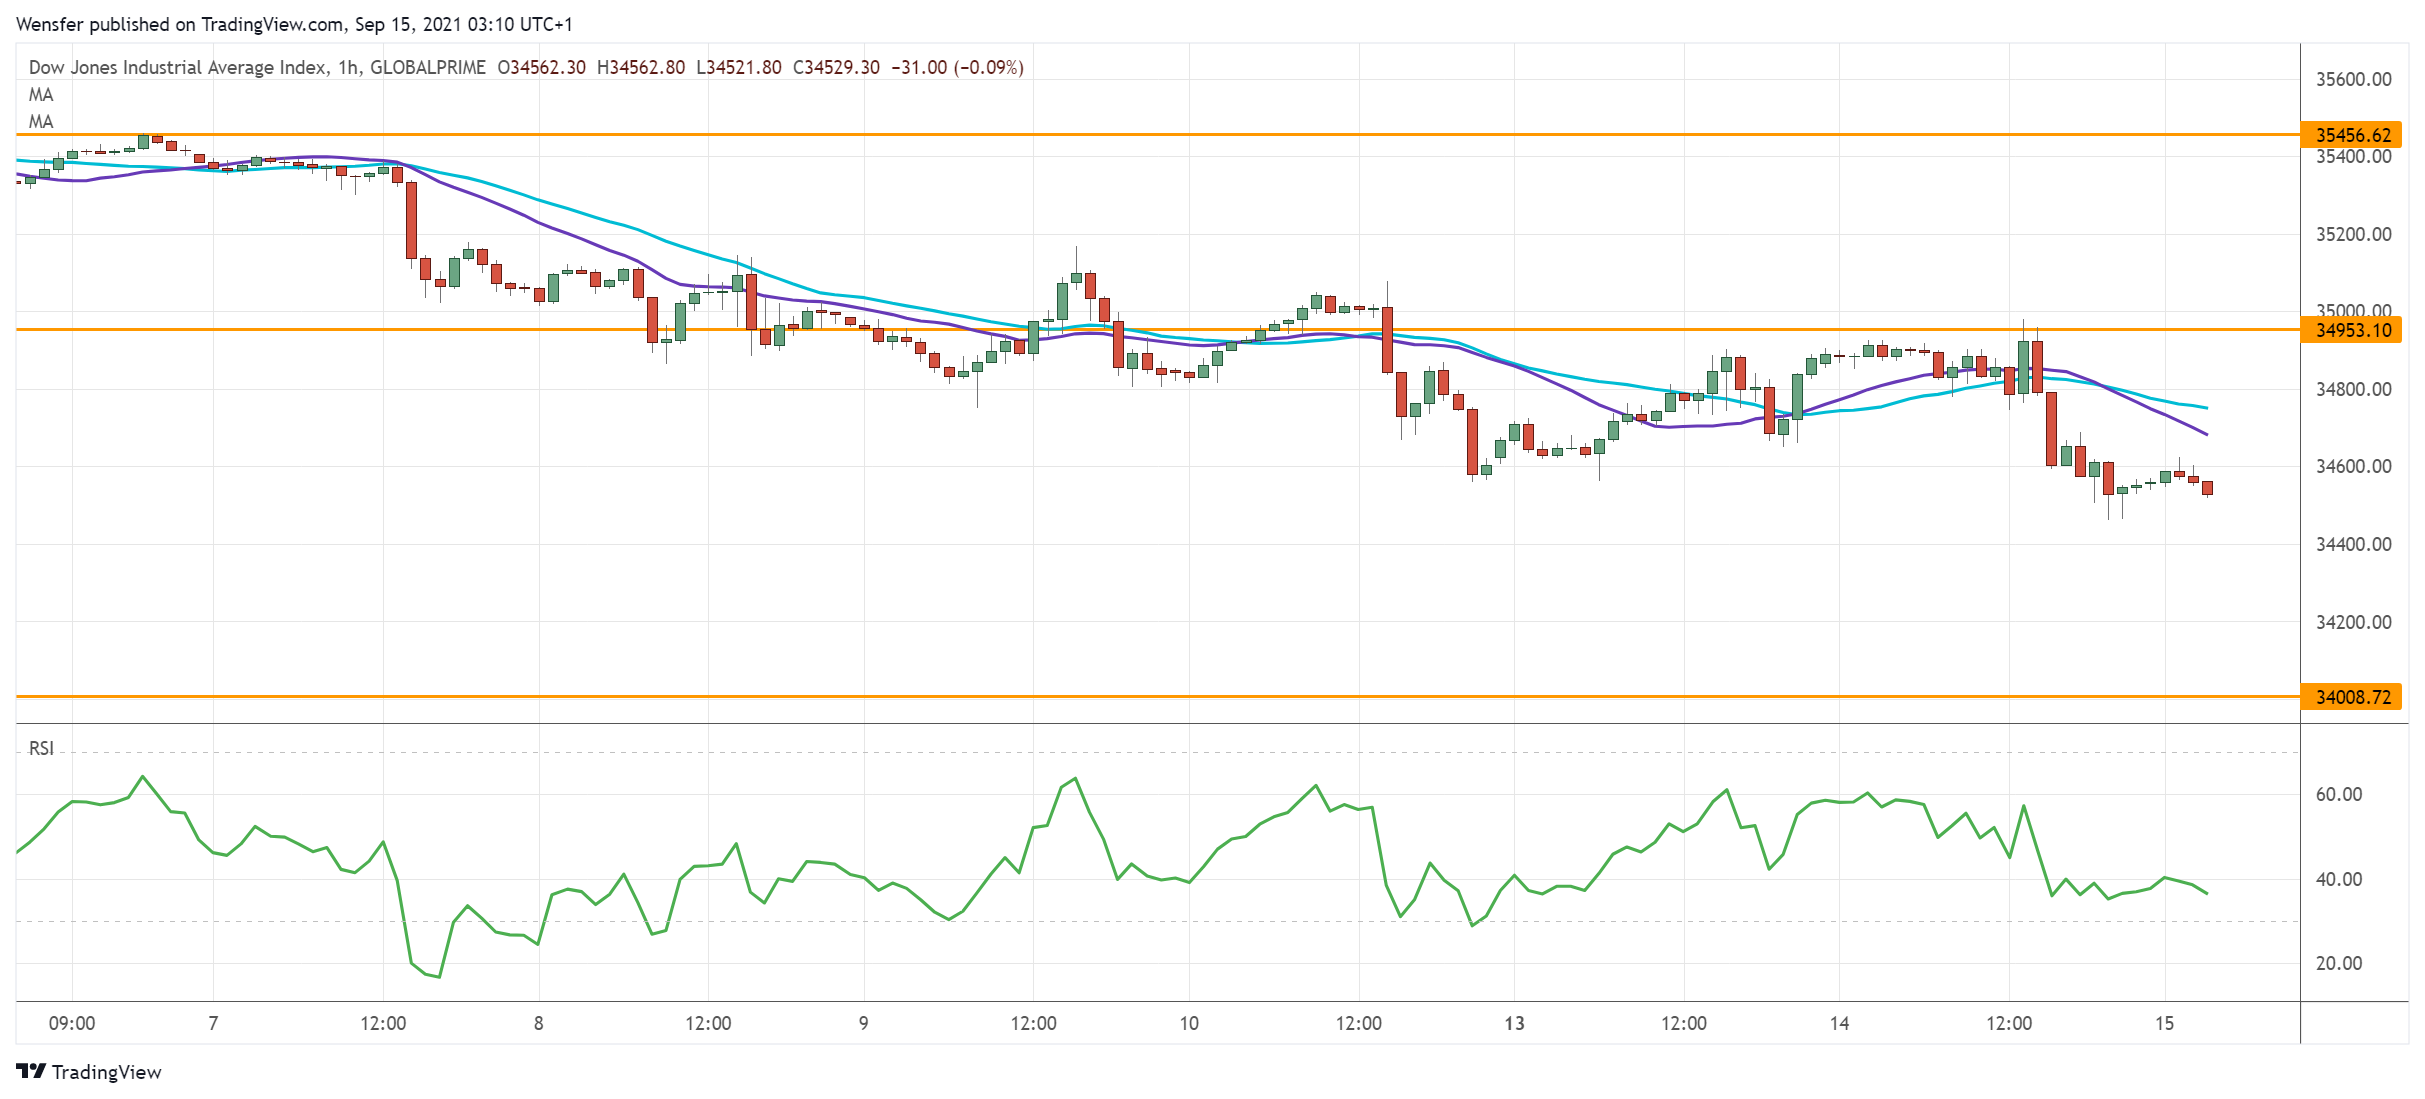
The Dow Jones 30 retreated as last month’s US inflation remained above the Fed’s target. The index was bought out of the dip over the daily support at 34580.
The rebound turned out to be short-lived after a breakout invalidated this key floor. A bearish MA cross indicates that sentiment has become increasingly downbeat.
The psychological level (34000) from last July would be the next target. On the upside, 34950 is a fresh resistance where sellers would be eager to erase any rebound.
XAU/USD Bounces Off Demand Zone
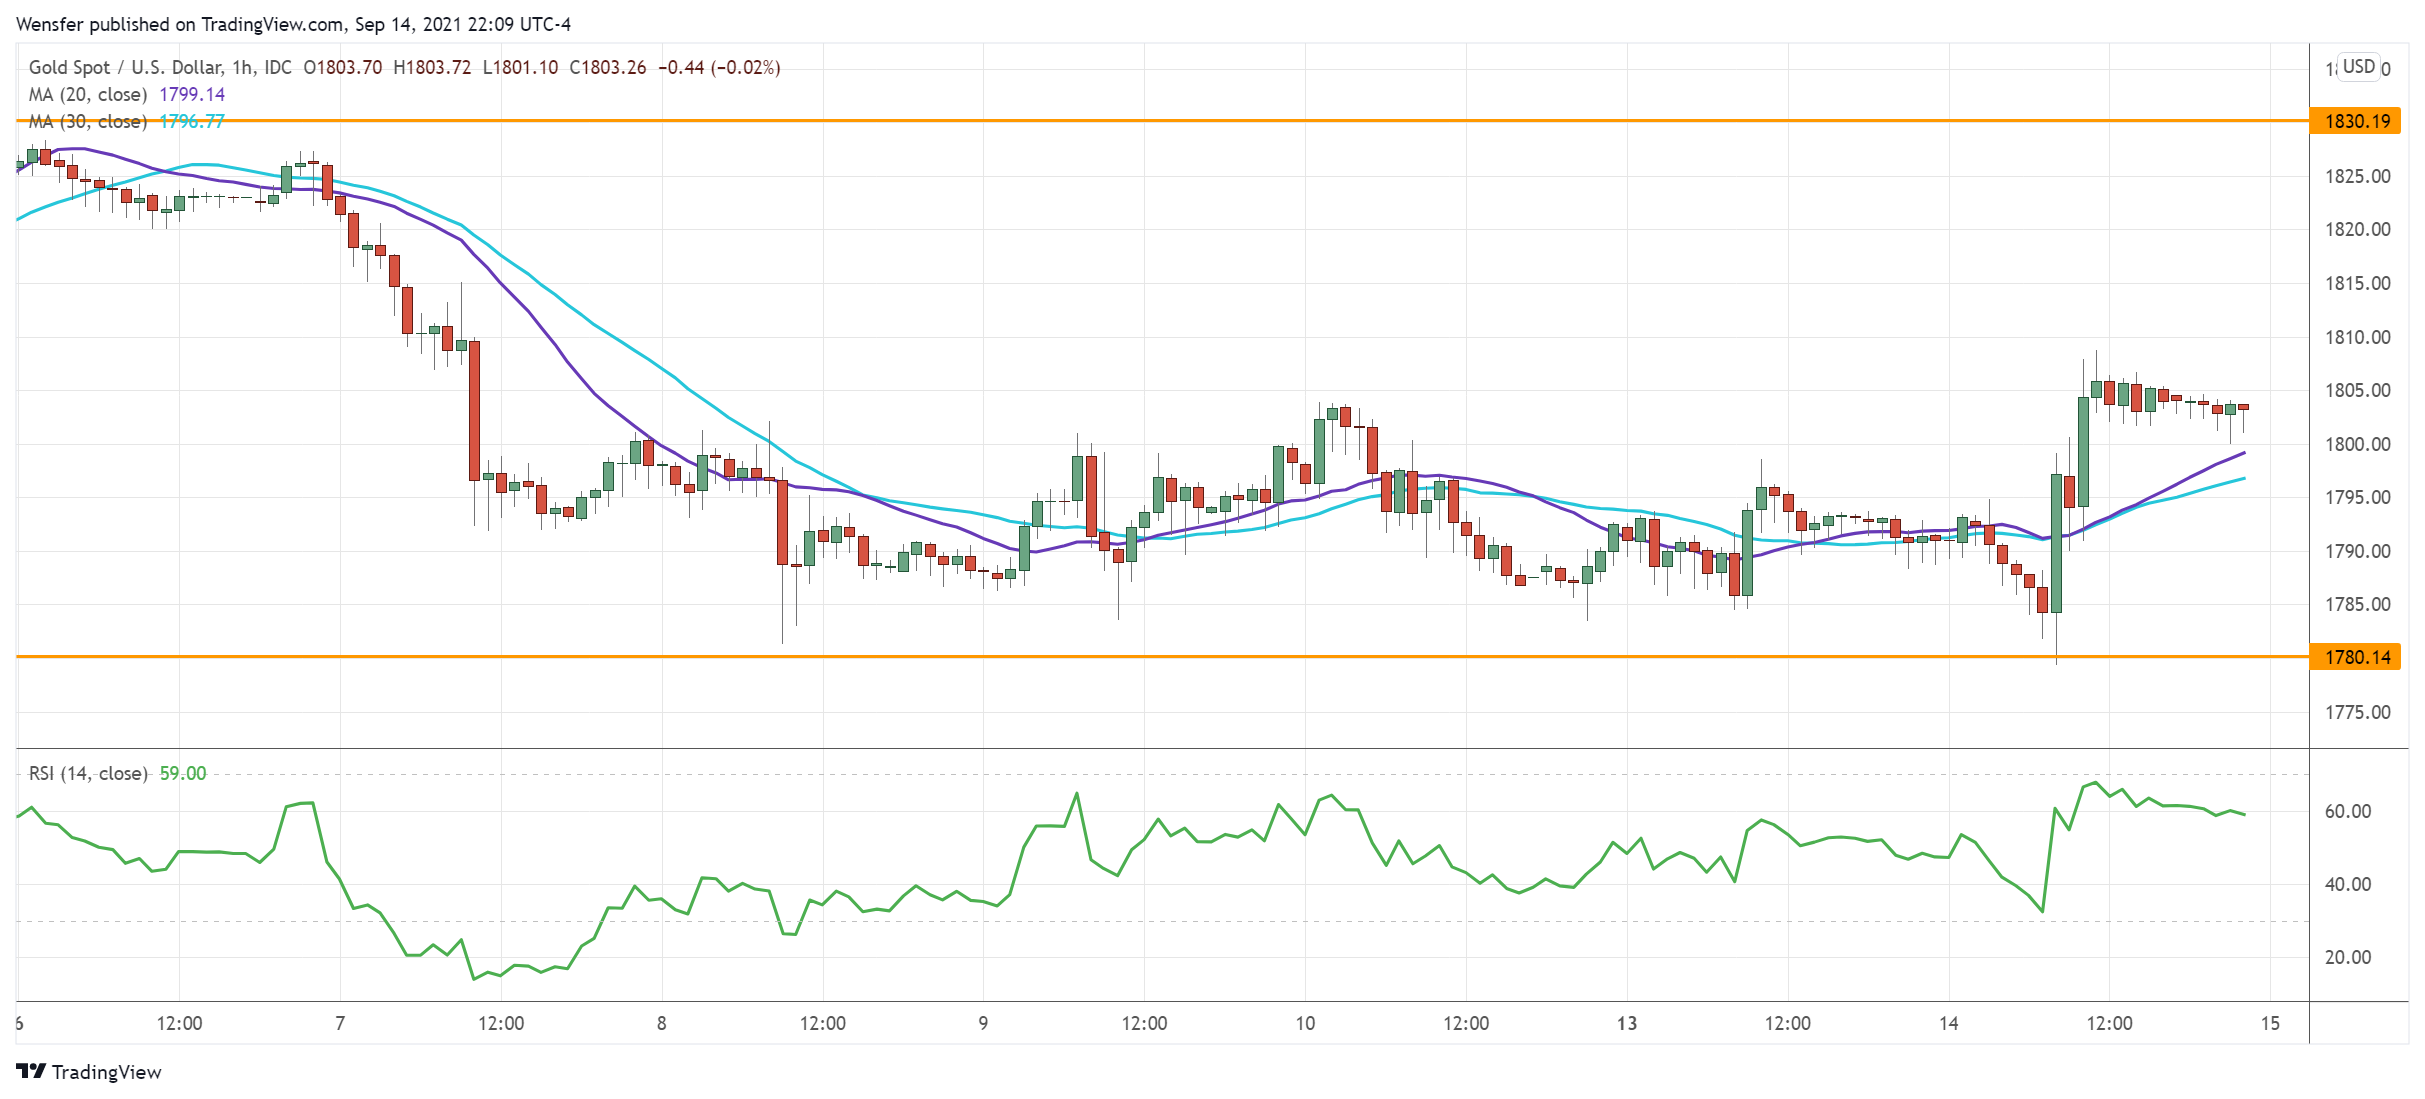
Gold surged thanks to a decline in Treasury yields. The precious metal had met stiff selling pressure at the triple top (1830) from the daily chart.
Short-term sentiment has turned positive after a week-long consolidation above the demand area of 1780. The break above 1803 would prompt the bears to cover their bets. An overbought RSI may trigger a temporary pullback.
A rebound would challenge the critical level of 1830 once again, where a bullish breakout may resume the five-week-long rally.
USD/CHF Seeks Support
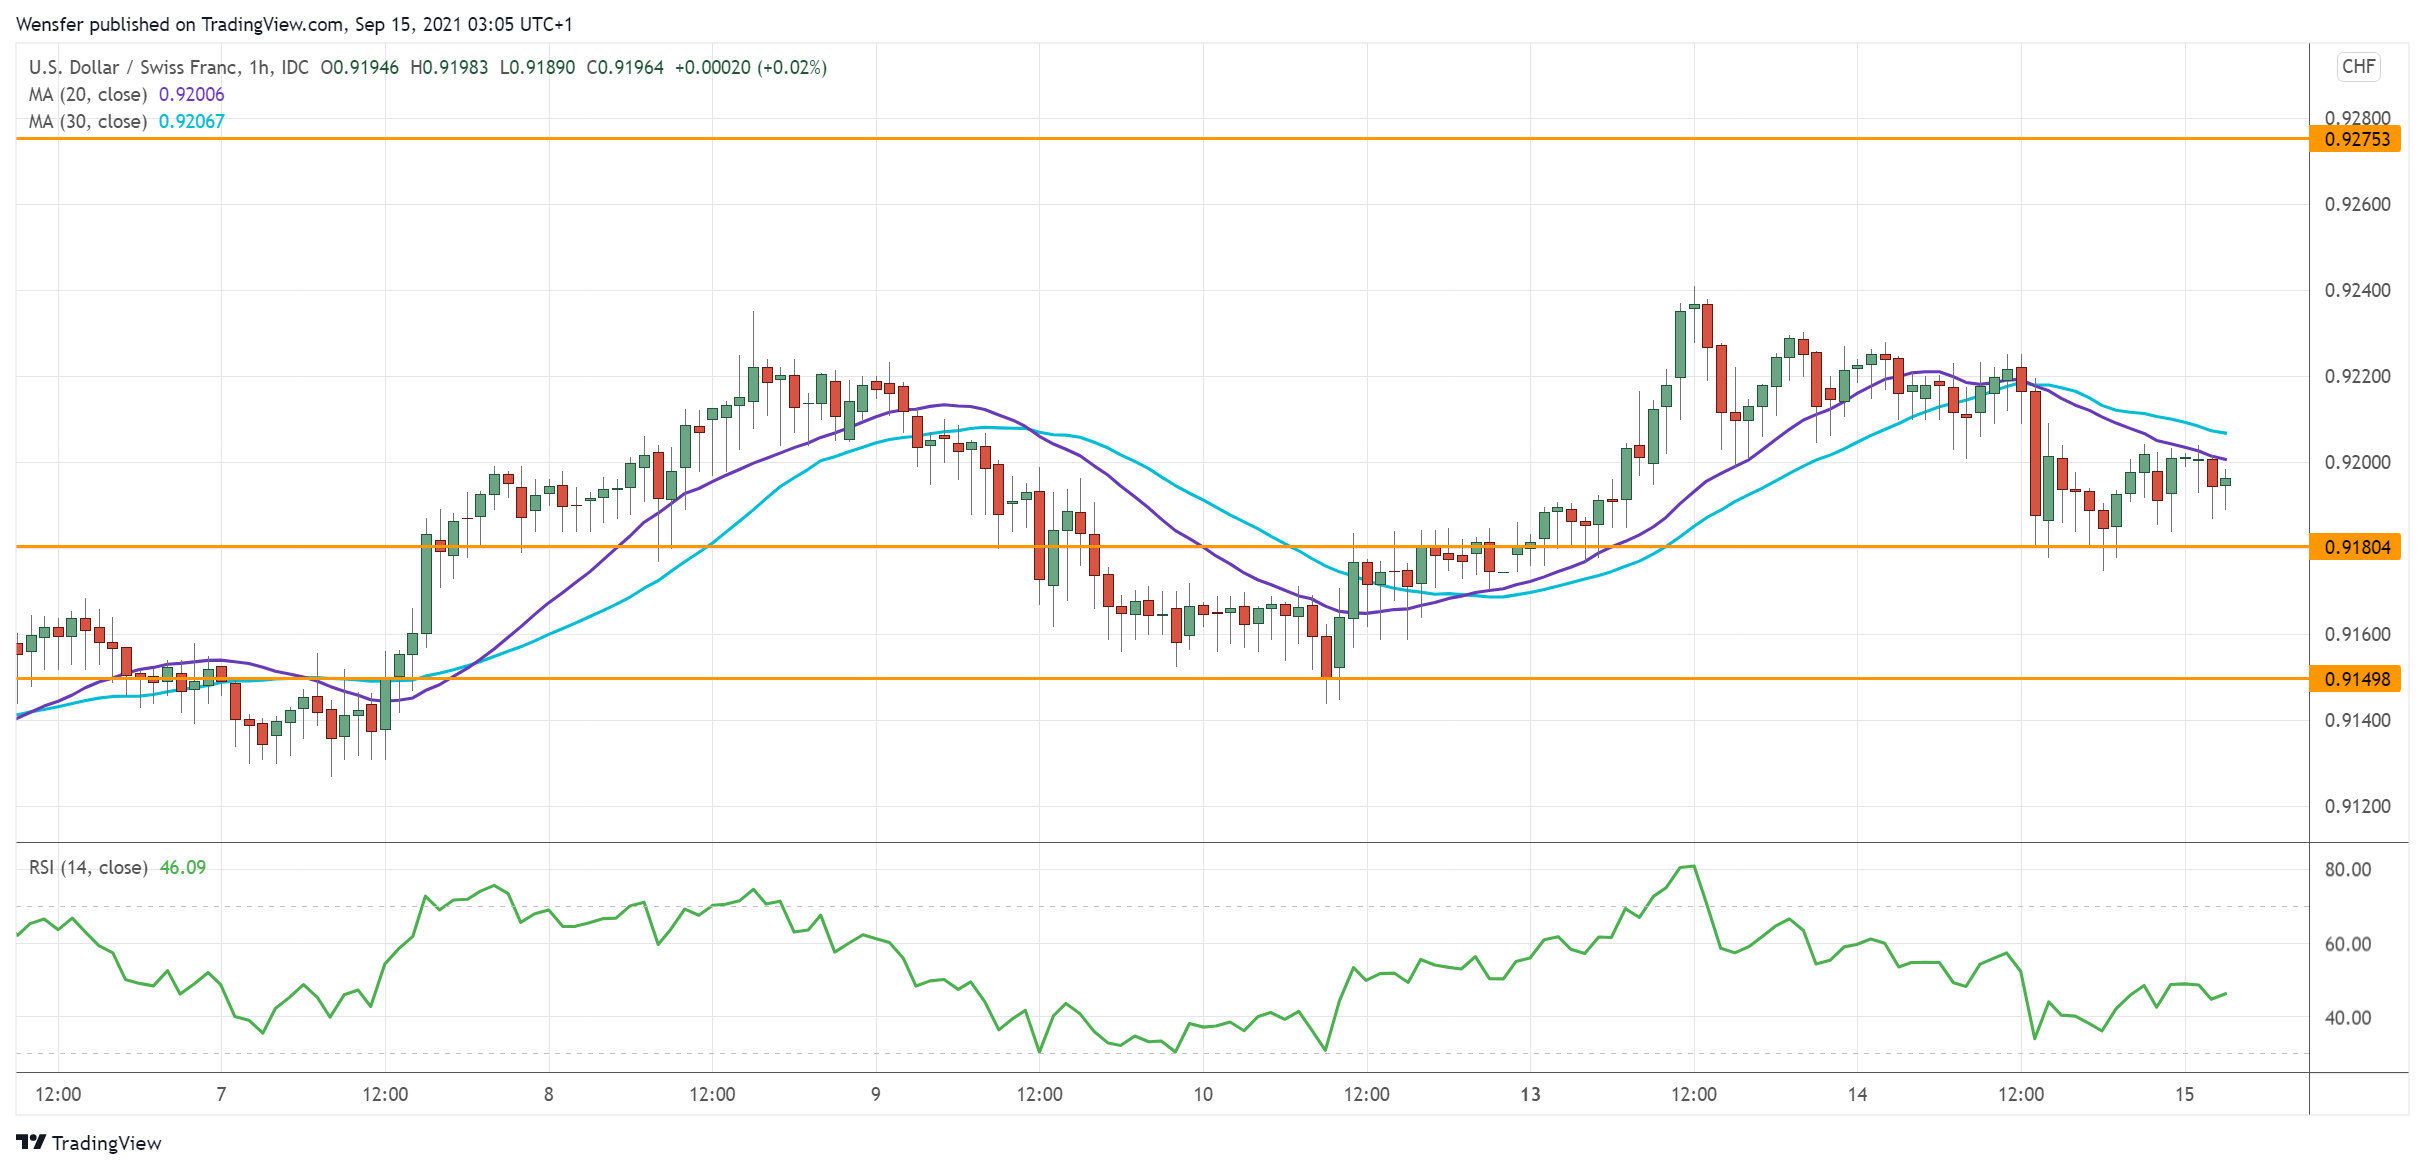
The US dollar initially tumbled after a minor drop in August’s core CPI. However, the pair can capitalize on strong buying interest from the trough near 0.9150.
A tentative break of August’s high at 0.9240 suggests that buyers are in control of price action. Though an overbought RSI has tempered the bullish drive, the latest pullback to 0.9180 can be an accumulation phase.
A rebound may lift bids to July’s high at 0.9275. A breach of that ceiling would attract momentum buying and resume the greenback’s rally.
China Marks The Way For Markets Down
Once again, decline prevails on the stock markets. US indices closed lower for the fifth trading session out of the last six. Chinese statistics added to the anxiety in the markets on Wednesday morning, failing to meet the forecasts.
Most worrisome was a 2.5% y/y rise in retail sales compared to 8.5% a month earlier and the expected 7.0%. Industrial production is also losing steam, adding 5.3% y/y vs 6.4% a month earlier and 5.8% expected. Local lockdowns and high commodity prices hold back growth in the second-biggest economy much stronger than expected, returning pessimism to the markets.
Technically, the pressure on US equity markets echoes what we have seen every month since April: indices are slumping ahead of the monthly or quarterly expiration of futures and options on the third Thursday of the month, slang termed "witching day". In most cases, the S&P500 has pulled back to its 50-day moving average by the expiration date, finding buyers immediately afterwards.
The big question is whether this tactic will work this time. It is not uncommon for markets to experience significant long-term trend reversals near expiration dates. Therefore, cautious traders should wait for the "witching day" pattern to end. A consolidation below the 50-day moving average might initiate a deeper correction, by 5-10%, one we have not seen since last October.
The reversal confirms the technical picture on the bears' side to the downside in the Chinese stock indices. In the Hang Seng, H-star and A50, the selling pressure has intensified on the downward approach of the 50-day moving average, indicating a continued bearish trend. In 2020 the selling pressure started precisely from the Chinese markets. America and Europe only ignored this reversal for a few weeks and then reversed downwards at an unprecedented speed in history.
Negative market dynamics and signs of a loss of momentum in the economy could affect the Fed's plans to roll back stimulus. The next FOMC meeting is a week away, kicking off a "period of silence" when Fed officials are not commenting. It promises to be a very nervous week for the markets.
The Greenback In Current Market Circumstances Could Hold The Benefit Of The Doubt
Markets
US CPI was the main catalyst for trading yesterday. Headline inflation slowed in August marginally from 5.4% to 5.3% y/y, in line with market expectations. Core inflation grew at a slower pace as well: at 4%, down from 4.3% and less than the 4.2% expected. Despite being at very elevated levels, the very fact that the numbers are topping off solidified markets’ belief in the temporary inflation narrative by the Fed. The US yield curve bull flattened with changes varying from -0.6 bps (2y) to -4.7 bps (20y). Inflation expectations were the driver. German yields suffered unfortunate collateral damage, reversing a 2bps advance (in the 10y) to a 1bp loss. The USD in a first reaction got hammered but pared gains later in the session with a deteriorating risk sentiment (WS up to 0.84% down) throwing the greenback a lifeline. EUR/USD finished a bit slower just north of 1.18. The Japanese yen was well bid. USD/JPY closed at 109.69, EUR/JPY aborted an attempt to recoup 130 to close at 129.47. Sterling came under pressure in the risk-off. EUR/GBP rebounded from the 0.851 area after a good but near-consensus UK jobs report to end at 0.855.
Asian-Pacific equities are moody this morning. It follows yesterday’s performance on WS and is being exacerbated by a slew of unconvincing Chinese data (see headline below). The Japanese yen builds further on Tuesday’s outperformance. In Turkey, the CBRT yesterday after-market raised the reserve requirement ratios for holding FX deposits by 200bps. EUR/TRY (9.97) is holding steady just south of 10. The USD oscillates around opening levels. Californian voters have rejected a recall of Democratic Governor Newsom, removing an admittedly small tail risk of Democrats ending up losing their Senate majority. Core bonds tread water.
We’re getting an industrial update in the US today with the Empire Manufacturing indicator and industrial production figures. Their impact on markets may be minimal in the run-up to tomorrow’s retail sales. The greenback in current market circumstances could hold the benefit of the doubt even as yesterday’s CPI made part of the market ponder the Fed’s intentions going forward. EUR/USD 1.1752/56 still serves as a first support. The US 10y slipped below the supporting trendline while the German variant again escaped the upward channel to the downside. Support for both is situated at 1.2479% and the -0.36/-0.35% area respectively. Speeches by ECB’s Schnabel and Lane are wildcards. Stronger-than-expected inflation in the UK (3.2% headline, 3.1% core) gives the Bank of England another nudge towards policy normalization. Expecting it’ll be very gradual, sterling only moderately edges higher (EUR/GBP towards 0.854).
News headlines
Chinese economic data indicated that the economic recovery faces headwinds both from the demand and the supply side. New coronavirus outbreaks and the impact of floods in some regions slowed the dynamics of domestic demand. Regulatory measures in property and education probably also didn’t help. Supply side bottlenecks continue to hamper production. China August retail sales unexpectedly slumped from 8.5% Y/Y 2.5% Y/Y, slowing YTD growth to 18.1% from 20.7%. Industrial production in August was 5.3% Y/Y, down from 6.4%. YTD growth slowed from 14.4% to 13.1. Fixed investments show a similar pattern (8.9% Y/Y YTD from 10.36%) as the government tries to curb some exaggerations in the property market. All series missed the consensus estimate. The data again had little impact on the yuan. USD/CNY is holding little changed in the 6.4425 area.
The Italian government joined other European countries in preparing steps to curb the impact of rising power prices for consumers. The government already spend €1.2 bln in the second quarter to alleviate the impact of rising power prices reducing the rise in electricity prices from 20% to 9.0%. In case no changes to the system of regulated price calculations are made, retail prices on the non-liberalized retail market could rise as much as 40% in the next quarter. The reform would consider a further review of the system of cost items in the consumer bills. System costs, amongst others, include overheads to cover renewable energy incentives.
Daily Technical Analysis
EUR/USD
Current level - 1.1806
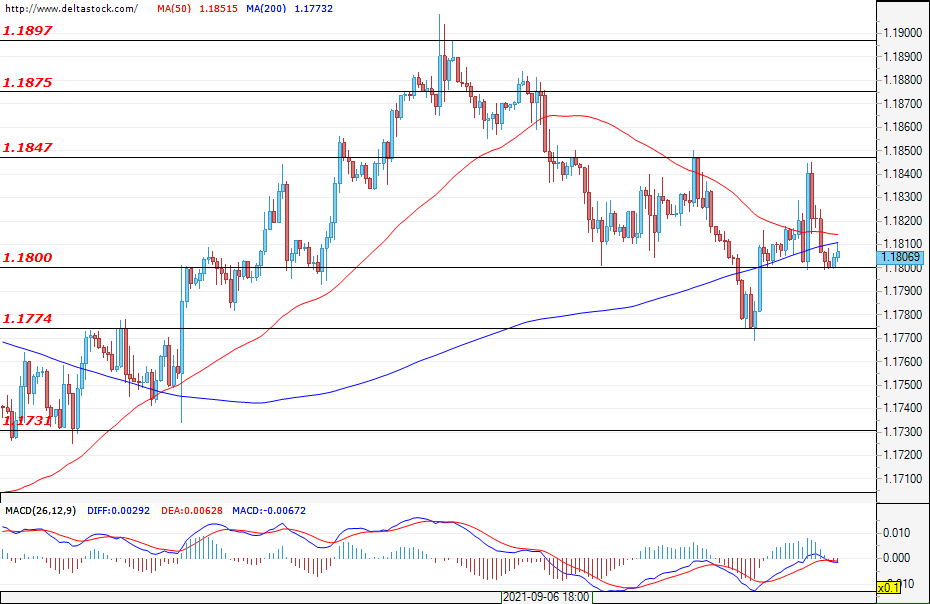
The bears re-entered the market around the resistance at 1.1847 and the currency pair failed to maintain its daily gains. At the moment, the support at 1.1800 is withstanding the bearish pressure, but a second test of the support at 1.1770 is not ruled out. At the moment, the market direction is not clear and the movement in the range between 1.1774 and 1.1847 may continue in the next trading sessions. The daily support remains at 1.1800, and the main one is found at 1.1774. If the latter is breached, the bears can gain momentum and test the lows at around 1.1731.
| Resistance | Support | ||
| intraday | intraweek | intraday | intraweek |
| 1.1847 | 1.1900 | 1.1800 | 1.1730 |
| 1.1875 | 1.1950 | 1.1774 | 1.1700 |
USD/JPY
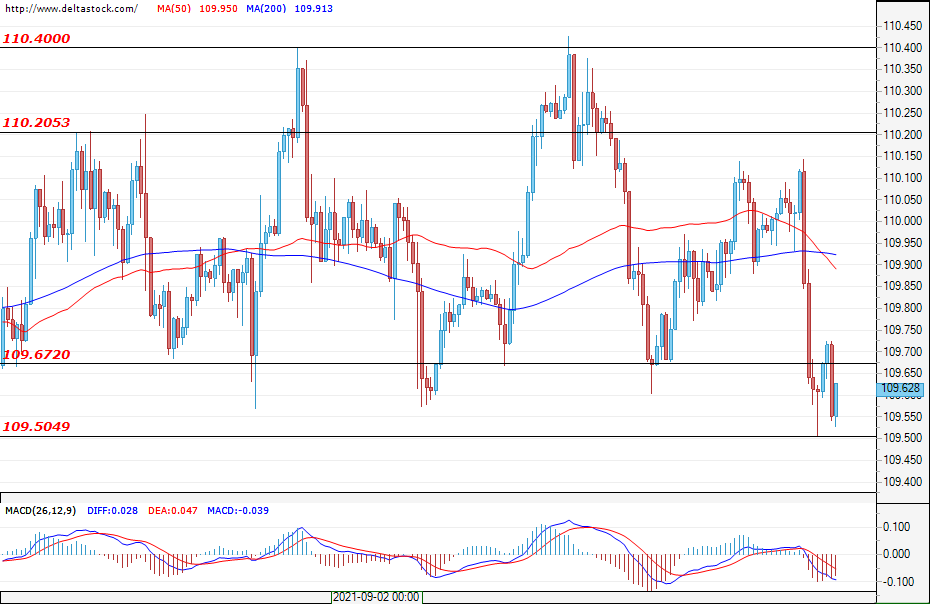
Current level - 109.62
The bears re-entered the market around the resistance at 1.1847 and the currency pair failed to maintain its daily gains. At the moment, the support at 1.1800 is withstanding the bearish pressure, but a second test of the support at 1.1770 is not ruled out. At the moment, the market direction is not clear and the movement in the range between 1.1774 and 1.1847 may continue in the next trading sessions. The daily support remains at 1.1800, and the main one is found at 1.1774. If the latter is breached, the bears can gain momentum and test the lows at around 1.1731.
| Resistance | Support | ||
| intraday | intraweek | intraday | intraweek |
| 109.67 | 110.40 | 109.50 | 108.50 |
| 110.20 | 111.00 | 109.23 | 108.00 |
GBP/USD
Current level - 1.3797
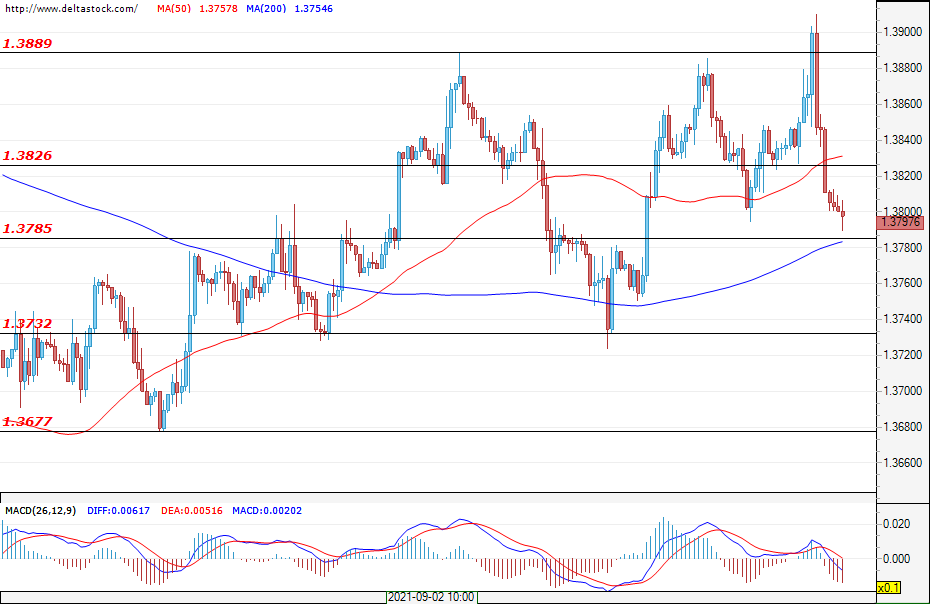
The Cable was aggressively sold out at around 1.3900 and the bears managed to breach the support at 1.3826. After this failed peak, the market is likely to be sitting at the beginning of a downtrend. A confirmation of the breach of 1.3826 would strengthen these expectations. The first support is 1.3785, followed by the one at 1.3732. If 1.3785 holds, the market is likely to enter in a range mode, fluctuating between 1.3785 and 1.3860.
| Resistance | Support | ||
| intraday | intraweek | intraday | intraweek |
| 1.3826 | 1.3890 | 1.3785 | 1.3677 |
| 1.3890 | 1.4000 | 1.3732 | 1.3600 |