GBP/USD – 1.2418
GBP/USD – Wave 4 is unfolding as an (A)-(B)-(C) and could have ended at 1.7192
Although cable slipped again last week and near term downside risk remains for the erratic fall from last month’s high of 1.2616 to bring retracement of the rise from 1.2109, reckon downside would be limited to support at 1.2335 and bring another rebound later, above 1.2505-10 would bring test of resistance at 1.2559, break there would signal the retreat from 1.2616 has ended, bring retest of this level, break there would extend the rebound from 1.2109 to previous resistance at 1.2706 but break there is needed to signal another leg of corrective upmove from 1.1986 low is underway for further gain to 1.2800 and then 1.2900, having said that, psychological resistance at 1.3000 would remain intact.
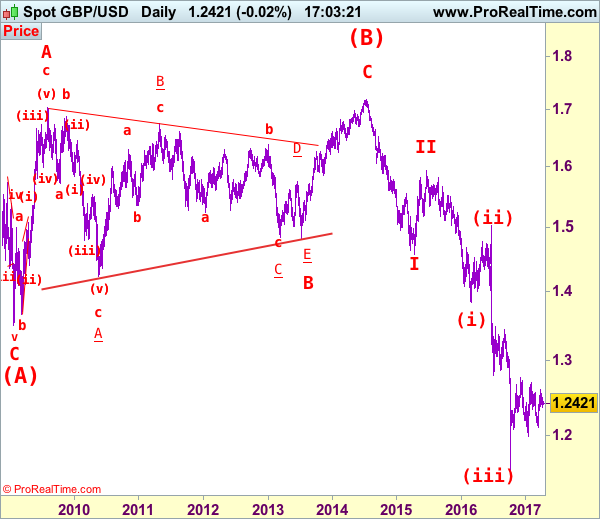
Our preferred count on the daily chart is that cable’s rebound from 1.3500 (wave (A) trough) is unfolding as a wave (B) with A ended at 1.7043, followed by triangle wave B and wave C as well as wave (B) has possibly ended at 1.7192, below support at 1.4232 would add credence to this count, then further fall to 1.4000 level would follow but reckon downside would be limited to 1.3655 support and price should stay above previous support at 1.3500.
On the downside, whilst initial pullback to 1.2360-65 cannot be ruled out, reckon downside would be limited to 1.2335 support and bring another rise later. A daily close below support at 1.2335 would dampen this bullish view and bring weakness to 1.2290-00 but reckon 1.2240-50 would hold, bring another rebound. A drop below 1.2240-50 would suggest the rebound from 1.2109 has ended instead, bring further fall to 1.2200 and then 1.2150-60 but said support at 1.2109 should remain intact.
Recommendation: Buy at 1.2335 for 1.2550 with stop above 1.2235.
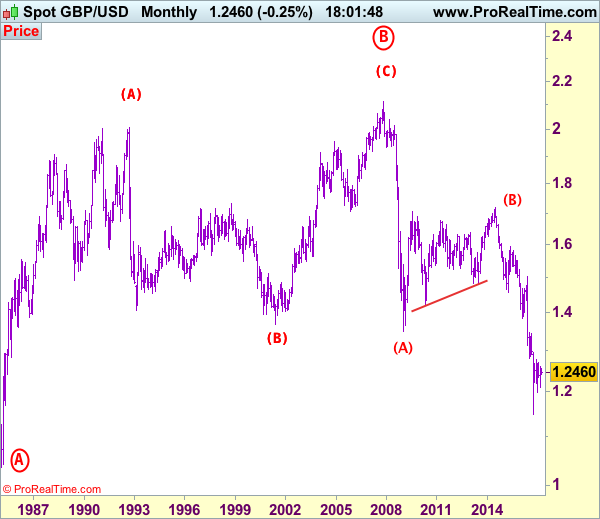
Longer term – Cable’s rise from 1.0520 (Feb 1985) to 2.0100 (September 1992) is seen as [A], the decline to 1.3682 is labeled as (B) and (C) wave rally has ended at 2.1162 (9 Nov, 2007) which is also the top of larger degree wave B with circle. The selloff from there is a 5-waver with wave (A) ended at 1.3500 (23 Jan 2009), wave (B) itself is labeled as A: 1.6733, triangle wave B: 1.4813 and wave C as well as top of wave (B) ended at 1.7192 (2014), hence the selloff from there is an impulsive wave (C) with wave I : 1.4566, wave II 1.5930, an extended wave III is unfolding and already exceeded our downside target at 1.3500 and 1.3000, hence weakness to 1.2500 and possibly 1.2000 cannot be ruled out, however, price should stay well above psychological level at 1.0000.